Managing refinery tenders involves high-value bids, strict timelines, multiple vendors, and complex cost structures. Therefore, refinery procurement and commercial teams must track every tender carefully. However, when tender data stays scattered across multiple Excel files, emails, and manual reports, decision-making slows down. As a result, risks increase and profitability suffers.
That is exactly why the Refinery Tender Dashboard in Excel becomes a powerful and practical solution.
In this detailed article, you will learn what a Refinery Tender Dashboard in Excel is, why it is important, how it works, its complete dashboard structure, key features, advantages, best practices, and frequently asked questions. Moreover, this guide uses clear language, strong transitions, and real refinery business logic so you can confidently apply it in real-world tender operations.
Click to Purchases Refinery Tender Dashboard in Excel
What Is a Refinery Tender Dashboard in Excel?
A Refinery Tender Dashboard in Excel is a ready-to-use, interactive reporting tool designed to track, analyze, and visualize refinery tender data in one centralized place.
Instead of manually reviewing thousands of tender records, this dashboard converts raw data into meaningful KPIs, charts, and insights. Consequently, procurement managers, refinery leadership, finance teams, and commercial heads gain instant visibility into tender performance.
Most importantly, this dashboard works completely inside Microsoft Excel. Therefore, users do not need expensive BI tools or advanced technical skills.
Why Do Refineries Need a Tender Dashboard in Excel?
Refinery tenders deal with large contracts, complex vendor relationships, and high financial exposure. Hence, even a small mistake in tender evaluation can lead to significant losses.
Let us understand why a dedicated tender dashboard is essential.
Common Challenges in Refinery Tender Management
-
Tender data spread across multiple Excel sheets
-
Manual tracking of bid values and estimated costs
-
Limited visibility into profit margins
-
Difficulty comparing vendor performance
-
Slow monthly and management reporting
-
High risk of data errors and inconsistencies
Because of these challenges, refinery teams often struggle to take timely and data-driven decisions.
How a Refinery Tender Dashboard Solves These Problems
A Refinery Tender Dashboard in Excel:
-
Centralizes all tender data
-
Automates calculations and KPIs
-
Provides real-time visual insights
-
Improves transparency and accountability
-
Saves time and reduces manual effort
As a result, refinery teams can focus more on strategy and less on data preparation.
How Does a Refinery Tender Dashboard in Excel Work?
The dashboard works by connecting structured tender data to pre-built charts, cards, and slicers. Whenever users change filters such as State, Tender Type, Category, Vendor, or Month, the dashboard updates instantly.
Core Working Logic
-
Users enter or update tender data in the Data Sheet
-
Excel formulas and pivot tables process the data
-
Charts and KPI cards update automatically
-
Slicers allow interactive analysis
Because of this simple logic, even non-technical users can operate the dashboard easily.
Overall Structure of the Refinery Tender Dashboard in Excel
This dashboard consists of five analytical pages, a page navigator, and supporting data sheets. Each page focuses on a specific area of tender analysis.
Let us explore each component in detail.
Page Navigator: Quick and Easy Navigation
The Page Navigator, located on the left side of the dashboard, allows users to move quickly between different analytical pages.
Why the Page Navigator Matters
-
Saves time while switching pages
-
Improves user experience
-
Makes the dashboard more professional
-
Helps new users understand the structure easily
Because of this feature, users never feel lost while exploring the dashboard.
Click to Purchases Refinery Tender Dashboard in Excel
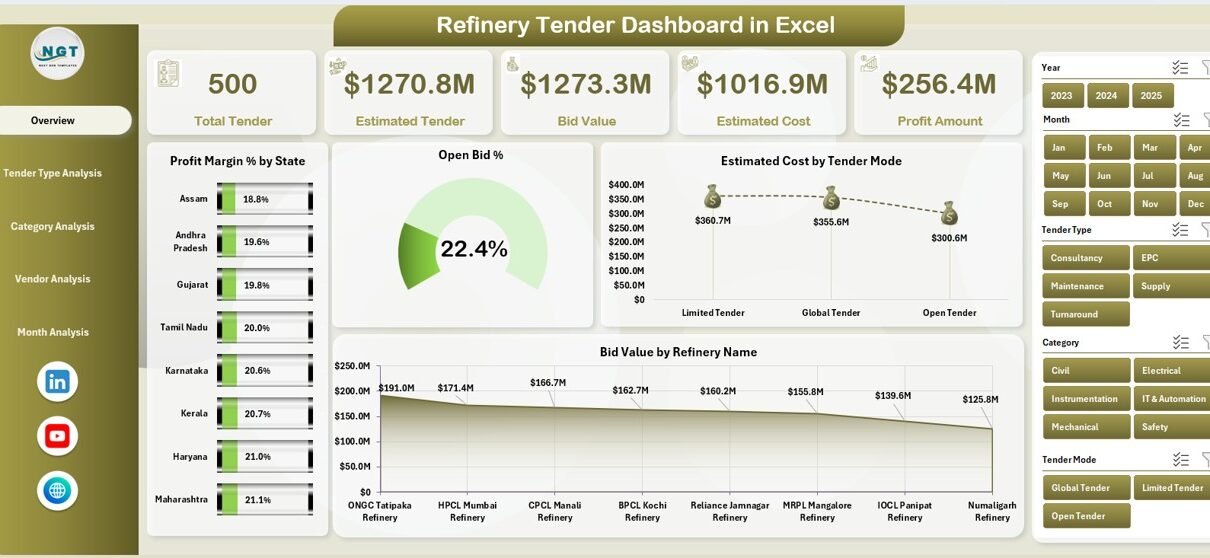
Overview Page: How Do You Get a Quick Snapshot of Tender Performance?
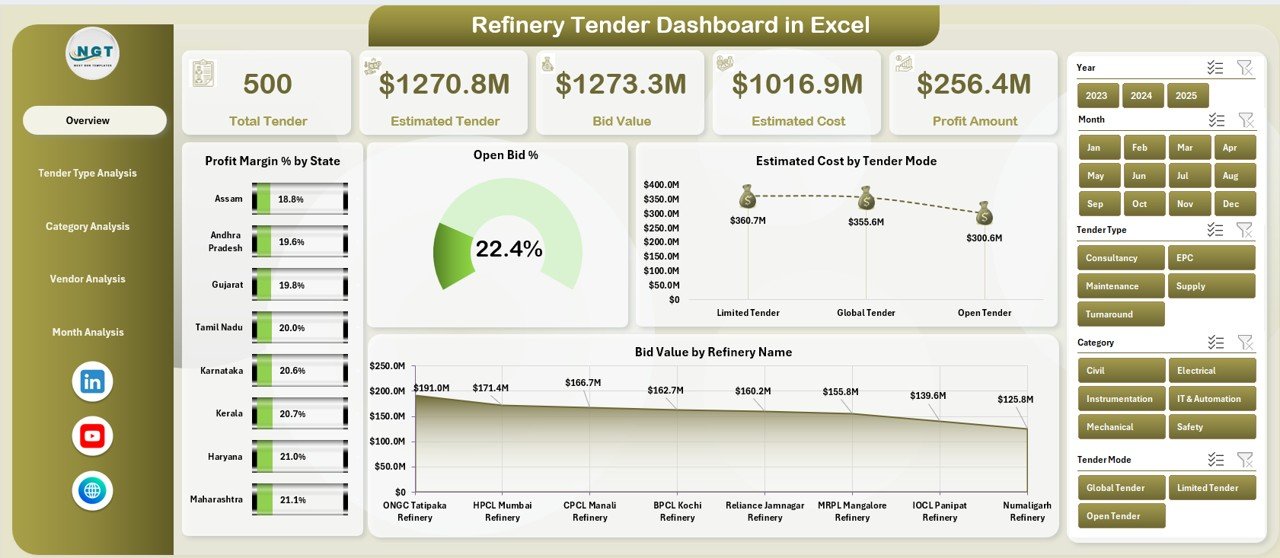
The Overview Page acts as the main control center of the Refinery Tender Dashboard in Excel. It provides a high-level summary of overall tender performance.
Key Elements of the Overview Page
KPI Cards
The page displays four KPI cards that highlight critical performance indicators at a glance.
-
Profit Margin %
-
Open Bid %
-
Estimated Cost
-
Bid Value
These cards help decision-makers quickly assess the overall health of refinery tenders.
Charts on the Overview Page
The Overview Page includes four interactive charts:
-
Profit Margin % by State
-
Open Bid % by State
-
Estimated Cost by Tender Mode
-
Bid Value by Refinery Name
Because these visuals update dynamically, users can instantly identify high-performing and underperforming areas.
Tender Type Analysis: How Does Each Tender Type Perform?
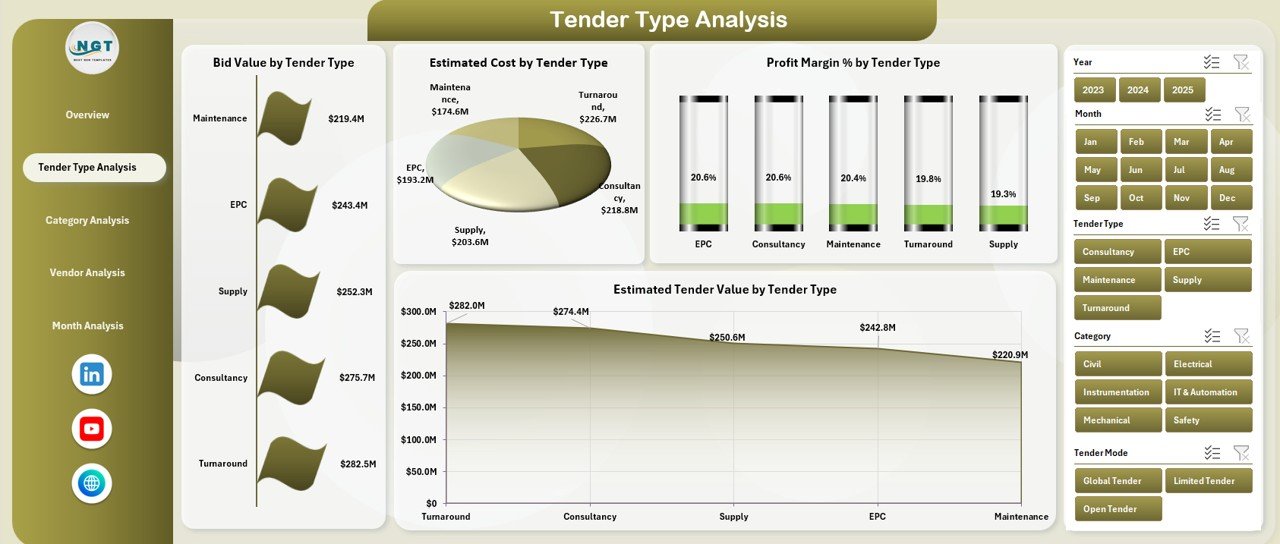
The Tender Type Analysis page focuses on analyzing tenders based on their type, such as open tenders, limited tenders, or negotiated tenders.
Why Tender Type Analysis Is Important
Different tender types carry different risk levels and profit potential. Therefore, analyzing performance by tender type helps in refining procurement strategies.
Charts on the Tender Type Analysis Page
This page includes four insightful charts:
-
Bid Value by Tender Type
-
Estimated Cost by Tender Type
-
Profit Margin % by Tender Type
-
Estimated Tender Value by Tender Type
As a result, procurement teams can quickly identify which tender types generate better margins and which ones require optimization.
Category Analysis: Which Categories Drive the Most Value?
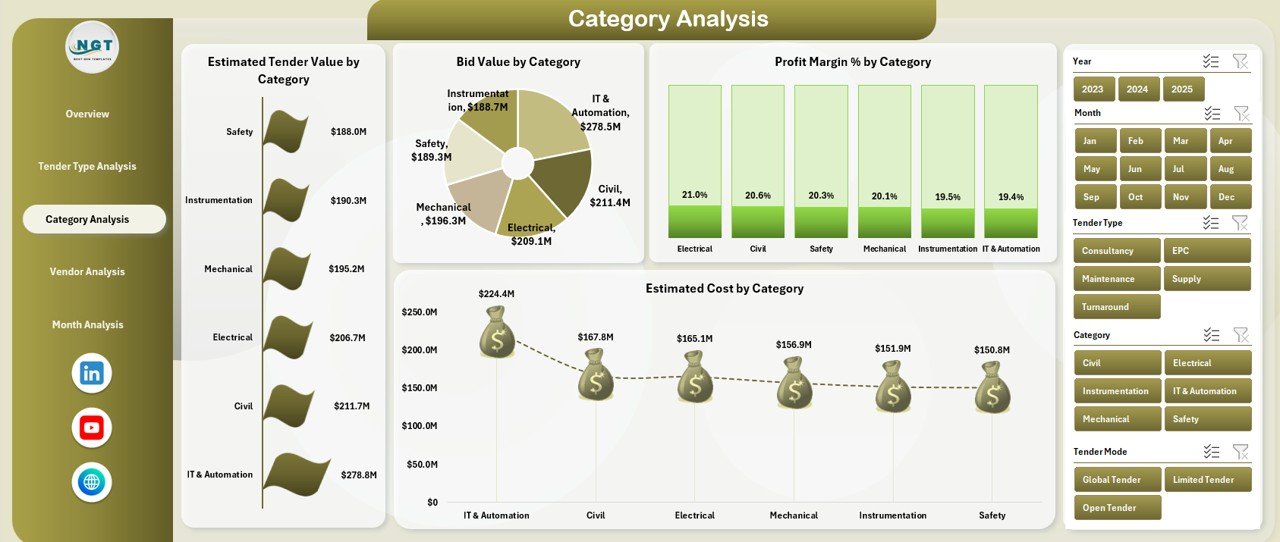
The Category Analysis page helps refinery teams understand performance across different material or service categories.
Why Category-Level Analysis Matters
Some categories generate higher profits, while others involve higher costs or risks. Therefore, category-level visibility becomes essential for cost control and strategic sourcing.
Charts Included in the Category Analysis Page
This page contains four powerful charts:
-
Estimated Tender Value by Category
-
Bid Value by Category
-
Profit Margin % by Category
-
Estimated Cost by Category
With these insights, teams can renegotiate supplier terms or rethink sourcing strategies.
Vendor Analysis: Which Vendors Perform the Best?
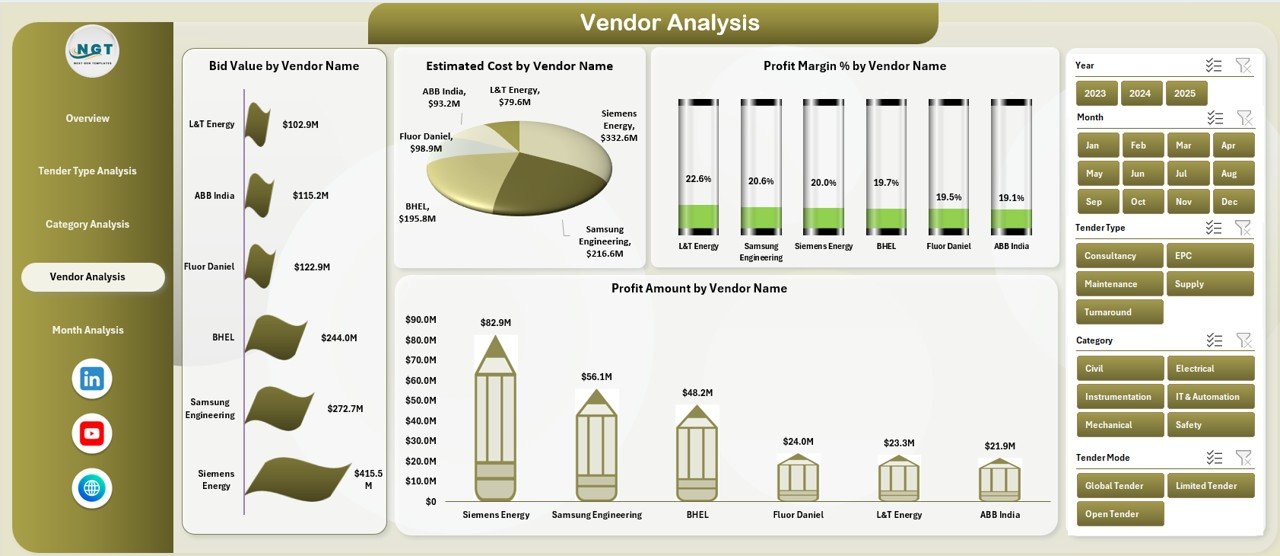
The Vendor Analysis page evaluates tender performance across different vendors.
Why Vendor Analysis Is Critical in Refinery Tenders
Click to Purchases Refinery Tender Dashboard in Excel
Refineries depend heavily on vendors for equipment, maintenance, logistics, and services. Therefore, vendor performance directly impacts project timelines and profitability.
Charts on the Vendor Analysis Page
This page includes four vendor-focused charts:
-
Bid Value by Vendor Name
-
Estimated Cost by Vendor Name
-
Profit Margin % by Vendor Name
-
Profit Amount by Vendor Name
Consequently, refinery teams can identify reliable vendors, manage risks, and improve supplier relationships.
Month Analysis: How Do Tenders Perform Over Time?
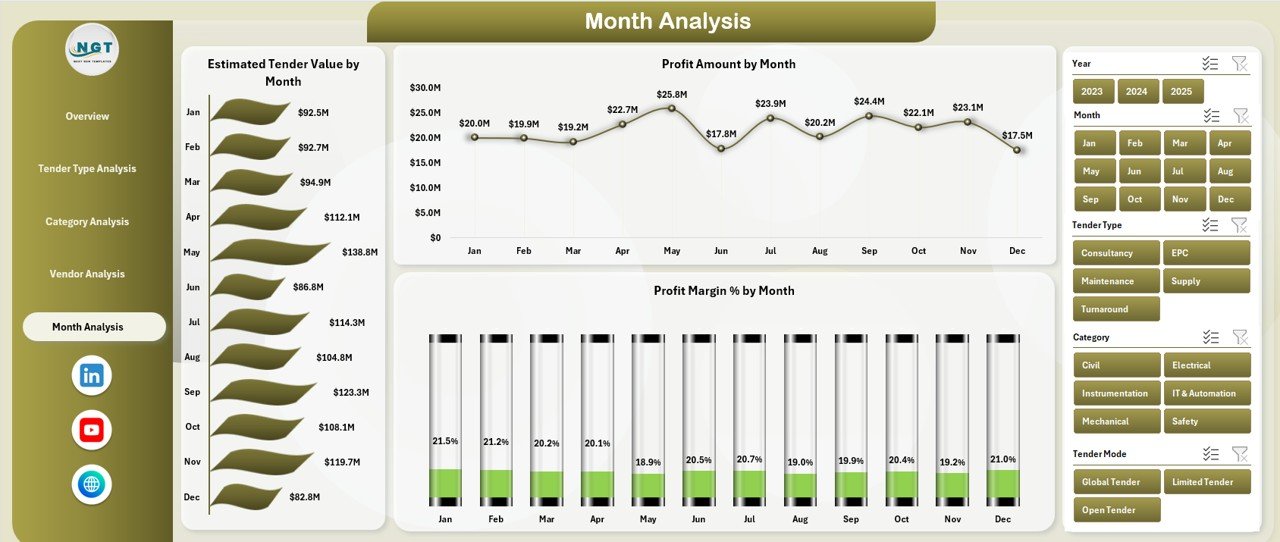
The Month Analysis page tracks tender trends over time.
Why Monthly Trend Analysis Is Important
Monthly analysis helps teams:
-
Identify seasonal trends
-
Monitor performance improvements
-
Detect early warning signs
-
Support forecasting and budgeting
Charts Included in the Month Analysis Page
This page includes three trend-based charts:
-
Estimated Tender Value by Month
-
Profit Amount by Month
-
Profit Margin % by Month
Because these charts highlight patterns over time, leadership teams can make proactive decisions.
Data Sheet and Support Sheet: The Backbone of the Dashboard
Data Sheet
The Data Sheet stores all raw tender data such as:
-
Tender ID
-
Tender Type
-
Category
-
Vendor Name
-
State
-
Bid Value
-
Estimated Cost
-
Profit Amount
-
Profit Margin %
-
Tender Date
Since all calculations depend on this sheet, maintaining accurate data becomes critical.
Support Sheet
The Support Sheet contains:
-
Drop-down lists
-
Validation rules
-
Helper calculations
This sheet ensures data consistency and smooth dashboard performance.
Advantages of a Refinery Tender Dashboard in Excel
Using a Refinery Tender Dashboard in Excel offers several business benefits.
Key Advantages
-
📊 Centralized Tender Visibility
-
⏱️ Faster Decision-Making
-
📈 Improved Profitability Analysis
-
🔍 Better Vendor Performance Tracking
-
📉 Reduced Cost Overruns
-
🧮 Error-Free Calculations
-
💼 Management-Ready Reporting
Because of these advantages, refinery organizations gain better control over tender operations.
Who Can Use a Refinery Tender Dashboard in Excel?
Click to Purchases Refinery Tender Dashboard in Excel
This dashboard suits a wide range of professionals.
Ideal Users
-
Refinery Procurement Managers
-
Commercial and Contract Teams
-
Finance and Cost Control Teams
-
Project Management Offices (PMO)
-
Senior Management and Leadership
Since Excel remains widely used, almost any refinery professional can adopt this dashboard easily.
Best Practices for the Refinery Tender Dashboard in Excel
To get maximum value from the dashboard, follow these best practices.
1. Maintain Clean and Consistent Data
Always use standardized naming conventions for vendors, categories, and tender types. This practice ensures accurate analysis.
2. Update Data Regularly
Update tender data frequently so that the dashboard reflects real-time performance.
3. Use Filters and Slicers Effectively
Apply slicers thoughtfully to focus on specific states, vendors, or months.
4. Review Profit Margins Periodically
Track profit margin trends regularly to identify risks early.
5. Train Users Properly
Provide basic training so users understand how to navigate and interpret the dashboard.
How Does This Dashboard Support Better Decision-Making?
The Refinery Tender Dashboard in Excel supports decision-making by:
-
Highlighting cost-saving opportunities
-
Identifying profitable tender segments
-
Improving vendor negotiation strategies
-
Supporting budgeting and forecasting
-
Enhancing transparency for audits
As a result, refinery leadership can take confident and data-driven actions.
Can This Dashboard Be Customized?
Yes, this dashboard allows full customization.
Customization Options
-
Add new KPIs
-
Modify charts
-
Change color themes
-
Include additional filters
-
Expand data fields
Because Excel offers flexibility, the dashboard can grow with your business needs.
Conclusion: Why Should You Use a Refinery Tender Dashboard in Excel?
A Refinery Tender Dashboard in Excel transforms complex tender data into clear, actionable insights. It centralizes information, improves transparency, and supports smarter decisions.
Moreover, it eliminates manual reporting, reduces errors, and saves valuable time. Since it works entirely in Excel, it remains cost-effective and easy to use.
If your refinery manages multiple tenders and aims to improve profitability and control, this dashboard becomes an essential tool.
Frequently Asked Questions (FAQs)
What is a Refinery Tender Dashboard in Excel?
A Refinery Tender Dashboard in Excel is an interactive Excel-based tool that tracks and analyzes refinery tender data using charts, KPIs, and filters.
Who should use a Refinery Tender Dashboard?
Procurement managers, finance teams, commercial teams, and refinery leadership can benefit from this dashboard.
Does this dashboard require advanced Excel skills?
No, basic Excel knowledge is sufficient to use and update the dashboard.
Can I customize the dashboard as per my refinery needs?
Yes, you can customize KPIs, charts, filters, and layouts easily.
How often should tender data be updated?
You should update data regularly, preferably weekly or monthly, to ensure accurate analysis.
Is this dashboard suitable for management reporting?
Yes, the dashboard is designed to deliver management-ready insights with minimal effort.
Visit our YouTube channel to learn step-by-step video tutorials