In today’s competitive food industry, restaurants and food service businesses must rely on data to survive and grow. Every order, every customer rating, every cost, and every sale tells a story. However, raw data alone does not help decision-making. You must convert that data into clear, visual, and actionable insights.
That is exactly where a Restaurants and Food Services Dashboard in Excel becomes essential.
In this detailed and easy-to-follow guide, you will learn what a Restaurants and Food Services Dashboard in Excel is, why it matters, how it works, its page-wise structure, advantages, best practices, and frequently asked questions. Moreover, this article uses simple language, real-world logic, and practical explanations so you can apply everything immediately.
Click to Purchases Restaurants and Food Services Dashboard in Excel
What Is a Restaurants and Food Services Dashboard in Excel?
A Restaurants and Food Services Dashboard in Excel is a ready-to-use, interactive reporting and analytics tool designed to track restaurant performance in one centralized Excel file.
Instead of managing sales reports, cost sheets, and customer feedback in multiple files, this dashboard consolidates everything into visual charts, KPI cards, and filters. As a result, restaurant owners and managers can monitor performance instantly without complex formulas or external software.
Moreover, Excel makes the dashboard flexible, affordable, and easy to customize, even for non-technical users.
Why Do Restaurants and Food Services Need a Dashboard in Excel?
Restaurants face daily operational challenges. For example, managers must track sales, control food costs, maintain profit margins, and monitor customer satisfaction at the same time. However, manual reporting wastes time and increases errors.
That is why a Restaurants and Food Services Dashboard in Excel becomes a powerful solution.
Key Reasons Restaurants Need This Dashboard
-
Centralized performance tracking across restaurants, cities, and food categories
-
Quick visibility into profit, cost, and sales trends
-
Better decision-making using real-time insights
-
Improved cost control by identifying high-cost items
-
Higher customer satisfaction through rating analysis
Therefore, instead of reacting late, restaurants can take action early and stay competitive.
What Makes an Excel-Based Dashboard Ideal for Restaurants?
Although many BI tools exist, Excel remains one of the most practical choices for restaurants.
Here is why:
-
Excel is widely available and familiar
-
No expensive licenses are required
-
Dashboards update automatically with new data
-
Users can easily customize charts and filters
-
Data entry remains simple and structured
As a result, restaurant teams can focus on insights rather than tools.
Overview of the Restaurants and Food Services Dashboard in Excel
This Restaurants and Food Services Dashboard in Excel is a ready-to-use solution designed specifically for restaurant analytics.
Key Highlights of the Dashboard
-
Page Navigator on the left side for easy movement between pages
-
Right-side slicers for quick filtering
-
Five analytical pages covering different business views
-
Support and Data sheets to manage backend operations
Now, let us explore each dashboard page in detail.
How Does the Page Navigator Improve Dashboard Usability?
The Page Navigator, located on the left side, allows users to switch between dashboard pages with a single click.
Instead of scrolling or searching through sheet tabs, users can jump directly to:
-
Overview
-
Restaurant Analysis
-
Food Category Analysis
-
City Analysis
-
Month Analysis
As a result, navigation becomes faster, cleaner, and more professional.
Overview Page: How Can You See Business Performance at a Glance?
Click to Purchases Restaurants and Food Services Dashboard in Excel
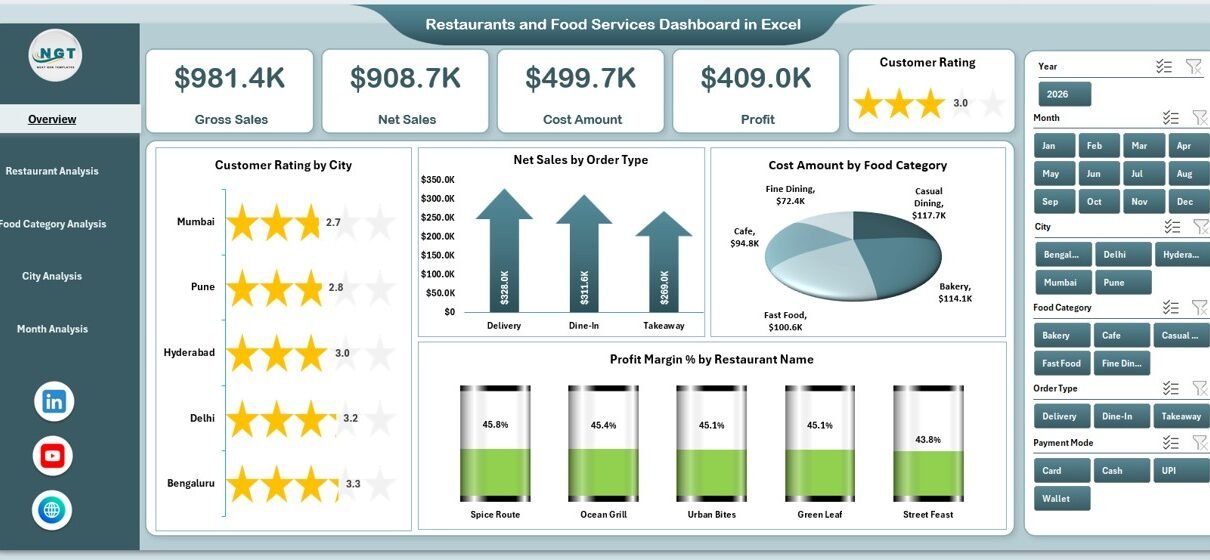
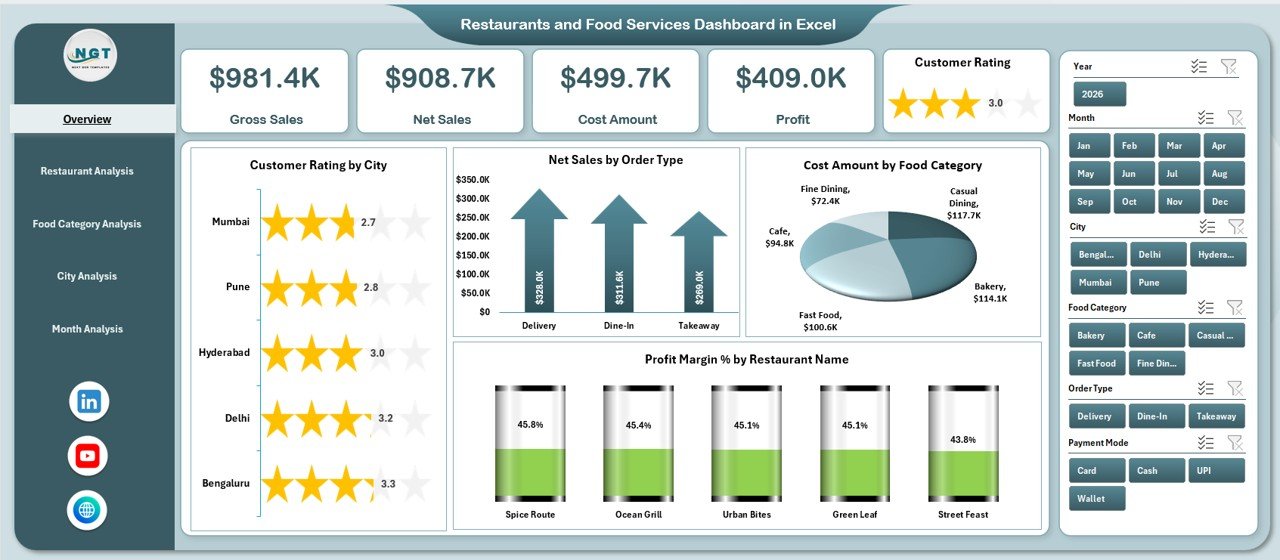
The Overview Page acts as the main control center of the dashboard.
What Makes the Overview Page Important?
This page summarizes overall business health using cards and charts, making it ideal for owners and senior managers.
Key Elements of the Overview Page
KPI Cards
The dashboard displays four KPI cards, which provide instant performance indicators.
Analytical Charts on the Overview Page
-
Customer Rating by City
Helps identify which cities deliver better customer experiences. -
Net Sales by Order Type
Shows how dine-in, takeaway, or online orders perform. -
Cost Amount by Food Category
Highlights where most costs occur. -
Profit Margin % by Restaurant Name
Reveals which restaurants generate higher margins.
Together, these visuals create a complete performance snapshot within seconds.
Restaurant Analysis Page: How Do Individual Restaurants Perform?
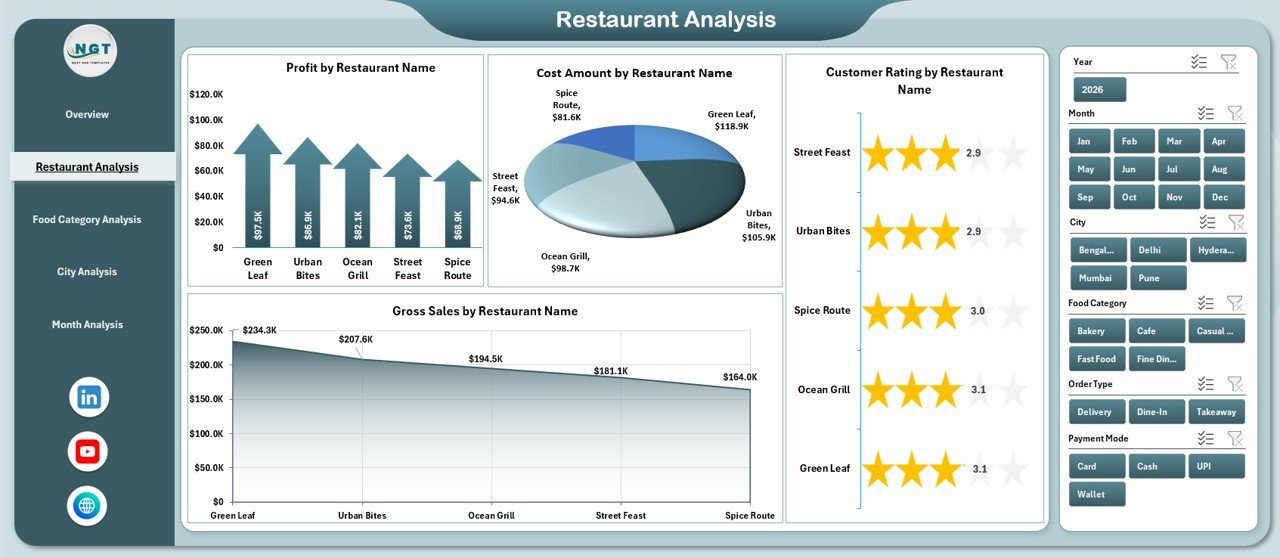
The Restaurant Analysis Page focuses on restaurant-level insights.
Why Is Restaurant-Level Analysis Important?
Each restaurant performs differently. Therefore, managers must identify:
-
Top-performing outlets
-
High-cost restaurants
-
Restaurants with low ratings
Charts on the Restaurant Analysis Page
-
Profit by Restaurant Name
Shows which restaurants contribute most to profits. -
Cost Amount by Restaurant Name
Identifies cost-heavy locations. -
Customer Rating by Restaurant Name
Highlights service quality differences. -
Gross Sales by Restaurant Name
Displays revenue generation per outlet.
With right-side slicers, users can filter data quickly and compare performance efficiently.
Food Category Analysis Page: Which Menu Items Drive Growth?
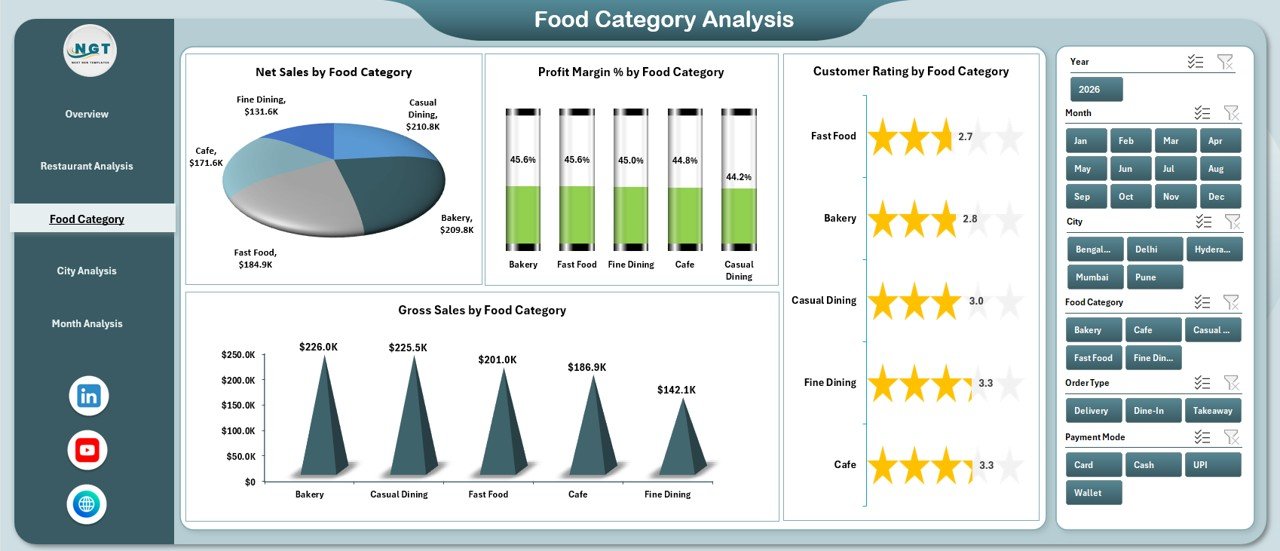
The Food Category Analysis Page analyzes performance by food category.
Why Is Food Category Analysis Crucial?
Menu decisions directly affect profits. Therefore, restaurants must understand:
Click to Purchases Restaurants and Food Services Dashboard in Excel
-
High-margin food items
-
High-cost categories
-
Customer preferences
Charts Included in Food Category Analysis
-
Net Sales by Food Category
Shows which categories generate more revenue. -
Profit Margin % by Food Category
Helps identify profitable menu items. -
Customer Rating by Food Category
Reveals customer preferences. -
Gross Sales by Food Category
Highlights volume-driven categories.
As a result, menu optimization becomes data-driven rather than guess-based.
City Analysis Page: How Do Different Locations Perform?
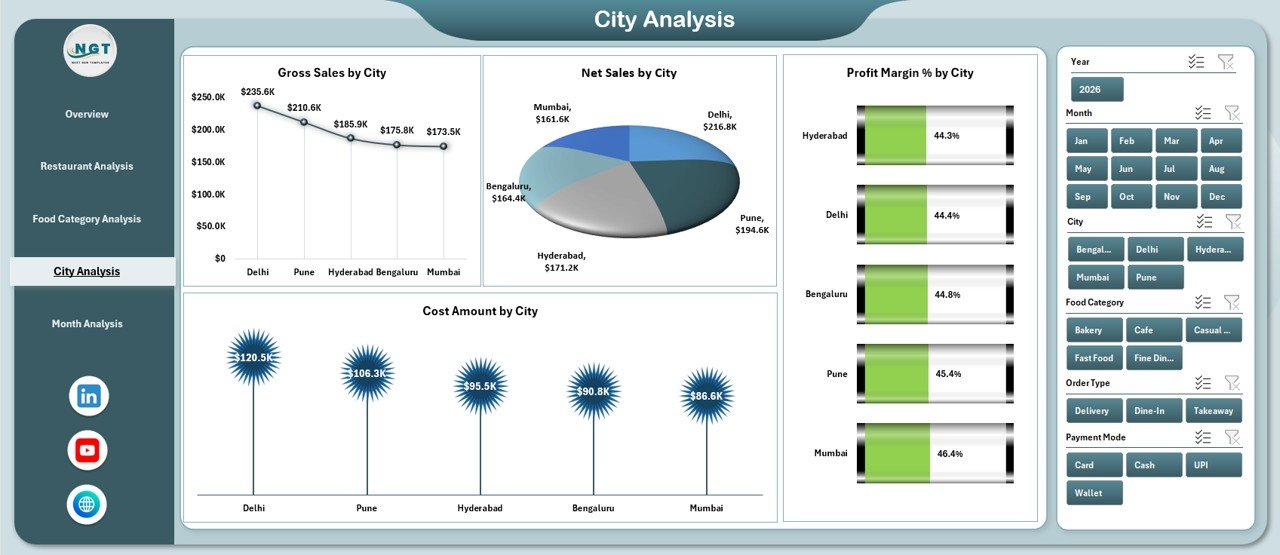
The City Analysis Page focuses on geographical performance.
Why Is City-Level Analysis Useful?
Different cities show different customer behaviors, pricing patterns, and cost structures.
Charts on the City Analysis Page
-
Gross Sales by City
Identifies top-performing cities. -
Net Sales by City
Shows revenue after deductions. -
Profit Margin % by City
Reveals location-based profitability. -
Cost Amount by City
Highlights operational expenses per city.
With this insight, businesses can expand strategically and optimize pricing.
Month Analysis Page: How Do Trends Change Over Time?
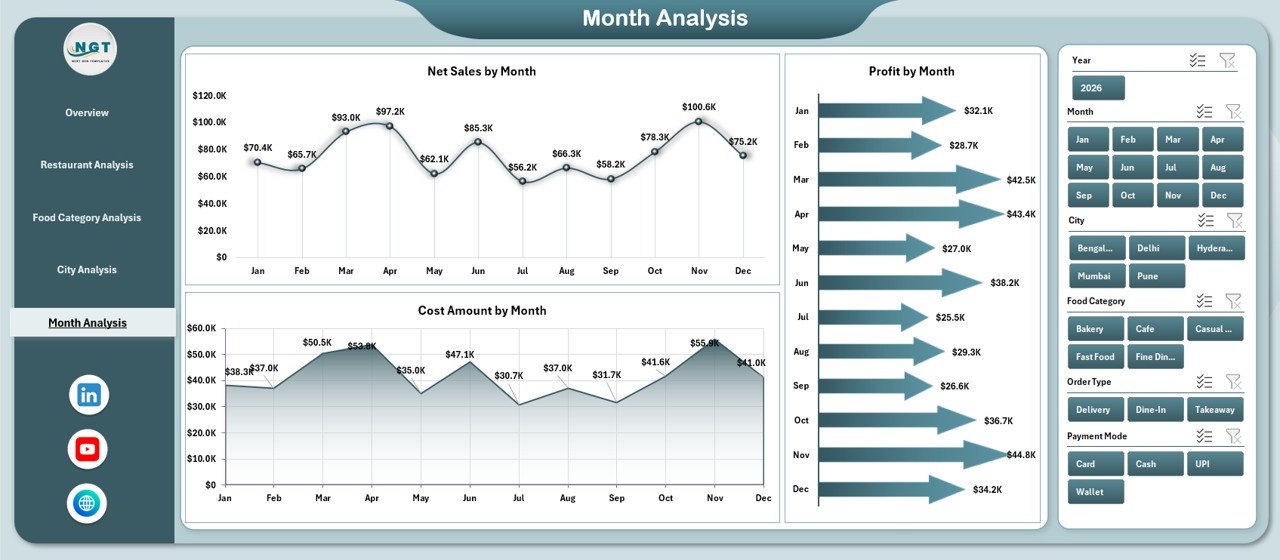
The Month Analysis Page tracks time-based performance.
Why Does Monthly Analysis Matter?
Trends reveal seasonality, demand cycles, and growth patterns.
Charts Included in Month Analysis
-
Net Sales by Month
Shows monthly revenue trends. -
Profit by Month
Highlights profitable periods. -
Cost Amount by Month
Identifies cost fluctuations.
Therefore, planning promotions and controlling costs becomes easier.
What Role Do Support and Data Sheets Play?
Click to Purchases Restaurants and Food Services Dashboard in Excel
Behind every powerful dashboard lies structured data.
Support Sheet
-
Stores helper calculations
-
Maintains lookup tables
-
Supports slicers and filters
Data Sheet
-
Contains raw transactional data
-
Updates dashboard automatically
-
Ensures accuracy and consistency
Together, these sheets ensure smooth dashboard performance.
Advantages of Restaurants and Food Services Dashboard in Excel
Using this dashboard offers several business benefits.
Key Advantages
-
✅ Centralized restaurant performance tracking
-
✅ Real-time sales, cost, and profit insights
-
✅ Easy comparison across restaurants, cities, and categories
-
✅ Improved decision-making speed
-
✅ Reduced manual reporting effort
-
✅ Better cost control and profit optimization
As a result, restaurants gain clarity, control, and confidence.
Who Can Use This Restaurants and Food Services Dashboard in Excel?
This dashboard suits a wide range of users.
Ideal Users
-
Restaurant owners
-
Food chain managers
-
Franchise operators
-
Finance and operations teams
-
Business analysts
-
Consultants
Since Excel remains user-friendly, even non-technical users can operate it easily.
How Does This Dashboard Improve Decision-Making?
Data-driven decisions reduce risks.
This dashboard helps decision-making by:
-
Highlighting underperforming restaurants
-
Identifying high-cost food categories
-
Tracking customer satisfaction trends
-
Monitoring monthly performance changes
Therefore, managers can act quickly and strategically.
Best Practices for the Restaurants and Food Services Dashboard in Excel
To get the best results, follow these proven best practices.
1. Maintain Clean and Accurate Data
Always validate data entries. Clean data ensures reliable insights.
2. Update Data Regularly
Frequent updates keep insights current and actionable.
3. Use Slicers Smartly
Slicers allow quick comparisons. Therefore, apply them consistently.
4. Focus on Key Metrics
Avoid clutter. Track only meaningful KPIs that drive decisions.
5. Review Trends Monthly
Monthly trend analysis helps detect issues early.
6. Customize Based on Business Needs
Excel allows customization. Adapt charts and KPIs as required.
Common Challenges and How to Overcome Them
Click to Purchases Restaurants and Food Services Dashboard in Excel
Even the best dashboards face challenges.
Common Challenges
-
Inconsistent data entry
-
Missing values
-
Overloaded visuals
Solutions
-
Use standardized templates
-
Apply data validation
-
Limit visuals to essential insights
By following best practices, these challenges become manageable.
Conclusion: Why Should You Use a Restaurants and Food Services Dashboard in Excel?
A Restaurants and Food Services Dashboard in Excel transforms raw restaurant data into clear, actionable insights. It simplifies reporting, improves visibility, and supports smarter decisions.
Moreover, its ready-to-use structure, interactive slicers, and visual clarity make it ideal for modern restaurant management. Instead of guessing, you manage with confidence and clarity.
Frequently Asked Questions (FAQs)
What is a Restaurants and Food Services Dashboard in Excel?
It is an interactive Excel-based tool that tracks restaurant sales, costs, profits, and customer ratings in one file.
Can beginners use this dashboard?
Yes. The dashboard uses simple Excel features and intuitive navigation.
How often should I update the data?
You should update data daily or weekly for accurate insights.
Can I customize the dashboard?
Yes. Excel allows full customization of charts, KPIs, and filters.
Does this dashboard support multiple restaurants?
Yes. It supports analysis across multiple restaurants, cities, and food categories.
Is Excel better than other BI tools for restaurants?
Excel offers affordability, flexibility, and ease of use, making it ideal for many restaurant businesses.
Visit our YouTube channel to learn step-by-step video tutorials