In today’s fast-paced retail and e-commerce landscape, staying ahead of the competition demands constant vigilance over key performance indicators (KPIs). With sales channels multiplying and customer expectations rising, you need a centralized tool that delivers real-time insights and drives data-backed decisions. Therefore, we built the Retail and E-commerce Operations KPI Dashboard in Excel—a ready-to-use template that empowers you to monitor, analyze, and optimize every critical metric from one intuitive workbook.
In the sections that follow, you’ll discover:
Click to Purchases Retail and E-commerce Operations KPI Dashboard in Excel
-
Why KPI dashboards matter in retail and e-commerce
-
An overview of our seven-sheet Excel template
-
Detailed walkthroughs of each worksheet
-
Advantages of deploying this dashboard
-
Best practices for maximizing its impact
-
Frequently Asked Questions to address common queries
Throughout this article, you’ll find clear explanations, bullet-point breakdowns, and actionable tips. Consequently, you can implement the dashboard in minutes and start unlocking insights today.
Why KPI Dashboards Matter in Retail and E-commerce
First and foremost, retail and e-commerce thrive on numbers—whether you track conversion rates, average order value, or inventory turnover. As your business grows, data volumes explode, making manual analysis both tedious and error-prone. Meanwhile, external factors—such as seasonal demand, supply-chain disruptions, or marketing campaigns—can skew performance, so you need to spot deviations fast.
-
Focus on what matters. Dashboards condense dozens of metrics into digestible visuals, so you avoid information overload.
-
Accelerate decision cycles. When you spot underperforming SKUs or channels at a glance, you react swiftly.
-
Align teams. Everyone from marketing to operations sees the same numbers, fostering accountability and collaboration.
In addition, a well-built dashboard helps you shift from reactive firefighting to proactive strategy. Rather than scrambling when KPIs dip, you anticipate trends and optimize before issues escalate. Therefore, this Retail and E-commerce Operations KPI Dashboard becomes your command center—streamlining reporting, reducing manual work, and unlocking competitive advantage.
Overview of the Retail and E-commerce Operations KPI Dashboard
At its core, the template features seven worksheets, each serving a specific purpose:
-
Home sheet: Navigation hub with buttons to jump to any section.
-
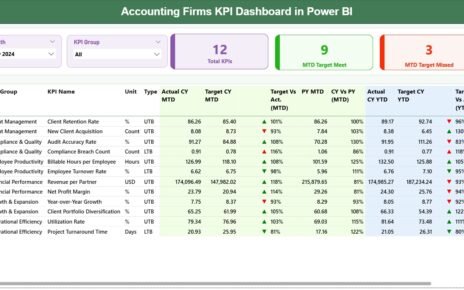
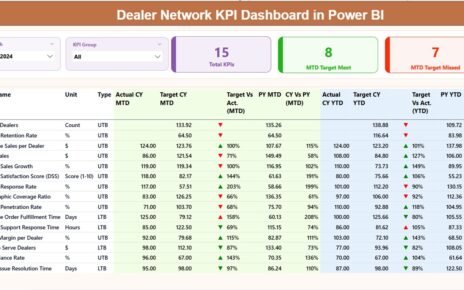
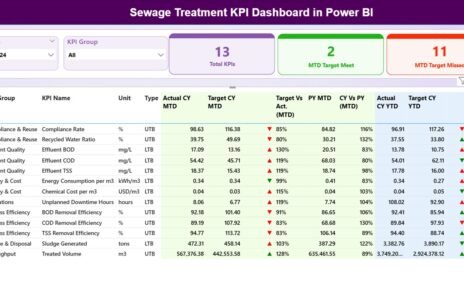
Dashboard sheet tab: High-level summary with MTD, YTD, and previous-year comparisons.
-
KPI Trend sheet tab: Interactive trend charts showing Actual vs. Target vs. PY for any KPI.
-
Actual Numbers Input sheet: Data entry for current-year MTD and YTD figures.
-
Target sheet tab: Input for monthly targets, both MTD and YTD.
-
Previous Year Number sheet tab: Entry for last year’s corresponding numbers.
-
KPI Definition sheet tab: Master list of KPI names, groups, units, formulas, and definitions.
By separating inputs (Actual, Target, Previous Year) from outputs (Dashboard, Trends), you reduce errors and ensure clarity. Furthermore, conditional formatting and drop-downs enhance usability, so anyone—including non-technical team members—can update and interpret the dashboard effortlessly.
Detailed Worksheet Walkthrough
Home Sheet

-
Purpose: Acts as an index page.
Features:
- Six navigation buttons (e.g., Dashboard, Trends, Inputs).
- Clear instructions on where to click for each section.
- Consistent branding area (logo, title).
Dashboard Sheet Tab

-
Purpose: Provides a consolidated view of all KPIs for the selected month.
Key Elements:
- Month Selector (D3): Pick any month via drop-down; the entire dashboard updates automatically.
- MTD and YTD Sections:
- Actual, Target, Previous Year values side by side.
- Variance formulas calculate Target vs. Actual and PY vs. Actual.
- Conditional Formatting: Up/down arrows highlight performance above or below expectations.
Visuals:
- Data cards for high-priority KPIs (e.g., Sales Revenue, Conversion Rate).
- Sparkline charts summarizing month-over-month trends.
Click to Purchases Retail and E-commerce Operations KPI Dashboard in Excel
KPI Trend Sheet Tab

-
Purpose: Delve deeper into the historical performance of any chosen KPI.
Features:
- KPI Selector (C3): Select from the full list of KPIs defined on the Definition sheet.
- KPI Metadata Display: Shows Group, Unit, Type (Upper the Better or Lower the Better), Formula, Definition.
Trend Charts:
- MTD Trend: Compares Actual, Target, and Previous Year for each month of the year.
- YTD Trend: Aggregates values from January up to the selected month, enabling cumulative analysis.
Actual Numbers Input Sheet

-
Purpose: Centralized area to enter your current-year numbers.
How It Works:
- Month Input (E1): Define the first month of your fiscal year (e.g., April).
- Data Table: Enter each KPI’s MTD and YTD figures for every month.
- Validation: Drop-down lists on KPI names prevent typos and ensure consistency.
Target Sheet Tab

-
Purpose: Maintain your monthly goals for each KPI.
Structure:
- Identical layout to the Actual Numbers sheet, with columns for MTD and YTD targets.
- Flexibility to adjust targets mid-year if market conditions change.
Click to Purchases Retail and E-commerce Operations KPI Dashboard in Excel
Previous Year Number Sheet Tab

-
Purpose: Store prior-year performance data for year-over-year comparisons.
Features:
- Match the same layout as the Actual and Target sheets.
- Populate with historical figures at the beginning of the year or import from legacy systems.
KPI Definition Sheet Tab

-
Purpose: Document each KPI’s name, group, unit, formula, and definition.
Columns:
- KPI Name (e.g., Average Order Value)
- KPI Group (e.g., Sales, Customer Service)
- Unit (e.g., USD, %)
- Formula (brief, e.g.,
Total Sales / Number of Orders) - Definition (concise explanation of what the KPI measures)
- Type (Upper the Better or Lower the Better)
Advantages of the Retail and E-commerce Operations KPI Dashboard
Implementing this dashboard unlocks several benefits:
-
Rapid Insights. Immediately spot underperforming KPIs with conditional formatting and variance arrows.
-
Unified Data Source. Centralize actuals, targets, and historic data in one workbook, eliminating fragmentation.
-
Scalability. Add new KPIs or modify existing ones without redesigning the dashboard.
-
User-Friendly. Drop-down selectors and pre-built templates reduce training time.
-
Cost-Effective. Leverage Excel—familiar software—without investing in expensive BI tools.
-
Action-Driven Visuals. Charts and sparklines highlight trends, enabling quick, confident decision-making.
Best Practices for Your Retail and E-commerce KPI Dashboard
To get the most from your dashboard, follow these guidelines:
Define Clear Objectives.
Identify which KPIs directly influence your bottom line.
Prioritize high-impact metrics such as Conversion Rate, Cart Abandonment Rate, and Inventory Turnover.
Keep Data Clean and Consistent.
Use data validation to prevent entry errors.
Standardize date formats and naming conventions.
Review and Update Regularly.
Schedule weekly or monthly touchpoints to refresh actuals and adjust targets.
Archive prior-year data in a separate workbook if your file grows too large.
Leverage Conditional Formatting Wisely.
Highlight only critical variances to avoid “formatting fatigue.”
Use simple up/down arrows or traffic-light color schemes.
Train Stakeholders.
Conduct brief demos for team members who input data or interpret results.
Document any custom formulas or workflows on a “Read Me” tab.
Scale Gradually.
Start with core KPIs, then expand to secondary metrics over time.
Avoid overwhelming users with too many charts at once.
Conclusion
In an era where data drives success, the Retail and E-commerce Operations KPI Dashboard in Excel stands out as a powerful yet approachable solution. By merging actuals, targets, and prior-year benchmarks into a single, interactive workbook, you gain a 360° view of your business performance. Meanwhile, the seven-sheet architecture balances depth and simplicity—enabling you to drill into trends or view high-level summaries in an instant.
Furthermore, this dashboard empowers you to:
-
Hit sales and margin targets consistently
-
Optimize inventory levels and fulfillment efficiency
-
Improve customer experience via data-driven insights
-
Align cross-functional teams around shared goals
Frequently Asked Questions
1. What version of Excel do I need to use this dashboard?
You can use Excel 2016 or later on Windows and Mac. For full functionality (e.g., slicers, conditional formatting), we recommend Excel 2019 or Office 365.
2. How do I add a new KPI to the dashboard?
Go to the KPI Definition sheet, append your KPI details at the bottom, and then update the drop-down ranges on the Dashboard and KPI Trend sheets. Excel will auto-include your new metric.
3. Can I customize the target values mid-year?
Absolutely. Simply update the Target sheet’s MTD and YTD columns for the relevant months. The dashboard will recalculate variances instantly.
4. How do I reset the dashboard for a new fiscal year?
-
Archive the current file.
-
Open a fresh copy of the template.
-
Enter last year’s actuals into the Previous Year Number sheet.
-
Clear the Actual Numbers Input and Target sheets before re-entering new figures.
5. How can I share this dashboard with other team members?
Store the file on a shared drive (OneDrive, SharePoint) or use Excel’s “Share” feature in Office 365. Be sure to manage editing permissions to prevent accidental overwrites.
6. What if I work with weekly rather than monthly data?
You can adapt the structure by changing date inputs to weeks (e.g., Week 1, Week 2) and adjusting your formulas. However, you may need to tweak the trend charts accordingly.
7. Is it possible to connect this template to external data sources?
While the template relies on manual inputs, you can link it to Power Query or external databases if you have advanced Excel skills. That said, manual entry often suffices for small to mid-sized operations.
Visit our YouTube channel to learn step-by-step video tutorials
Click to Purchases Retail and E-commerce Operations KPI Dashboard in Excel
Watch the step-by-step video tutorial: