The ride-hailing industry grows every month. People book taxis, auto-rickshaws, motorbikes, and shared rides using mobile apps. As the business expands, leaders look for insights that show trip trends, fares, discounts, and monthly performance. However, many teams still depend on multiple Excel files and scattered reports. This slows down decision-making and hides real performance issues.
A Ride-Hailing & Mobility Apps Dashboard in Excel solves this challenge. It brings all trip data, customer types, promo usage, and vehicle performance into one clean visualization. You view everything in one place without switching between files. The dashboard updates instantly when you refresh your data.
In this guide, you will learn what this dashboard includes, how each page works, and why it helps mobility businesses track performance with clarity.
Click to Purchases Ride-Hailing & Mobility Apps Dashboard in Excel
What Is a Ride-Hailing & Mobility Apps Dashboard in Excel?
A Ride-Hailing & Mobility Apps Dashboard in Excel is a ready-to-use reporting template designed for taxi services, mobility apps, bike taxi operators, auto-rickshaw fleets, shuttle services, and ride-sharing platforms. It gives a structured view of gross fare, net fare, ongoing trip percentage, customer types, promo usage, and month-wise trends.
The dashboard uses slicers, cards, and visual charts to present real-time insights. You analyze trip details across many dimensions such as:
-
Vehicle type
-
Ride type
-
Promo type
-
City
-
Month
-
Customer category
Because of this, fleet managers, operations teams, marketing departments, and finance teams get instant clarity on business performance.
Why Do Ride-Hailing Companies Need a Dashboard in Excel?
Ride-hailing companies experience dynamic demand, frequent price changes, and multiple ride categories. Without visuals, the data becomes difficult to understand. Teams need accurate numbers to make daily decisions, evaluate promo offers, and adjust pricing.
This dashboard solves these problems because it:
-
Summarizes large datasets into simple visual charts
-
Tracks trends instantly
-
Helps decision-makers compare performance across categories
-
Shows which rides earn more revenue
-
Highlights which cities need more focus
-
Reveals promo effectiveness
-
Easily updates with new data
The dashboard requires no coding. You simply paste your updated dataset into the Data Sheet, and all charts refresh automatically.
Key Features of the Ride-Hailing & Mobility Apps Dashboard in Excel
This dashboard includes powerful features that help teams track performance without manual work.
✔ Page Navigator
Located on the left side, the Page Navigator helps you switch between all analytical pages with a single click. You get quick access to:
-
Overview Page
-
Vehicle Analysis
-
Ride Analysis
-
Promo Analysis
-
Month Analysis
Each page opens instantly without scrolling or searching.
How Does the Dashboard Work? A Page-by-Page Guide
The template includes five analytical pages, each designed to answer a specific business question.
1. Overview Page
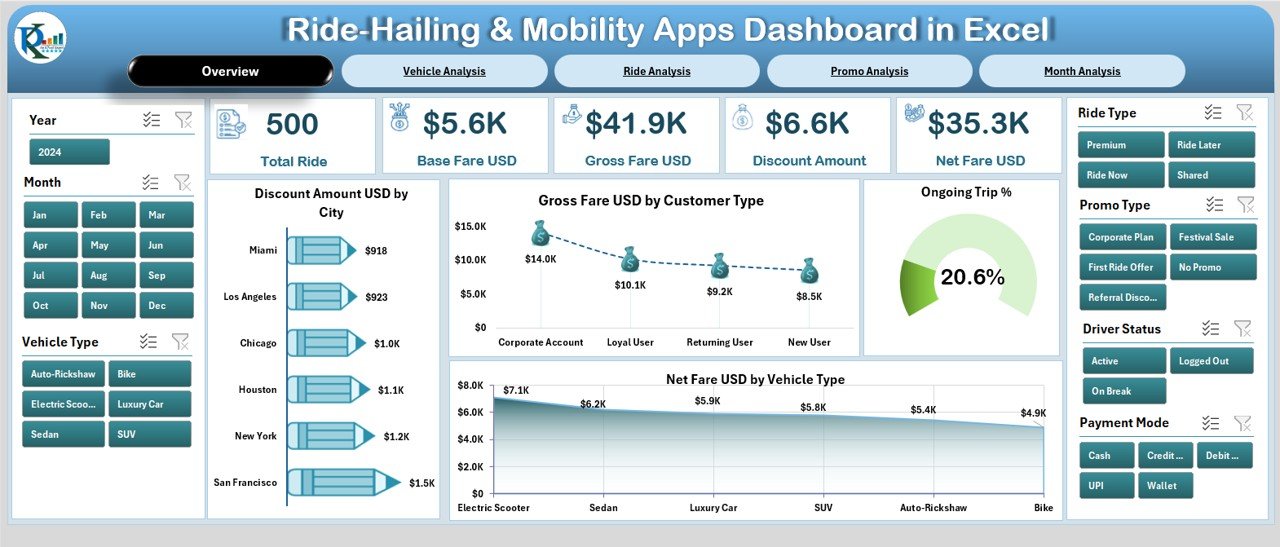
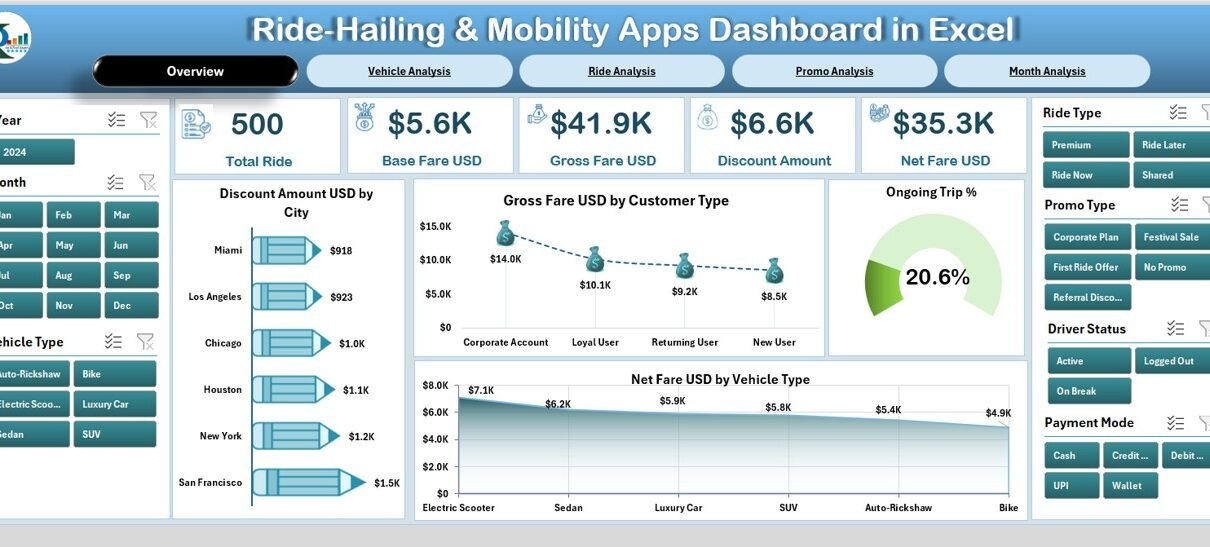
The Overview Page acts as the main landing page. You see all important KPIs in one place so decision-makers can quickly understand performance.
✔ KPI Cards
You view five KPI cards, such as:
-
Total Gross Fare
-
Total Net Fare
-
Total Discount Amount
-
Trip Count
-
Ongoing Trip Percentage
These cards give a quick snapshot of business health.
✔ Visual Charts on the Right-Side Silencer
The Overview Page includes four dynamic charts:
-
Discount Amount (USD) by City → Helps identify locations with high promotional expenses.
-
Gross Fare (USD) by Customer Type → Shows which audience generates more revenue.
-
Ongoing Trip % → Indicates live trip activity and operational load.
-
Net Fare (USD) by Vehicle Type → Reveals which vehicle categories earn more profit after discount.
This page gives a complete performance summary at a glance.
Click to Purchases Ride-Hailing & Mobility Apps Dashboard in Excel
2. Vehicle Analysis Page
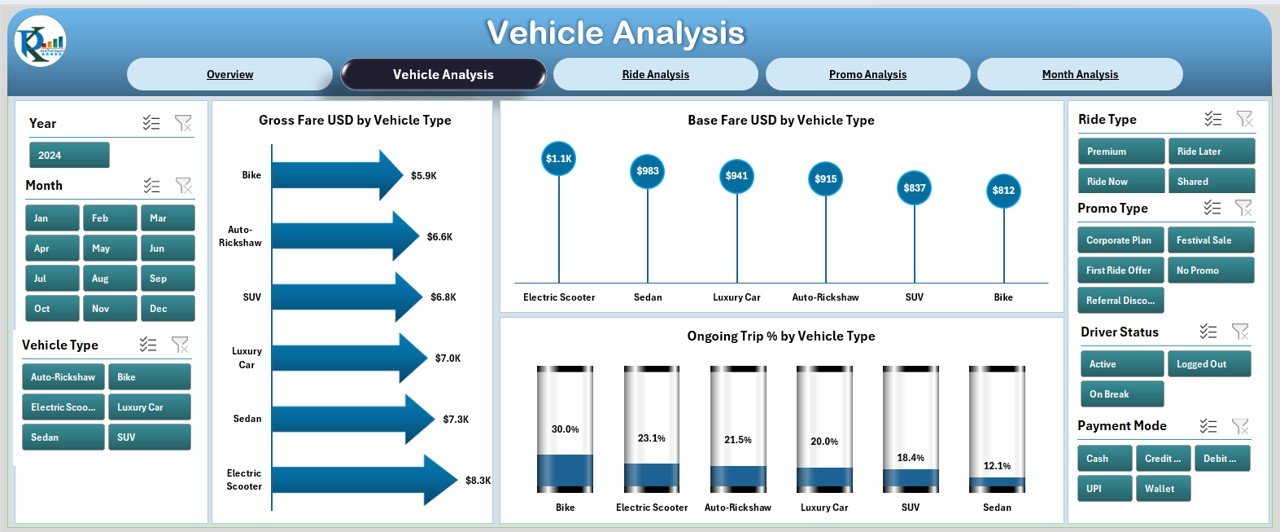
This page focuses on vehicle-level insights. It helps you understand how each vehicle type performs.
✔ KPI Cards on the Right-Side Silencer
The visual layout helps compare multiple vehicle categories quickly.
✔ Three Detailed Charts
-
Gross Fare (USD) by Vehicle Type
-
Base Fare (USD) by Vehicle Type
-
Ongoing Trip % by Vehicle Type
These visuals help fleet managers decide which vehicle type needs:
-
Pricing adjustments
-
More supply
-
Fewer promotions
-
Better driver distribution
Because of this, you can optimize both revenue and vehicle availability.
3. Ride Analysis Page
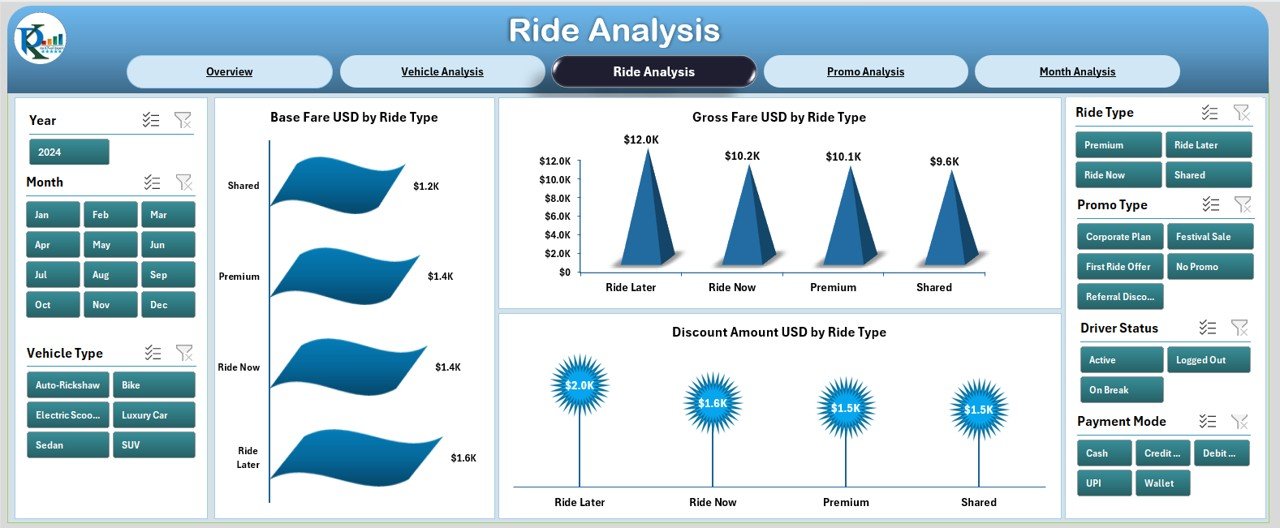
Every mobility app offers different ride types such as mini, sedan, SUV, auto, motorbike, and shared rides. This page focuses on the performance of each ride category.
✔ Charts on the Right-Side Silencer
You get three powerful charts:
-
Gross Fare (USD) by Ride Type
-
Base Fare (USD) by Ride Type
-
Discount Amount (USD) by Ride Type
These insights help leaders track:
-
Which ride categories perform well
-
Which rides need price changes
-
Which ride types consume heavy discounts
-
How customer demand changes across ride options
This page also helps marketing teams design more effective ride-specific promotions.
4. Promo Analysis Page
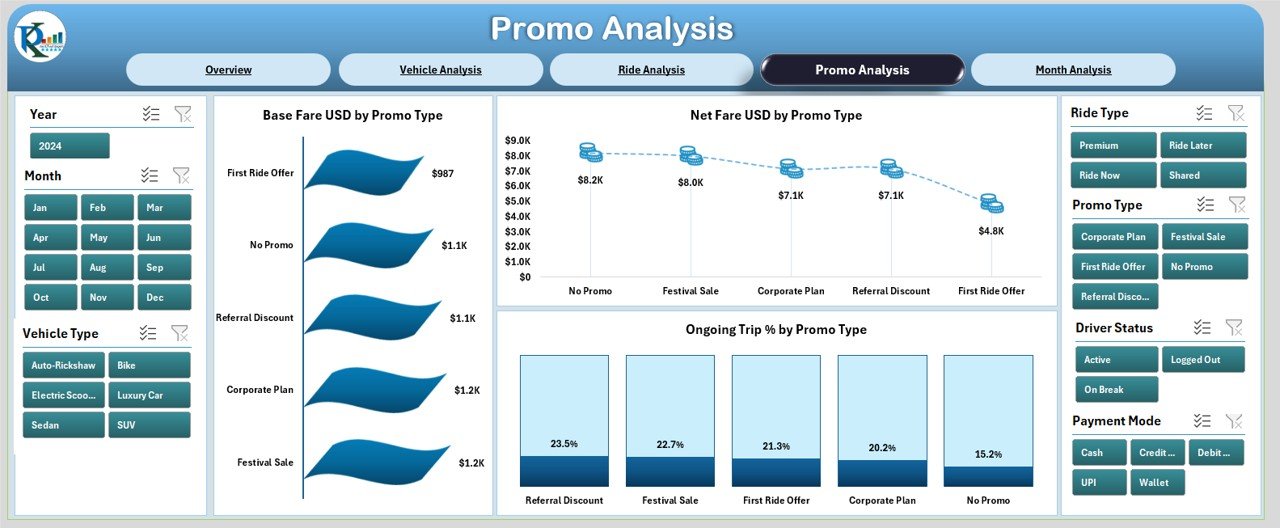
Promo codes attract new customers and increase loyalty. However, they also reduce revenue if used excessively. This page gives clear visibility into promo performance.
Three Promo-Specific Charts
-
Gross Fare (USD) by Promo Type
-
Net Fare (USD) by Promo Type
-
Ongoing Trip % by Promo Type
These visuals help you understand:
-
Which promo codes generate high revenue
-
Which promo types reduce net fare significantly
-
How promotions influence active trips
-
Whether certain promo codes need removal or revision
This page is extremely helpful for finance, marketing, and pricing teams.
5. Month Analysis Page
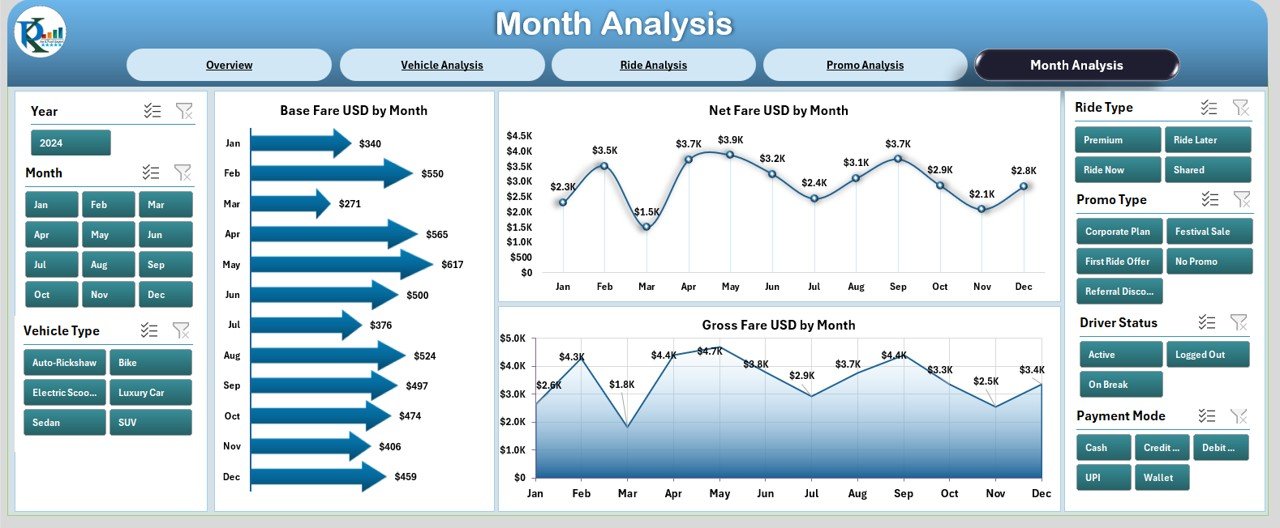
Month-wise analysis is essential because ride-hailing demand always changes during festivals, events, holidays, and peak seasons.
Three Month-Level Charts on the Right-Side Silencer
-
Gross Fare (USD) by Month
-
Net Fare (USD) by Month
-
Base Fare (USD) by Month
This page helps companies:
-
Track seasonal trends
-
Identify peak revenue months
-
Compare monthly promo effects
-
Understand fare fluctuations
Teams use this page to forecast demand, set targets, and plan seasonal marketing campaigns.
Support Sheets in the Dashboard
The dashboard includes backend sheets to store and process data.
✔ Data Sheet
The Data Sheet contains all raw records of trips including:
-
Trip Date
-
Vehicle Type
-
Ride Type
-
Promo Type
-
City
-
Gross Fare
-
Net Fare
-
Discount Amount
-
Base Fare
-
Trip Status
You simply paste your updated data here. The dashboard updates automatically without any manual work.
Advantages of Ride-Hailing & Mobility Apps Dashboard in Excel
A dedicated dashboard brings many benefits to mobility businesses. Below are the major advantages.
1. Quick and Clear Visual Reporting
The dashboard converts messy tables into clean charts. Decision-makers get clarity within seconds.
2. Faster Decision-Making
Teams use instant insights to adjust pricing, promotions, vehicle supply, and customer strategies.
3. Easy to Customize
Excel allows complete freedom. You can change colors, add metrics, insert slicers, or modify formulas easily.
4. Better Understanding of Customer Behavior
The dashboard shows which customer types pay more and which use heavy discounts.
5. Smarter Promo Strategy
Promo usage analysis helps reduce unnecessary spending and improve net fare.
6. Operational Efficiency
Fleet managers allocate vehicles based on demand patterns.
7. No Technical Training Required
Anyone with basic Excel knowledge can use the dashboard.
Best Practices for Using the Ride-Hailing & Mobility Apps Dashboard
To get the best results from this dashboard, follow these practices:
1. Refresh Data Regularly
Update the Data Sheet weekly or monthly to ensure accurate reports.
2. Maintain Clean Data
Remove errors, duplicates, or mismatched categories before pasting into the Data Sheet.
3. Use Consistent Naming
Keep city names, vehicle types, and promo codes uniform.
4. Analyze Promo Impact Carefully
Look at both gross fare and net fare before launching new offers.
5. Compare Vehicle Types Frequently
Different vehicle categories show different revenue patterns. Compare them regularly.
6. Review Trend Lines Every Month
Trend charts help forecast demand and pricing strategies.
7. Back Up Your Data Sheet
Keep a backup file to avoid data loss.
Conclusion
Ride-hailing businesses generate huge amounts of data every day. If the data remains in raw tables, leaders struggle to understand performance. However, a Ride-Hailing & Mobility Apps Dashboard in Excel gives a complete, visual, and structured view of the business. You track gross fare, net fare, discounts, promo codes, vehicle performance, and monthly trends in a single file.
The dashboard improves decision-making, supports marketing strategies, and brings clarity to operations. Because of this, every mobility app, taxi fleet, bike taxi service, and ride-sharing platform should use a ready-made Excel dashboard to manage their performance effortlessly.
Click to Purchases Ride-Hailing & Mobility Apps Dashboard in Excel
Frequently Asked Questions (FAQs)
1. What is a Ride-Hailing Dashboard in Excel?
It is a ready-to-use Excel file that shows key metrics such as gross fare, net fare, discount amount, trip count, vehicle performance, and promo usage using visual charts.
2. Who should use this dashboard?
Taxi operators, mobility app teams, bike taxi services, ride-sharing companies, fleet managers, marketing teams, and finance departments should use this dashboard.
3. Do I need advanced Excel knowledge to use it?
No. You only paste your data into the Data Sheet. The dashboard updates automatically.
4. Can I customize the metrics and charts?
Yes. You can change visuals, colors, slicers, and formulas based on your business needs.
5. Does the dashboard support monthly trend analysis?
Yes. The Month Analysis page shows gross fare, net fare, and base fare for each month.
6. Can I track promo code effectiveness?
Yes. The Promo Analysis page shows revenue and ongoing trip percentage by promo type.
7. How often should I update the dashboard?
Update it weekly or monthly, depending on your trip volume.
Visit our YouTube channel to learn step-by-step video tutorials