In today’s fast-moving e-commerce world, online store owners must make quick and accurate decisions. However, when sales data stays scattered across invoices, order files, and raw spreadsheets, tracking performance becomes difficult. As a result, businesses miss trends, lose profit opportunities, and struggle to scale.
That is exactly why a Sales Dashboard for Online Store in Excel becomes an essential tool. It brings all critical sales metrics into one clear, visual, and easy-to-use dashboard. Moreover, it helps business owners, analysts, and managers understand what is working and what needs improvement—without using complex software.
In this detailed guide, you will learn what a Sales Dashboard for an Online Store in Excel is, how it works, why it matters, and how each dashboard section supports data-driven decisions. Additionally, you will explore its advantages, best practices, and frequently asked questions. By the end, you will clearly understand how this dashboard can transform your online sales reporting.
Click to buy Sales Dashboard For online Store in Excel
What Is a Sales Dashboard for Online Store in Excel?
A Sales Dashboard for Online Store in Excel is a ready-to-use analytical tool that tracks, analyzes, and visualizes e-commerce sales data in one place. Instead of checking multiple reports, you get a consolidated view of sales, discounts, shipping costs, profit margins, and trends.
Because it uses Excel, the dashboard remains flexible, affordable, and easy to maintain. You can update data, refresh charts, and instantly see updated insights. Therefore, it works perfectly for small businesses, growing online stores, and even large e-commerce teams.
Why Do Online Stores Need a Sales Dashboard?
Online stores generate large volumes of data every day. Orders, discounts, taxes, shipping, and costs change constantly. Without a structured dashboard:
- Sales performance remains unclear
- Profit margins stay hidden
- High-cost regions go unnoticed
- Product performance becomes difficult to track
However, with a Sales Dashboard in Excel, you gain clarity, control, and confidence.
How Does a Sales Dashboard for Online Store in Excel Work?
The dashboard connects to a structured sales data table that includes order details, product information, regions, lead sources, and costs. Once you update the data:
- Charts refresh automatically
- KPIs recalculate instantly
- Trends become visible immediately
As a result, decision-making becomes faster and more accurate.
Dashboard Structure: Sheets Explained in Detail
This Sales Dashboard for Online Store in Excel includes multiple well-designed sheet tabs. Each sheet focuses on a specific area of analysis. Let us explore them one by one.
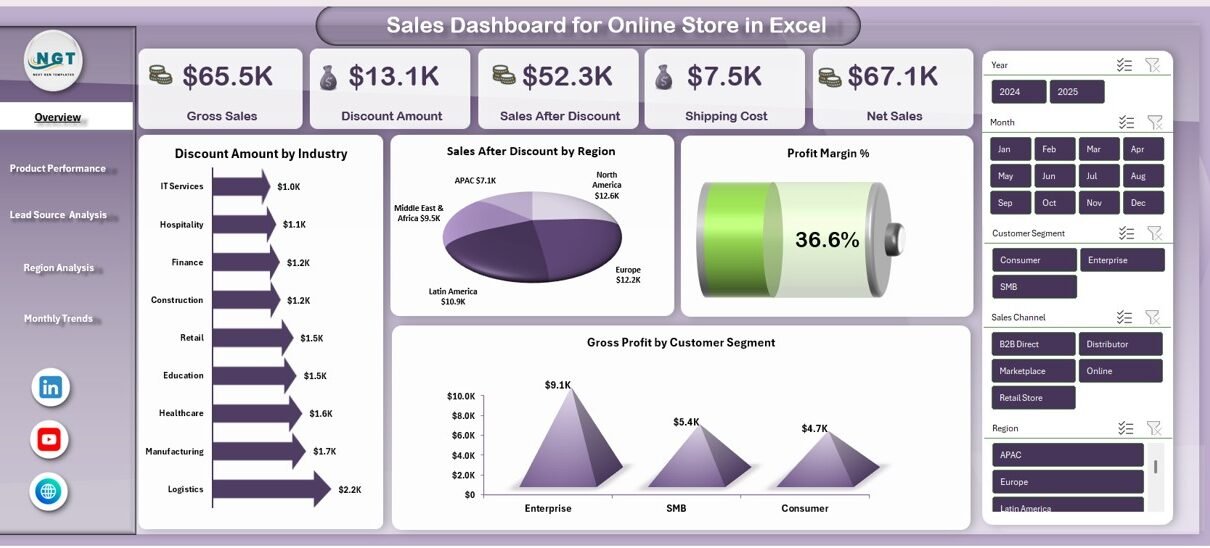
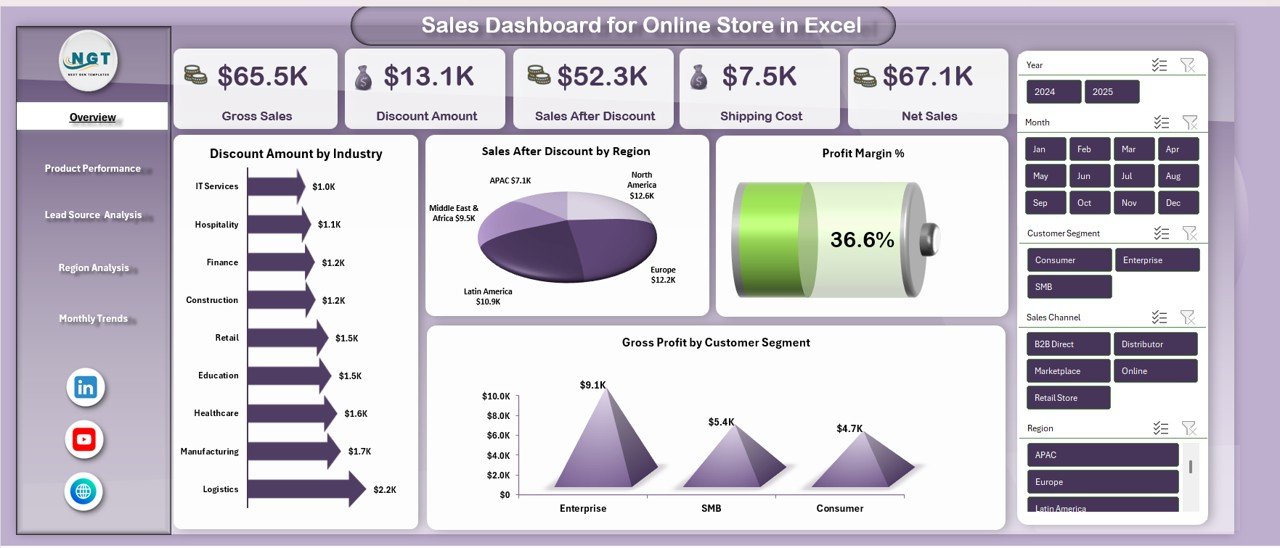
Overview Sheet Tab: What Does the Overview Show?
The Overview Sheet acts as the control center of the dashboard. It summarizes overall performance at a glance. Therefore, managers can instantly understand business health without deep analysis.
Key KPIs in the Overview Sheet
- Gross Sales
Shows total sales before discounts, taxes, and costs. It helps measure top-line revenue. - Discount Amount
Displays total discounts offered. This metric helps evaluate pricing and promotional strategies. - Sales After Discount
Reflects actual customer-paid sales after discounts. - Shipping Cost
Tracks total shipping expenses. This insight supports logistics optimization. - Net Sales
Shows final revenue after all deductions. This KPI reflects true sales performance. - Profit Margin %
Indicates overall profitability. Higher margins signal better cost control.
Visual Analysis in the Overview Sheet
- Discount Amount by Industry
Helps identify which industries receive higher discounts. - Sales After Discount by Region
Shows which regions generate the most revenue.
Because of these visuals, the overview sheet supports quick strategic decisions.
Click to buy Sales Dashboard For online Store in Excel
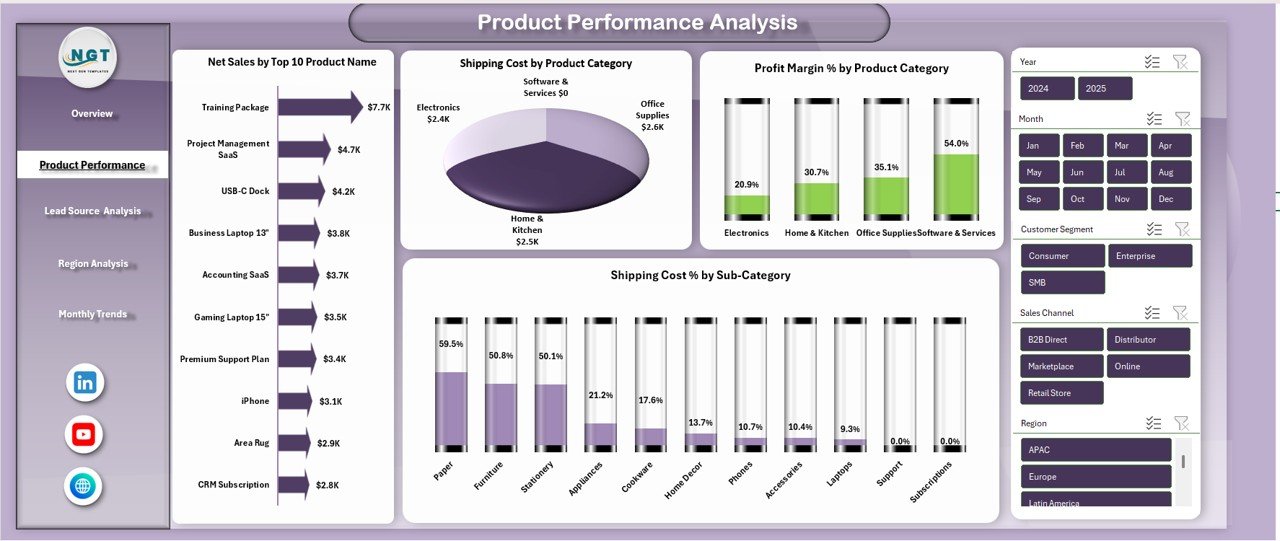
Product Performance Analysis: Which Products Drive Profit?
The Product Performance Analysis sheet focuses on how individual products and categories perform. As a result, businesses can identify best-sellers and cost-heavy items.
Key Insights in Product Performance Analysis
- Net Sales by Top 10 Product Name
Highlights top-performing products based on revenue. - Shipping Cost by Product Category
Shows which categories incur higher logistics costs. - Profit Margin % by Product Category
Helps compare profitability across product groups. - Shipping Cost % by Sub-Category
Identifies sub-categories with inefficient shipping costs.
Why This Sheet Matters
Because not all sales equal profit, this sheet helps businesses:
- Focus on high-margin products
- Improve pricing strategies
- Reduce shipping inefficiencies
Click to buy Sales Dashboard For online Store in Excel
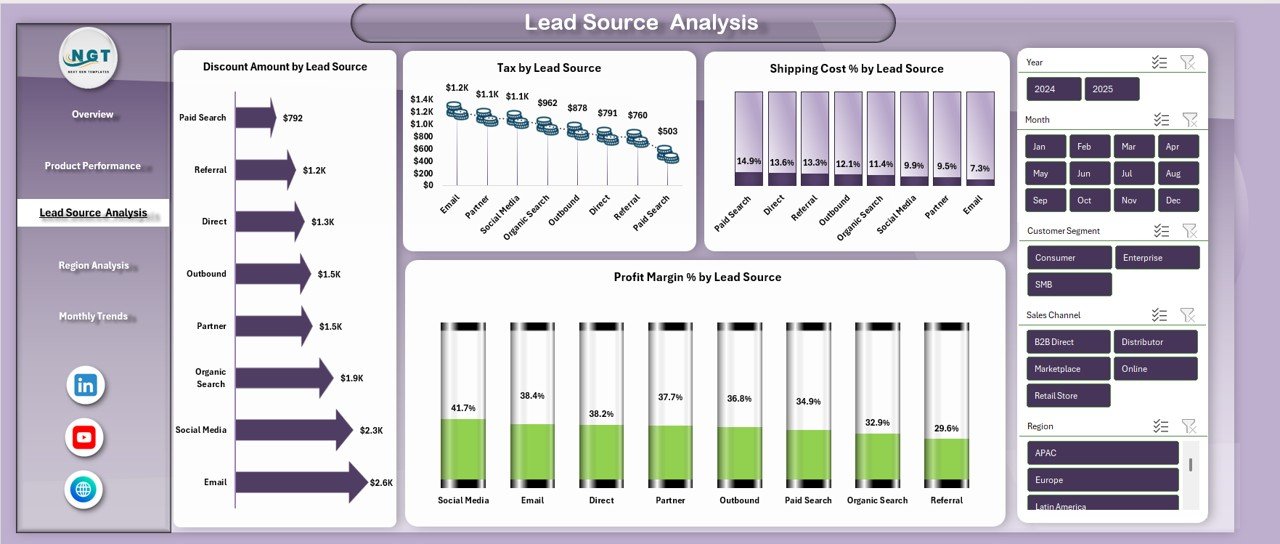
Lead Source Analysis: Which Channels Perform Best?
The Lead Source Analysis sheet evaluates how different marketing or acquisition channels impact sales and costs.
Metrics Tracked in Lead Source Analysis
- Discount Amount by Lead Source
Shows which channels rely heavily on discounts. - Tax by Lead Source
Helps understand tax distribution across channels. - Shipping Cost % by Lead Source
Highlights logistics cost efficiency by channel. - Profit Margin % by Lead Source
Identifies the most profitable lead sources.
How This Helps Marketing Decisions
With this analysis, businesses can:
- Invest more in profitable channels
- Optimize discount strategies
- Improve marketing ROI
Click to buy Sales Dashboard For online Store in Excel
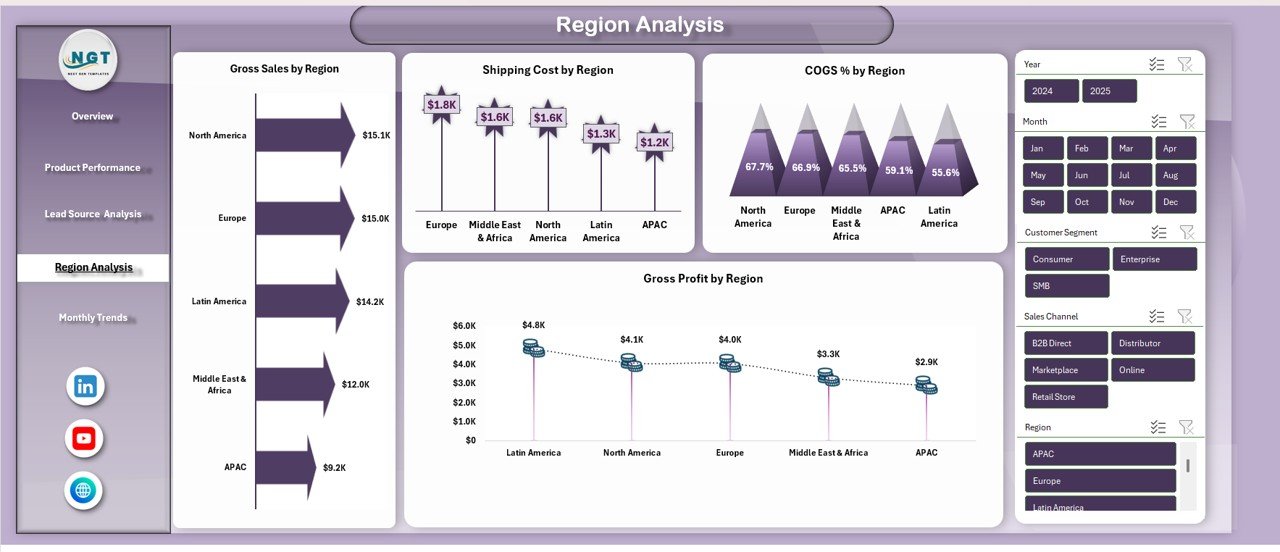
Region Analysis: How Do Regions Impact Sales and Costs?
The Region Analysis sheet compares sales performance across geographical areas.
Key Regional Metrics
- Gross Sales by Region
Shows revenue distribution by location. - Shipping Cost by Region
Identifies regions with high delivery expenses. - Gross Profit by Region
Highlights profitable markets. - COGS % by Region
Tracks cost of goods sold across regions.
Strategic Value of Region Analysis
This sheet helps businesses:
- Optimize regional pricing
- Improve warehouse placement
- Adjust shipping strategies
Click to buy Sales Dashboard For online Store in Excel
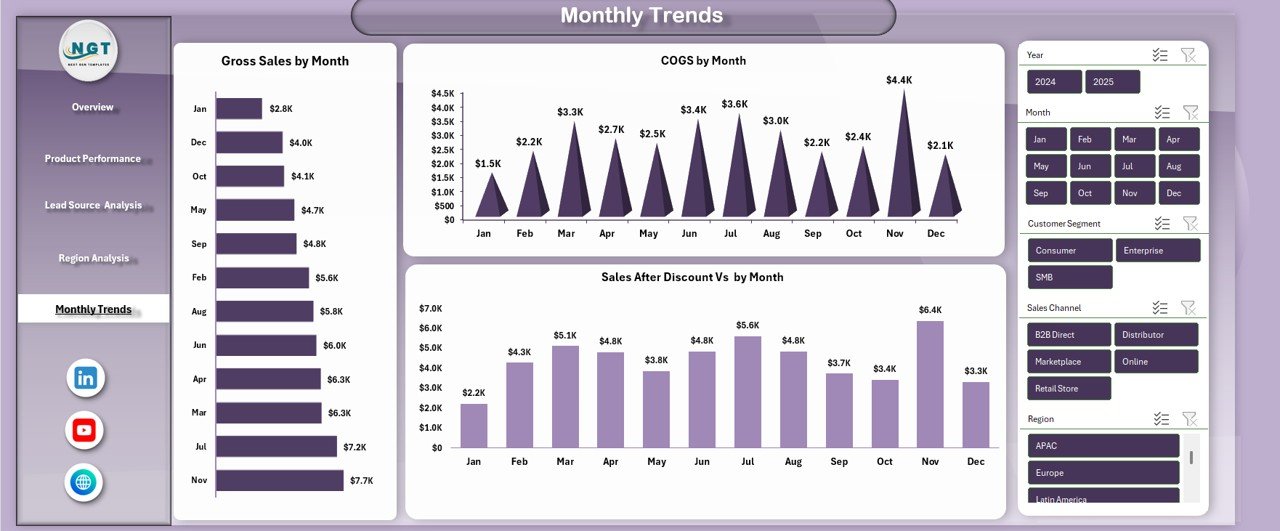
Monthly Trends: How Does Performance Change Over Time?
The Monthly Trends sheet focuses on time-based performance. It allows businesses to monitor seasonality and growth.
Monthly Trend Charts Included
- Gross Sales by Month
Shows sales growth or decline over time. - COGS by Month
Tracks cost trends and supplier efficiency. - Sales After Discount vs Month
Compares net sales across months.
Why Trend Analysis Is Critical
Because e-commerce performance changes monthly, this sheet helps:
- Forecast future sales
- Identify seasonal patterns
- Plan inventory effectively
Click to buy Sales Dashboard For online Store in Excel
Advantages of Sales Dashboard for Online Store in Excel
Using a Sales Dashboard in Excel offers several powerful benefits.
- Centralized Sales Reporting
All sales data stays in one place. Therefore, you avoid confusion and duplication.
- Real-Time Insights
Once you update data, charts refresh instantly. As a result, decisions stay timely.
- Cost-Effective Solution
Excel removes the need for expensive BI tools. Hence, it suits small and medium businesses.
- Improved Profitability Tracking
Profit margin analysis helps control costs and improve pricing strategies.
- Better Strategic Planning
With trends and comparisons, planning becomes data-driven rather than guess-based.
Who Should Use a Sales Dashboard for Online Store in Excel?
This dashboard works perfectly for:
- Online store owners
- E-commerce managers
- Sales analysts
- Finance teams
- Digital marketing teams
Because it adapts easily, it fits businesses of all sizes.
Best Practices for the Sales Dashboard for Online Store in Excel
To get maximum value, follow these best practices.
- Maintain Clean and Structured Data
Always keep your sales data accurate and consistent. Clean data ensures reliable insights.
- Update Data Regularly
Frequent updates keep the dashboard relevant. Therefore, schedule weekly or monthly updates.
- Monitor Profit Margins Closely
Do not focus only on sales volume. Always analyze profit margins.
- Compare Performance Across Dimensions
Use region, product, and lead source analysis together for deeper insights.
- Use Trends for Forecasting
Monthly trends help predict future performance. Hence, use them for planning inventory and promotions.
How Does This Dashboard Improve Decision-Making?
A Sales Dashboard for Online Store in Excel transforms raw numbers into meaningful stories. Instead of reacting late, businesses act early. Moreover, leaders gain confidence because decisions rely on data, not assumptions.
Common Challenges Solved by This Dashboard
- Scattered sales data
- Lack of profitability visibility
- Poor regional insights
- Inefficient discount strategies
- Manual reporting workload
Because of this dashboard, reporting becomes faster, clearer, and smarter.
Conclusion: Why Every Online Store Needs a Sales Dashboard in Excel
In conclusion, a Sales Dashboard for Online Store in Excel is not just a reporting tool—it is a strategic asset. It simplifies complex data, highlights opportunities, and supports smarter decisions. Moreover, it saves time, reduces errors, and improves profitability.
As e-commerce competition grows, businesses that use data effectively stay ahead. Therefore, adopting a structured sales dashboard in Excel becomes a smart and practical choice for long-term success.
Frequently Asked Questions (FAQs)
- What data do I need for a Sales Dashboard for Online Store in Excel?
You need order-level data such as order date, product name, category, region, lead source, gross sales, discounts, shipping cost, tax, COGS, and net sales.
- Can small online stores use this dashboard?
Yes, absolutely. This dashboard suits small, medium, and large online stores because Excel remains flexible and scalable.
- How often should I update the dashboard?
Ideally, update it weekly or monthly. However, high-volume stores can update it daily.
- Does this dashboard replace accounting software?
No, it complements accounting tools. It focuses on analysis and insights rather than bookkeeping.
- Can I customize the dashboard?
Yes. You can add new KPIs, charts, or filters based on your business needs.
- Is Excel enough for advanced sales analysis?
Yes, for most online stores, Excel provides powerful analysis when structured dashboards and formulas are used correctly.
Visit our YouTube channel to learn step-by-step video tutorials
Watch the step-by-step video tutorial:
Click to buy Sales Dashboard For online Store in Excel