Smart cities depend on data-driven decisions to manage complex urban projects. Because smart city initiatives involve multiple contracts, departments, cities, and stakeholders, managing contracts manually becomes slow and risky. Therefore, city authorities need a centralized and intelligent system to track contract performance.
That is exactly why a Smart Cities Contract Management Dashboard in Power BI becomes a critical solution.
This dashboard transforms raw contract data into clear, visual, and actionable insights. As a result, decision-makers gain full visibility into contract costs, delays, completion status, and variances across departments, cities, and contract types.
In this detailed guide, you will learn what a Smart Cities Contract Management Dashboard in Power BI is, why it matters, how it works, its page-wise structure, key benefits, best practices, and frequently asked questions.
Click to Purchases Smart Cities Contract Management Dashboard in Power BI
What Is a Smart Cities Contract Management Dashboard in Power BI?
A Smart Cities Contract Management Dashboard in Power BI is an interactive analytics solution designed to monitor and analyze all contract-related KPIs within smart city projects.
Instead of using scattered spreadsheets or manual reports, this dashboard consolidates all contract data into a single Power BI file. Consequently, city planners, finance teams, and project managers can track contract progress, costs, and performance in real time.
Moreover, Power BI provides dynamic filters, drill-down features, and interactive visuals. Therefore, users can analyze data from multiple angles without technical effort.
Why Do Smart Cities Need a Contract Management Dashboard?
Smart city projects involve infrastructure development, IT systems, utilities, transportation, and public services. Because these projects run across multiple cities and departments, contract oversight becomes challenging.
Without a proper dashboard:
-
Contract overruns increase
-
Cost control weakens
-
Delays remain unnoticed
-
Decision-making becomes reactive
However, when teams use a Smart Cities Contract Management Dashboard in Power BI, they gain control, transparency, and speed.
As a result, city leaders can make informed decisions quickly and confidently.
How Does a Smart Cities Contract Management Dashboard in Power BI Work?
This dashboard works by connecting contract data sources such as ERP systems, Excel files, or databases to Power BI. After that, Power BI models the data and calculates KPIs like cost variance, completion percentage, and delays.
Then, the dashboard presents these insights through interactive pages, charts, and cards. Additionally, slicers allow users to filter data by city, department, contract type, or time period.
Because Power BI updates data automatically, users always see the latest performance metrics.
What Are the Key Pages in the Smart Cities Contract Management Dashboard in Power BI?
This dashboard includes five powerful analytical pages, each designed to answer specific business questions.
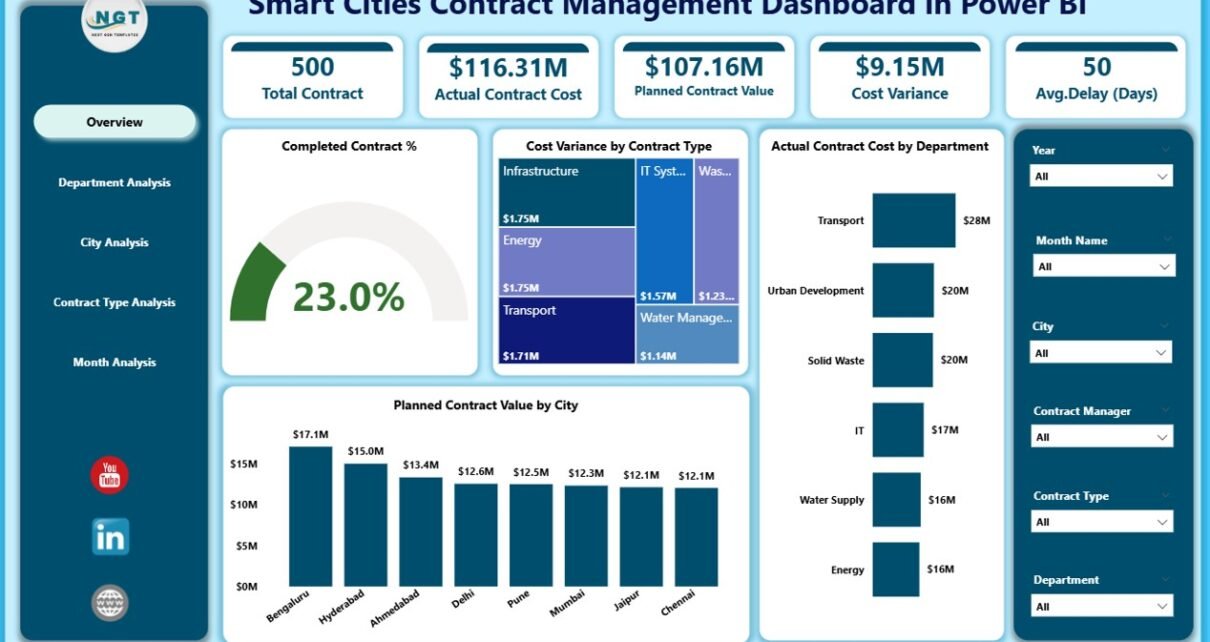
1. What Does the Overview Page Show?
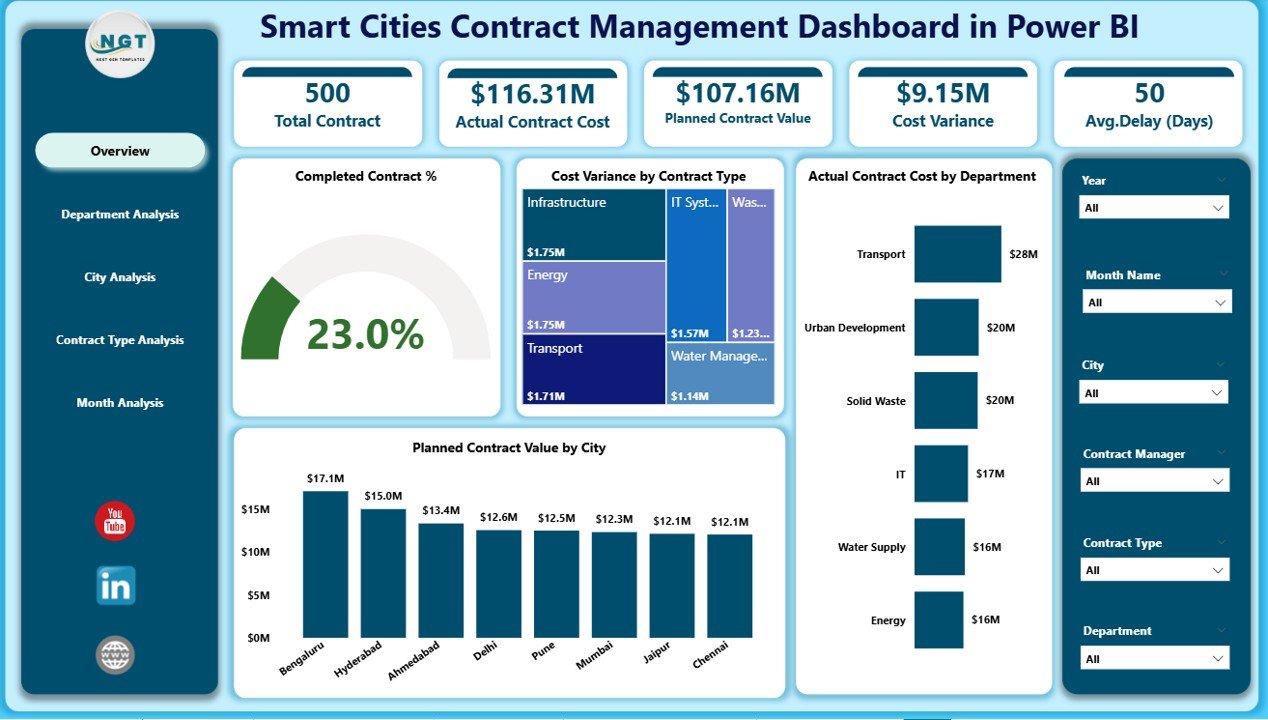
The Overview Page serves as the main entry point of the dashboard. Because leaders need quick insights, this page focuses on high-level KPIs.
Key Elements of the Overview Page:
KPI Cards
-
Completed Contract %
-
Total Cost Variance
-
Actual Contract Cost
-
Planned Contract Value
Charts
-
📊 Completed Contract %
-
📊 Cost Variance by Contract Type
-
📊 Actual Contract Cost by Department
-
📊 Planned Contract Value by City
Additionally, slicers allow users to filter data instantly. Therefore, executives can quickly identify problem areas and opportunities.
2. How Does the Department Analysis Page Help?
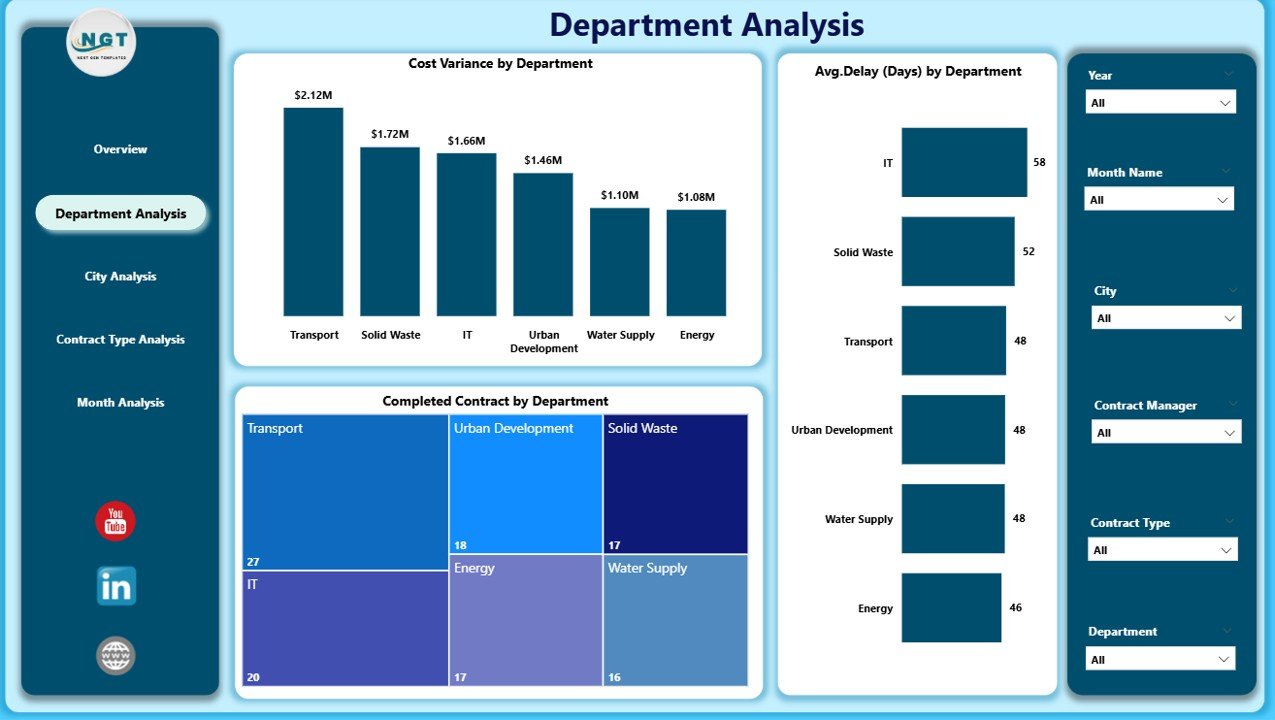
The Department Analysis Page focuses on performance across departments. Because each department manages different contracts, this page helps compare efficiency and risk.
Key Charts in Department Analysis:
-
📈 Cost Variance by Department
-
📉 Average Delay by Department
-
📊 Completed Contract by Department
As a result, city managers can identify which departments deliver contracts on time and within budget.
Click to Purchases Smart Cities Contract Management Dashboard in Power BI
3. Why Is the City Analysis Page Important?
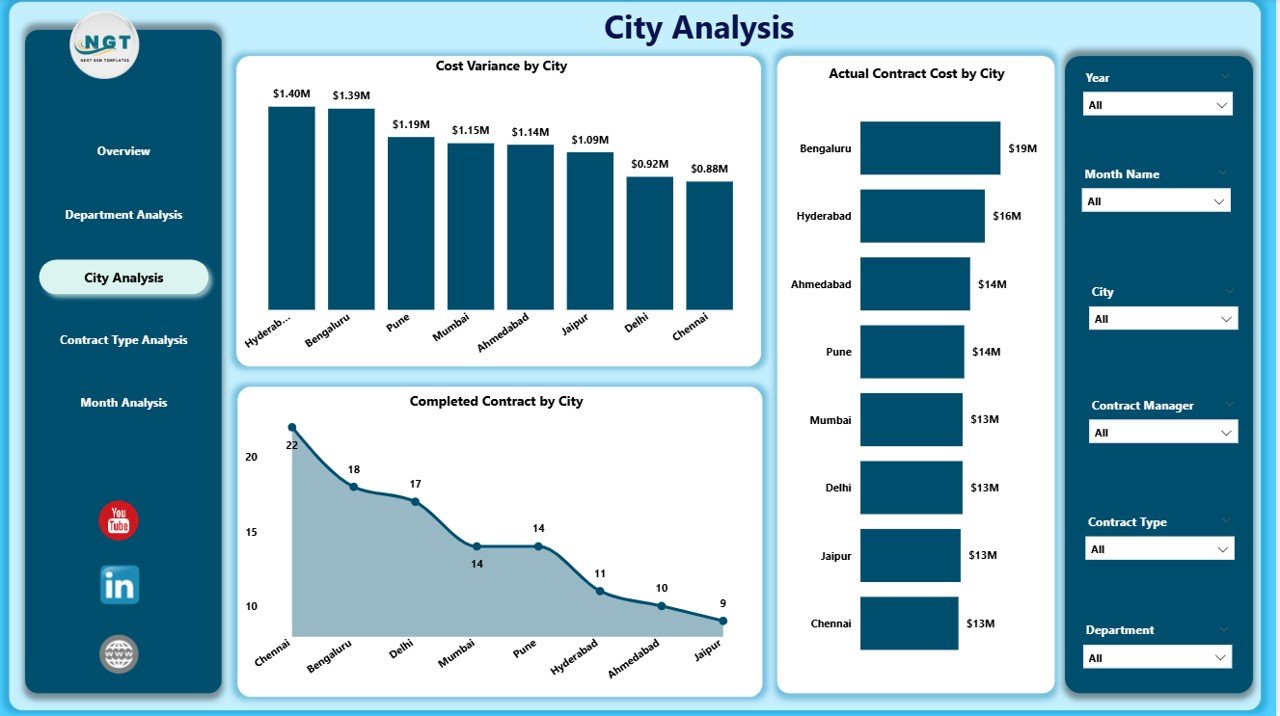
Smart city projects often span multiple cities. Therefore, analyzing performance city-wise becomes essential.
The City Analysis Page provides deep insights into city-level contract performance.
Key Charts in City Analysis:
-
📊 Cost Variance by City
-
📈 Actual Contract Cost by City
-
📉 Completed Contract by City
Consequently, planners can compare cities, identify inefficiencies, and allocate resources better.
4. What Insights Does Contract Type Analysis Provide?
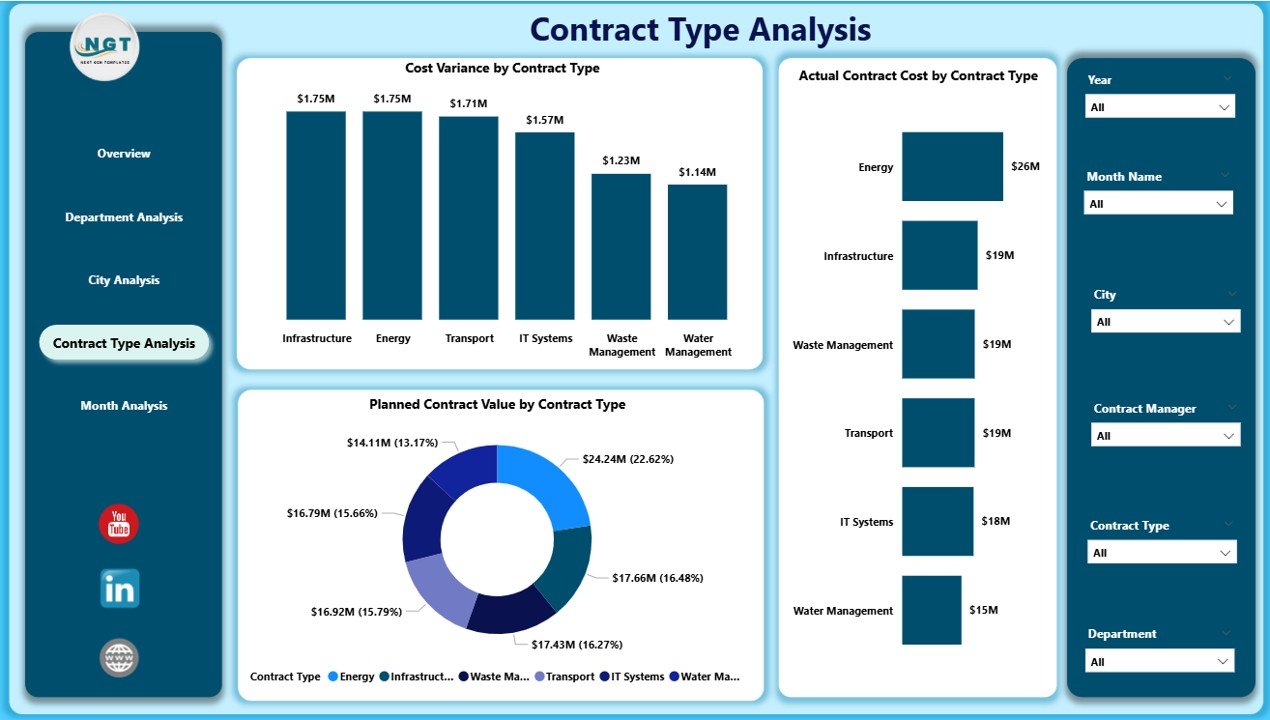
Different contract types behave differently. For example, IT contracts differ from infrastructure contracts in cost and timelines.
The Contract Type Analysis Page helps analyze performance by contract category.
Key Charts in Contract Type Analysis:
-
📊 Cost Variance by Contract Type
-
📈 Actual Contract Cost by Contract Type
-
📉 Planned Contract Value by Contract Type
As a result, procurement teams can optimize contract strategies and negotiate better terms.
5. How Does the Monthly Trends Page Support Planning?
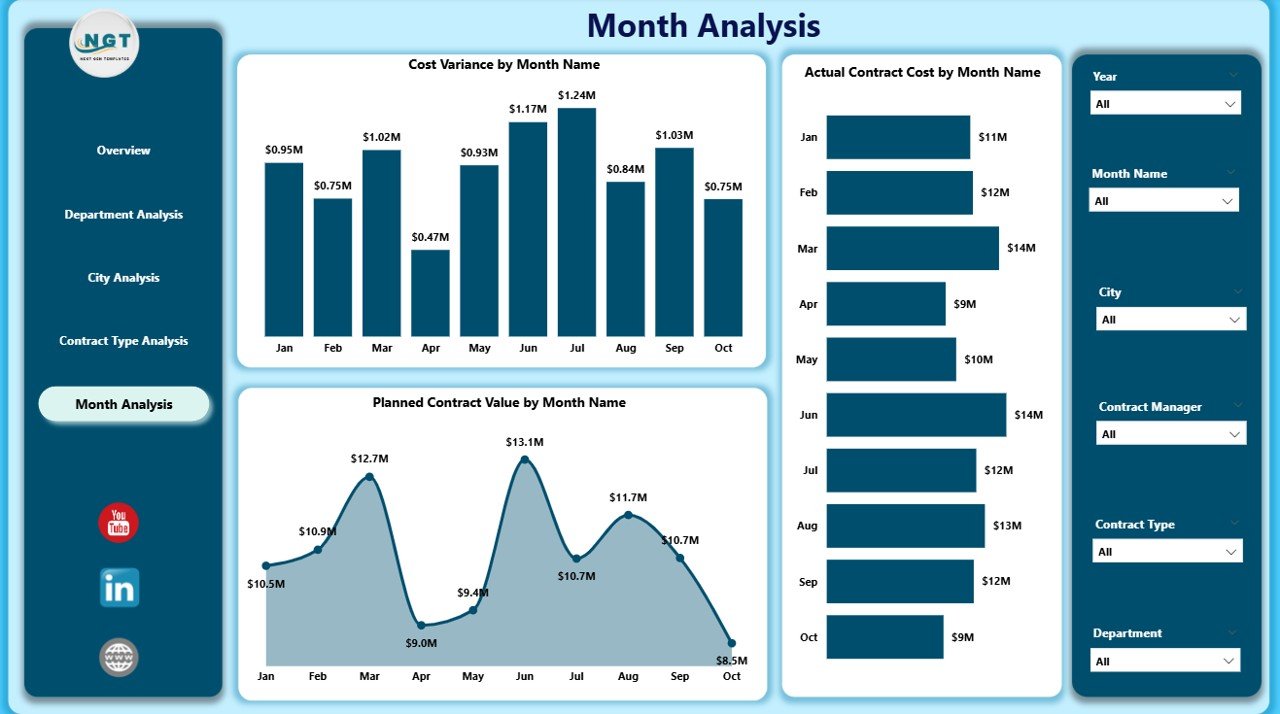
Trends reveal patterns that static reports cannot show. Therefore, the Monthly Trends Page plays a crucial role.
Key Charts in Monthly Trends:
-
📈 Cost Variance by Month
-
📊 Actual Contract Cost by Month
-
📉 Planned Contract Value by Month
This page helps forecast future risks and improves long-term planning.
Advantages of Smart Cities Contract Management Dashboard in Power BI
A Smart Cities Contract Management Dashboard in Power BI offers multiple strategic advantages.
1. Centralized Contract Visibility
-
All contract data in one place
-
No manual consolidation required
2. Improved Cost Control
-
Track cost variance in real time
-
Prevent budget overruns early
3. Faster Decision-Making
-
Interactive filters and visuals
-
No dependency on manual reports
4. Enhanced Transparency
-
Clear performance metrics
-
Better accountability across teams
5. Scalable for Large Cities
-
Works across multiple cities
-
Handles thousands of contracts easily
How Does Power BI Improve Smart City Contract Governance?
Power BI enhances governance by enforcing data consistency, accuracy, and accessibility.
Because dashboards update automatically, stakeholders always see reliable information. Additionally, role-based access ensures data security.
As a result, smart cities achieve stronger compliance and better governance outcomes.
Who Should Use a Smart Cities Contract Management Dashboard?
This dashboard benefits multiple stakeholders:
-
🏙️ Smart City Authorities
-
📊 Urban Planning Teams
-
💼 Contract Managers
-
💰 Finance & Budget Teams
-
🏗️ Infrastructure Project Managers
Because the dashboard uses Power BI, even non-technical users can analyze data easily.
Best Practices for the Smart Cities Contract Management Dashboard in Power BI
To get maximum value, teams should follow best practices.
Click to Purchases Smart Cities Contract Management Dashboard in Power BI
1. Use Clean and Standardized Data
Ensure consistent contract IDs, dates, and values.
2. Define Clear KPIs
Track only relevant KPIs such as cost variance, completion rate, and delays.
3. Update Data Regularly
Schedule automatic refresh to maintain accuracy.
4. Use Slicers Effectively
Allow users to filter data by city, department, and contract type.
5. Review Dashboards Monthly
Use trend analysis to improve future planning.
Common Challenges in Smart City Contract Management and How Power BI Solves Them
Challenge 1: Data Silos
Power BI integrates data from multiple sources.
Challenge 2: Manual Reporting
Dashboards automate reporting completely.
Challenge 3: Late Risk Identification
Real-time visuals highlight issues early.
Challenge 4: Poor Transparency
Interactive dashboards improve visibility.
How Does This Dashboard Support Long-Term Smart City Goals?
Smart cities aim for sustainability, efficiency, and transparency. This dashboard aligns perfectly with those goals.
Because leaders track contract performance continuously, they can optimize spending, reduce waste, and improve project delivery.
Therefore, the dashboard becomes a strategic asset rather than just a reporting tool.
Conclusion
A Smart Cities Contract Management Dashboard in Power BI transforms how cities manage contracts. Instead of reacting to problems, teams act proactively.
With centralized data, real-time insights, and interactive analysis, city leaders gain control, confidence, and clarity. As smart cities continue to grow, such dashboards become essential for sustainable urban development.
Frequently Asked Questions (FAQs)
1. What is the purpose of a Smart Cities Contract Management Dashboard in Power BI?
It helps track contract performance, costs, and delays across cities and departments.
2. Can non-technical users use this dashboard?
Yes, Power BI dashboards are user-friendly and interactive.
3. Does this dashboard support multiple cities?
Yes, it supports city-wise analysis with slicers.
4. How often should data be updated?
Ideally, data should refresh daily or weekly.
5. Can this dashboard integrate with Excel?
Yes, Power BI connects easily with Excel data sources.
6. Is this dashboard suitable for large smart city projects?
Yes, it scales easily for large and complex projects.
Visit our YouTube channel to learn step-by-step video tutorials