Smart city projects continue to expand across the world. As cities invest heavily in infrastructure, technology, utilities, and public services, procurement teams face growing pressure to control costs, ensure compliance, and deliver value. However, many organizations still rely on scattered spreadsheets, manual tracking, and delayed reports. As a result, visibility drops and decisions slow down.
That is exactly why a Smart Cities Procurement KPI Dashboard in Excel becomes an essential tool. This dashboard converts complex procurement data into clear, visual, and actionable insights using a familiar and cost-effective platform—Microsoft Excel.
In this in-depth guide, you will learn what a Smart Cities Procurement KPI Dashboard in Excel is, why it matters, how it works, its worksheet structure, advantages, best practices, and real-world use cases. Additionally, you will discover how this dashboard supports better planning, monitoring, and decision-making without expensive BI tools.
Click to buy Smart Cities Procurement KPI Dashboard in Excel
What Is a Smart Cities Procurement KPI Dashboard in Excel?
A Smart Cities Procurement KPI Dashboard in Excel is a structured and interactive Excel-based reporting solution designed to track, analyze, and monitor procurement-related key performance indicators (KPIs) in smart city projects.
Smart city procurement often includes:
- Infrastructure and construction materials
- Technology, IoT devices, and software systems
- Utilities such as water, energy, and waste management
- Transportation and mobility systems
- Public service contracts and vendor agreements
Because these purchases involve high budgets and strict governance, procurement leaders need real-time performance insights. Instead of using multiple disconnected spreadsheets, this dashboard consolidates all KPIs into a single Excel workbook.
As a result, teams gain clarity, control, and confidence in procurement performance.
Why Do Smart Cities Need a Procurement KPI Dashboard?
Smart city procurement differs from traditional purchasing. Budgets remain large, public accountability stays high, and compliance requirements remain strict. Therefore, procurement teams must track performance continuously.
Key challenges without a dashboard
- Limited visibility into spending trends
- Delayed identification of cost overruns
- Weak monitoring of vendor performance
- Manual and time-consuming reporting
- Difficulty comparing targets with actuals
However, when teams implement a Smart Cities Procurement KPI Dashboard in Excel, they overcome these challenges effectively. Moreover, they gain structured insights that support faster and better decisions.
How Does a Smart Cities Procurement KPI Dashboard in Excel Work?
This dashboard works by combining structured data input sheets with automated calculations, pivot tables, and dynamic visuals. Because Excel remains flexible and widely used, teams adopt the dashboard quickly.
Here is how the process typically flows:
- Enter actual procurement data for each month
- Input target values and previous year numbers
- Define KPIs with formulas and performance type
- Use drop-down selections to filter by month or KPI
- Analyze MTD and YTD performance instantly
As data updates, charts and KPI indicators refresh automatically. Consequently, procurement teams always work with the latest insights.
What Worksheets Are Included in the Smart Cities Procurement KPI Dashboard in Excel?
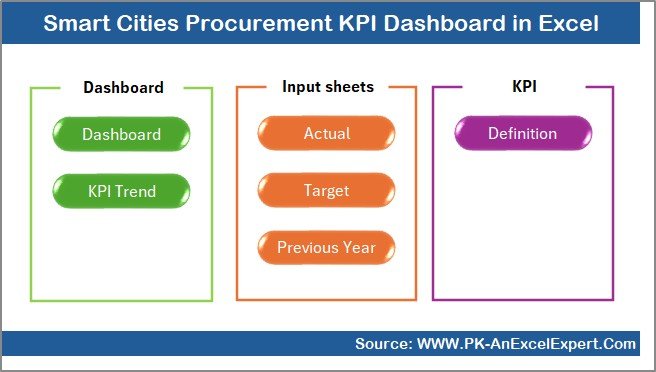
This dashboard includes 7 structured worksheets, each designed for a specific purpose. Together, they create a complete procurement performance monitoring system.
Summary Page: How Does the Index Sheet Improve Navigation?
The Summary Page acts as the index of the entire dashboard.
Key highlights of the Summary Page
- Clean and simple layout
- Six navigation buttons
- One-click access to all major sheets
- User-friendly design for non-technical users
Because procurement dashboards often contain multiple worksheets, navigation becomes critical. Therefore, this summary page saves time and improves usability.
Click to buy Smart Cities Procurement KPI Dashboard in Excel
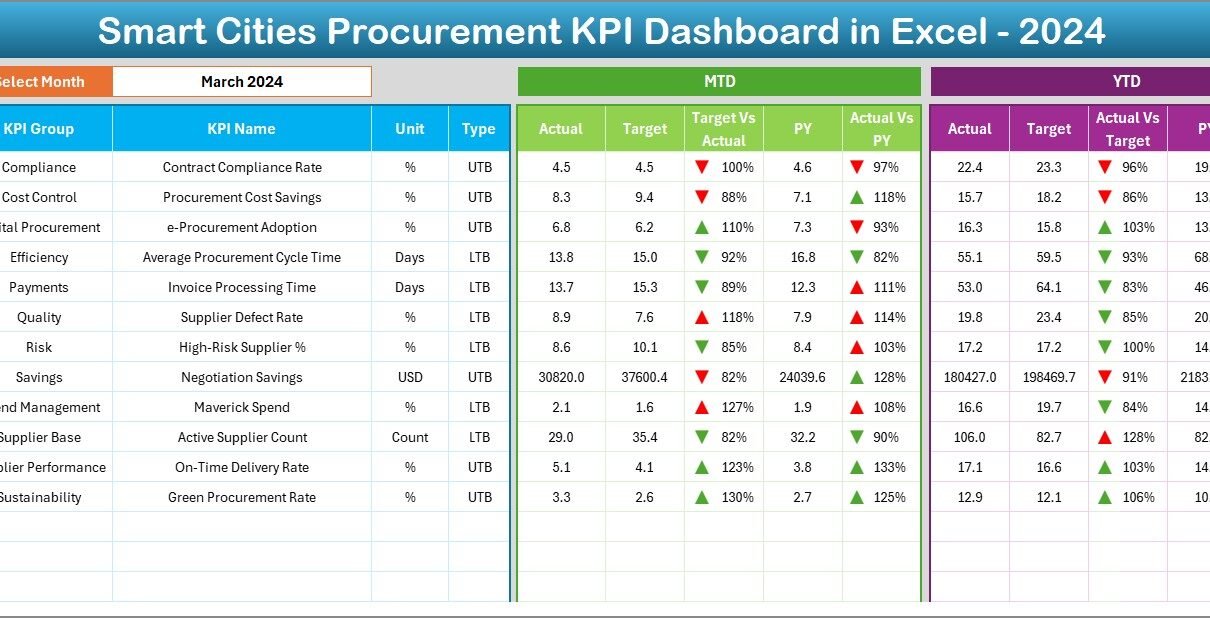
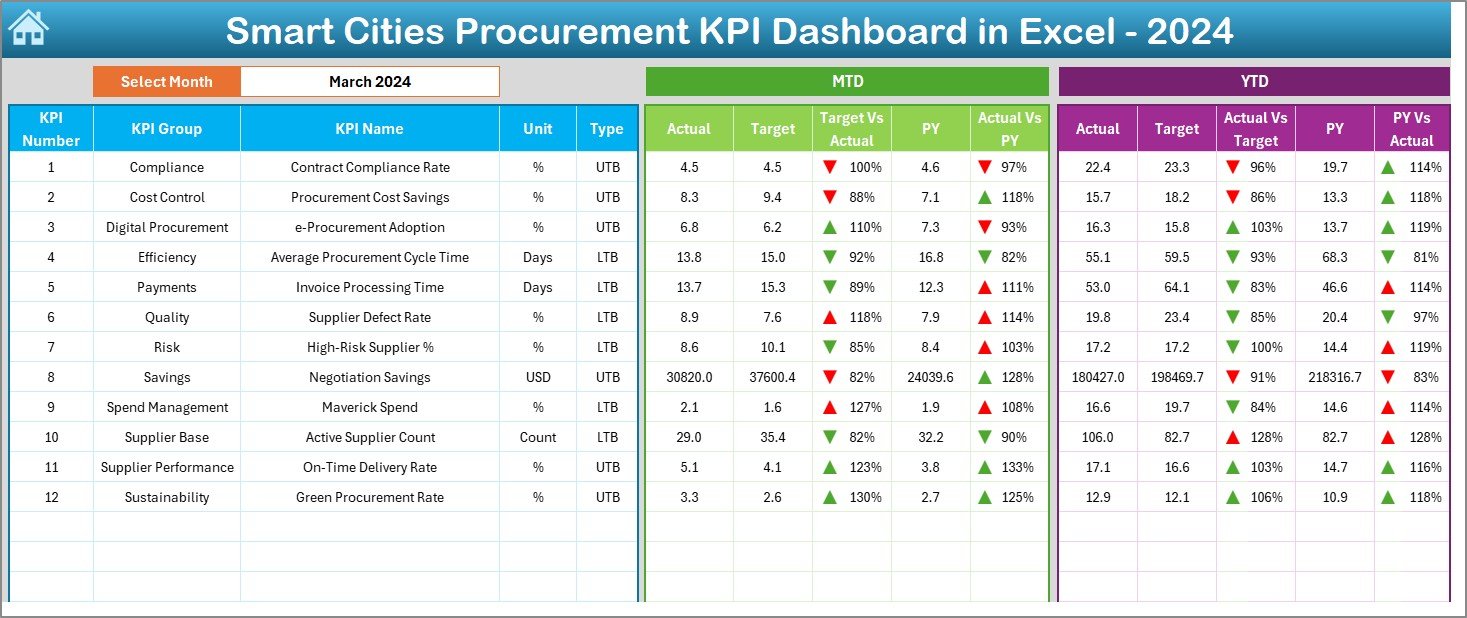
Dashboard Sheet: How Do You Track Procurement KPIs at a Glance?
The Dashboard sheet is the core of the Smart Cities Procurement KPI Dashboard in Excel.
Key features of the Dashboard sheet
- Centralized view of all procurement KPIs
- Month selection using a drop-down in cell D3
- Automatic refresh of all numbers when the month changes
- Visual indicators for quick performance evaluation
KPIs displayed on the Dashboard
For each KPI, the dashboard shows:
MTD (Month-to-Date):
- Actual
- Target
- Previous Year
- Target vs Actual (with up/down arrows)
- Previous Year vs Actual (with up/down arrows)
YTD (Year-to-Date):
- Actual
- Target
- Previous Year
- Target vs Actual comparison
- Previous Year vs Actual comparison
Because of conditional formatting, users instantly see whether performance improves or declines. As a result, decision-makers identify issues without reading long reports.
Click to buy Smart Cities Procurement KPI Dashboard in Excel
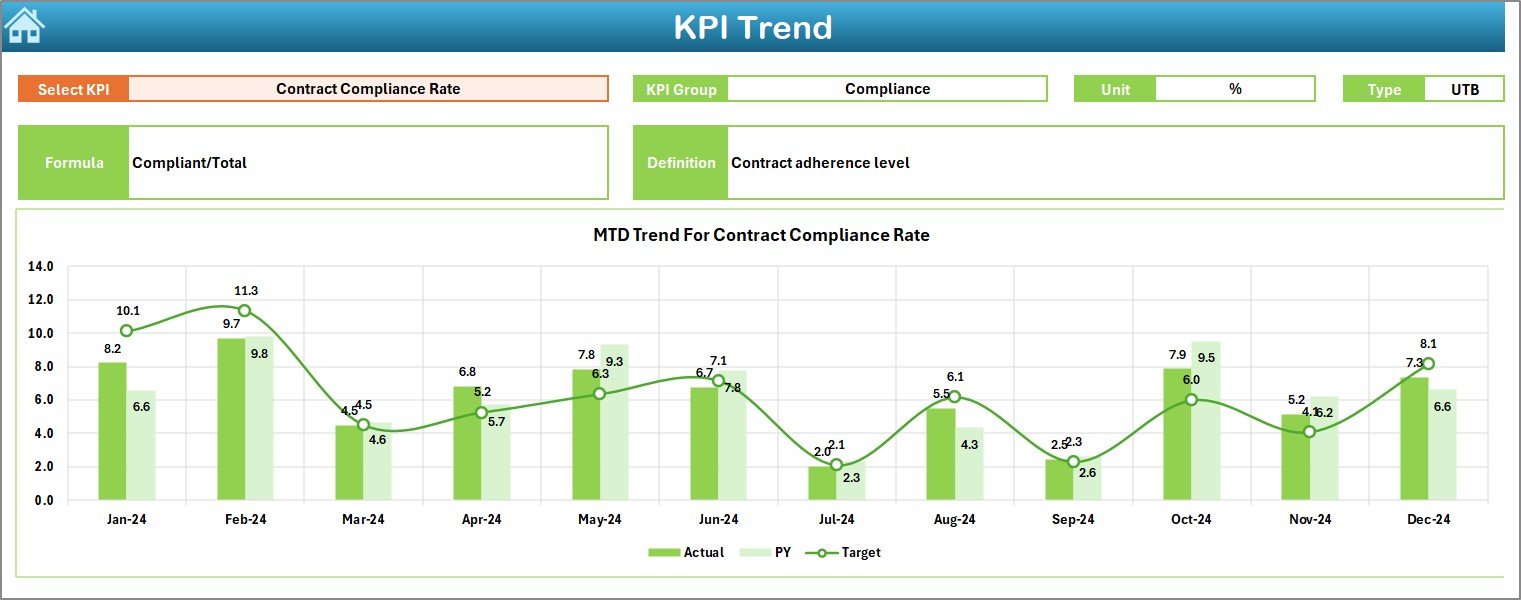
Trend Sheet: How Can You Analyze KPI Performance Over Time?
The Trend sheet focuses on deep KPI analysis.
What can you do on the Trend sheet?
- Select a KPI name using the drop-down in cell C3
- View KPI Group, Unit, and Type (LTB or UTB)
- Review KPI Formula and Definition
- Analyze performance trends visually
Charts included on the Trend sheet
- MTD trend chart for Actual, Target, and Previous Year
- YTD trend chart for Actual, Target, and Previous Year
Because trends reveal patterns, this sheet helps procurement teams forecast risks and identify improvement opportunities.
Click to buy Smart Cities Procurement KPI Dashboard in Excel
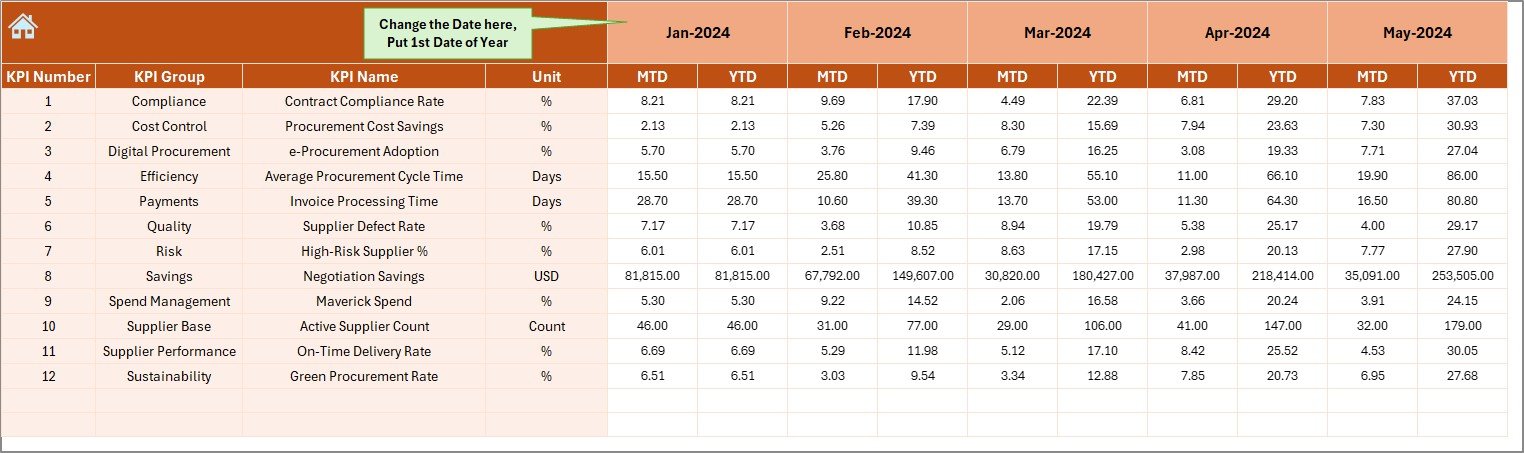
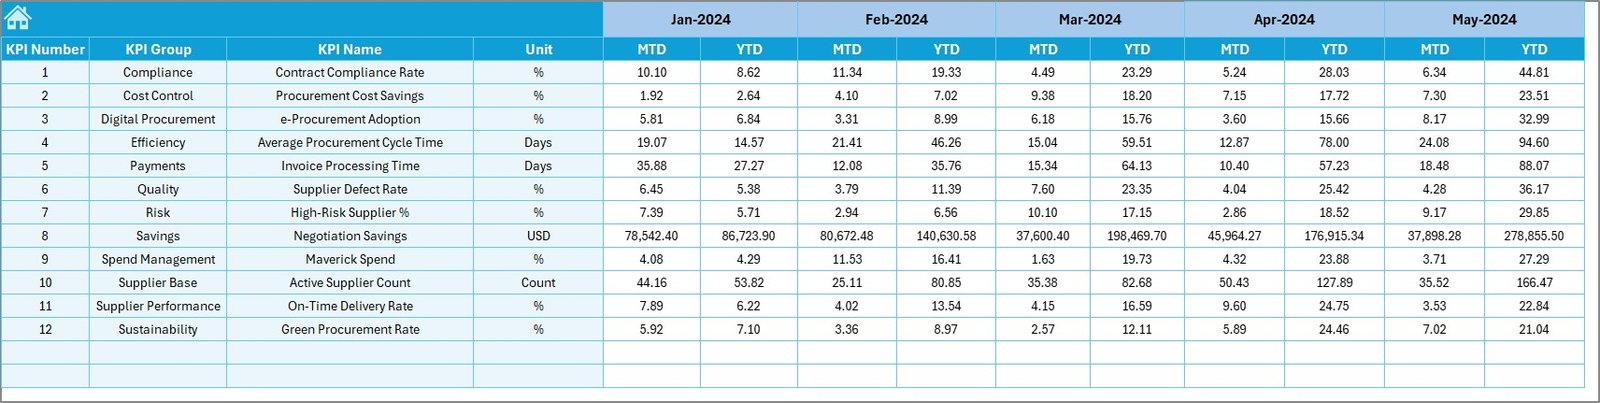
Actual Numbers Input Sheet: Where Do You Enter Procurement Data?
The Actual Numbers Input sheet stores real procurement performance data.
Key inputs on this sheet
- Monthly MTD actual values
- YTD actual values
- Month selection using cell E1
You only need to enter the first month of the year in cell E1. After that, the dashboard aligns calculations automatically.
Because this sheet remains structured, data entry stays consistent and error-free.
Click to buy Smart Cities Procurement KPI Dashboard in Excel
Target Sheet: How Do You Track Procurement Goals?
The Target Sheet captures procurement targets for each KPI.
What this sheet includes
- Monthly MTD target values
- YTD target values
- KPI-wise performance expectations
By comparing targets with actuals, procurement leaders assess efficiency and cost control. Moreover, targets help teams stay aligned with smart city budgets.
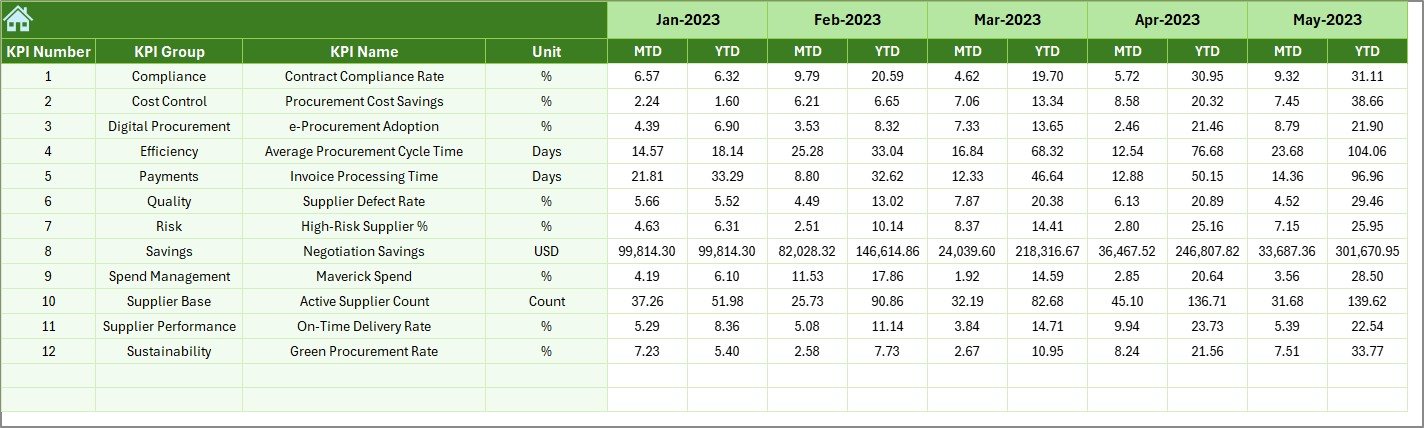
Previous Year Numbers Sheet: Why Is Historical Comparison Important?
The Previous Year Number sheet stores last year’s procurement data.
Benefits of previous year comparison
- Measure year-over-year improvement
- Identify recurring procurement issues
- Track long-term efficiency gains
- Support strategic planning
Because smart city projects span multiple years, historical insights remain critical.
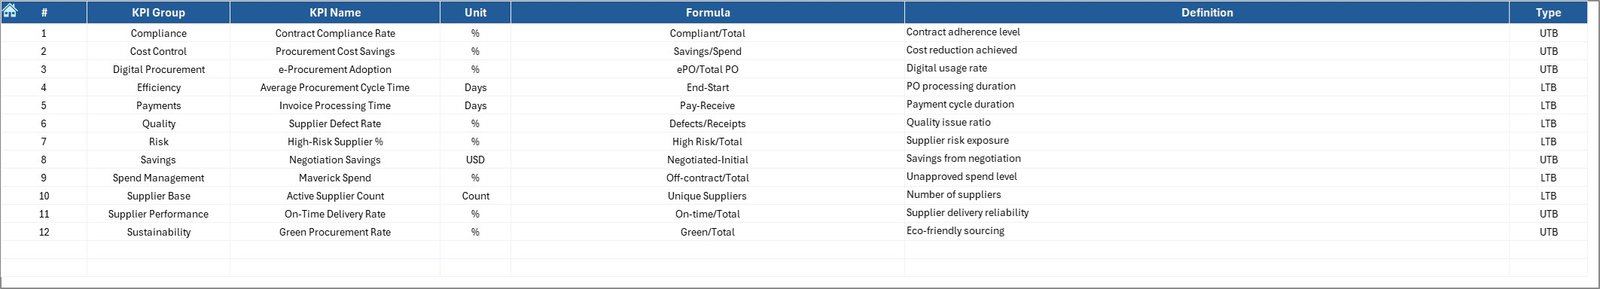
KPI Definition Sheet: How Do You Maintain KPI Consistency?
The KPI Definition sheet defines the foundation of the dashboard.
Fields included in the KPI Definition sheet
- KPI Name
- KPI Group
- Unit of Measurement
- Formula
- KPI Definition
- KPI Type (Lower the Better or Upper the Better)
Because every KPI remains clearly defined, teams avoid confusion and misinterpretation. Moreover, new users understand metrics quickly.
What KPIs Can You Track in a Smart Cities Procurement Dashboard?
This dashboard supports a wide range of procurement KPIs, such as:
- Procurement Cost Variance
- On-Time Purchase Order Rate
- Vendor Compliance Rate
- Purchase Order Cycle Time
- Cost Savings Percentage
- Contract Utilization Rate
- Emergency Purchase Ratio
- Supplier Performance Score
Because KPI definitions remain flexible, you can customize the dashboard for different smart city departments.
Advantages of Smart Cities Procurement KPI Dashboard in Excel
Why Should Procurement Teams Use This Dashboard?
The Smart Cities Procurement KPI Dashboard in Excel delivers several practical advantages.
Key advantages
- Centralized monitoring: Track all procurement KPIs in one Excel file
- Cost-effective: No need for expensive BI or analytics tools
- User-friendly: Familiar Excel interface ensures quick adoption
- Real-time insights: Instant updates with every data change
- MTD and YTD clarity: Evaluate short-term and long-term performance
- Improved accountability: Clear visibility supports transparent governance
- Scalable design: Easily extend KPIs as projects grow
Because of these benefits, procurement teams improve efficiency while reducing reporting effort.
Best Practices for the Smart Cities Procurement KPI Dashboard in Excel
To get maximum value from your dashboard, follow these best practices.
- Define KPIs clearly before implementation
Always finalize KPI definitions before data entry. Clear formulas prevent confusion later.
- Update data consistently
Enter actual numbers monthly without delays. Consistency ensures accurate trends.
- Validate data inputs
Double-check values in Actual, Target, and Previous Year sheets to avoid reporting errors.
- Use MTD and YTD together
MTD shows short-term performance, while YTD reveals long-term trends. Always review both.
- Review trends regularly
Trend charts highlight patterns that numbers alone cannot show.
- Train users on dashboard navigation
Ensure users understand drop-downs, filters, and KPI indicators.
- Customize KPIs for each smart city project
Different projects require different KPIs. Adjust definitions as needed.
How Does This Dashboard Support Smart City Governance?
Smart city governance depends on transparency, accountability, and data-driven decisions. This dashboard supports governance by:
- Providing clear procurement performance visibility
- Supporting audit and compliance reviews
- Highlighting deviations early
- Improving communication between departments
- Enabling faster corrective actions
Because Excel remains accessible to most teams, governance improves without additional complexity.
Who Should Use a Smart Cities Procurement KPI Dashboard in Excel?
This dashboard suits a wide range of users, including:
- Smart city procurement managers
- Urban development authorities
- Government procurement teams
- Project management offices (PMOs)
- Finance and compliance teams
- Vendor management teams
If you manage procurement in complex public projects, this dashboard fits your needs.
How Can You Customize This Dashboard for Your City?
Customization remains simple and flexible.
You can:
- Add or remove KPIs in the KPI Definition sheet
- Adjust targets based on city budgets
- Modify KPI groups for different departments
- Extend data for multiple years
- Add slicers or pivot charts if required
Because the dashboard uses standard Excel features, customization requires no advanced coding.
Conclusion: Is a Smart Cities Procurement KPI Dashboard in Excel Worth It?
Absolutely. A Smart Cities Procurement KPI Dashboard in Excel transforms procurement management from reactive reporting into proactive performance monitoring. It centralizes data, improves visibility, and supports faster, smarter decisions.
Moreover, it delivers enterprise-level insights without expensive tools. As smart city projects grow in scale and complexity, procurement teams need clarity more than ever. This dashboard provides that clarity in a practical, scalable, and user-friendly way.
Frequently Asked Questions (FAQs)
What is a Smart Cities Procurement KPI Dashboard in Excel?
It is an Excel-based dashboard that tracks procurement KPIs for smart city projects using MTD, YTD, target, and historical data.
Why should smart cities use Excel for procurement dashboards?
Excel remains cost-effective, flexible, and widely adopted, making it ideal for structured KPI monitoring.
Can this dashboard handle multiple departments?
Yes. You can customize KPI groups and definitions for different smart city departments.
Does the dashboard update automatically?
Yes. Once you update input sheets, all calculations and visuals refresh automatically.
Can I add new KPIs later?
Yes. You can easily add new KPIs through the KPI Definition sheet.
Is this dashboard suitable for non-technical users?
Yes. The design focuses on simplicity, navigation buttons, and clear visuals.
Does it support year-over-year analysis?
Yes. The Previous Year Number sheet enables direct year-over-year comparison.
Watch the step-by-step video tutorial:
Visit our YouTube channel to learn step-by-step video tutorials
Click to buy Smart Cities Procurement KPI Dashboard in Excel