Smart city initiatives continue to expand across the world. However, purchasing and procurement teams often struggle to maintain visibility, control, and performance alignment. Because purchasing directly impacts budgets, timelines, and service quality, tracking the right KPIs becomes essential. Therefore, organizations increasingly rely on a Smart Cities Purchasing KPI Dashboard in Excel to manage procurement performance effectively.
In this detailed guide, you will learn what a Smart Cities Purchasing KPI Dashboard in Excel is, why it matters, how it works, its worksheet structure, key advantages, best practices, and real-world use cases. Moreover, this article explains how Excel dashboards transform complex purchasing data into clear, actionable insights—without expensive BI tools.
Click to buy Smart Cities Purchasing KPI Dashboard in Excel
What Is a Smart Cities Purchasing KPI Dashboard in Excel?
A Smart Cities Purchasing KPI Dashboard in Excel is a structured and interactive Excel-based reporting tool designed to track, analyze, and monitor purchasing-related KPIs in smart city projects.
Smart city purchasing usually includes:
- Infrastructure procurement
- Technology and IoT purchases
- Utility and energy sourcing
- Transportation systems procurement
- Public service contracts and materials
Because these purchases involve high budgets and strict compliance, decision-makers require continuous monitoring. Instead of using multiple spreadsheets, this dashboard consolidates all KPIs into one centralized Excel workbook.
As a result, procurement teams gain clarity, speed, and confidence in decision-making.
Why Do Smart Cities Need a Purchasing KPI Dashboard?
Smart city projects operate under constant public scrutiny. Therefore, procurement performance directly affects transparency and accountability. However, many teams still rely on manual reports and delayed data updates.
That approach creates problems such as:
- Budget overruns
- Supplier inefficiencies
- Delayed approvals
- Poor KPI visibility
- Weak performance comparisons
A Smart Cities Purchasing KPI Dashboard in Excel solves these challenges by offering real-time performance tracking, standardized KPIs, and automated calculations.
Moreover, Excel remains familiar to most teams. Therefore, adoption becomes easy and fast.
How Does a Smart Cities Purchasing KPI Dashboard in Excel Work?
This dashboard works by combining structured data input sheets with automated calculations and pivot-based visuals. As users update actuals, targets, and previous-year values, the dashboard instantly refreshes KPIs.
Because the design uses Excel formulas, slicers, and pivot charts, teams avoid manual errors. Additionally, leadership can switch between months and KPIs using dropdowns.
As a result, procurement performance becomes transparent, measurable, and comparable.
What Are the Key KPIs Tracked in a Smart Cities Purchasing Dashboard?
Although KPIs vary by organization, most smart city purchasing dashboards track:
- Purchase Order Value
- Budget Utilization
- Cost Savings
- Target vs Actual Spend
- Vendor Performance
- Purchase Cycle Time
- Compliance Rate
- Year-over-Year Cost Trends
Because the dashboard remains customizable, teams can easily add or remove KPIs as requirements change.
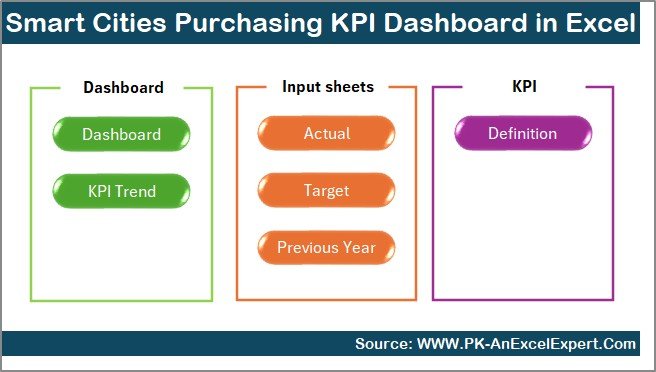
Worksheet Structure of Smart Cities Purchasing KPI Dashboard in Excel
This Smart Cities Purchasing KPI Dashboard in Excel includes 7 structured worksheets. Each worksheet plays a specific role in KPI monitoring and analysis.
Summary Page: How Does the Navigation Work?
The Summary Page acts as the index of the dashboard. Instead of searching for sheets, users can navigate using buttons.
Key Features of the Summary Page:
- Clean and professional layout
- Six navigation buttons
- One-click access to key sheets
- User-friendly experience
Because navigation stays simple, decision-makers save time and focus on insights instead of files.
Click to buy Smart Cities Purchasing KPI Dashboard in Excel
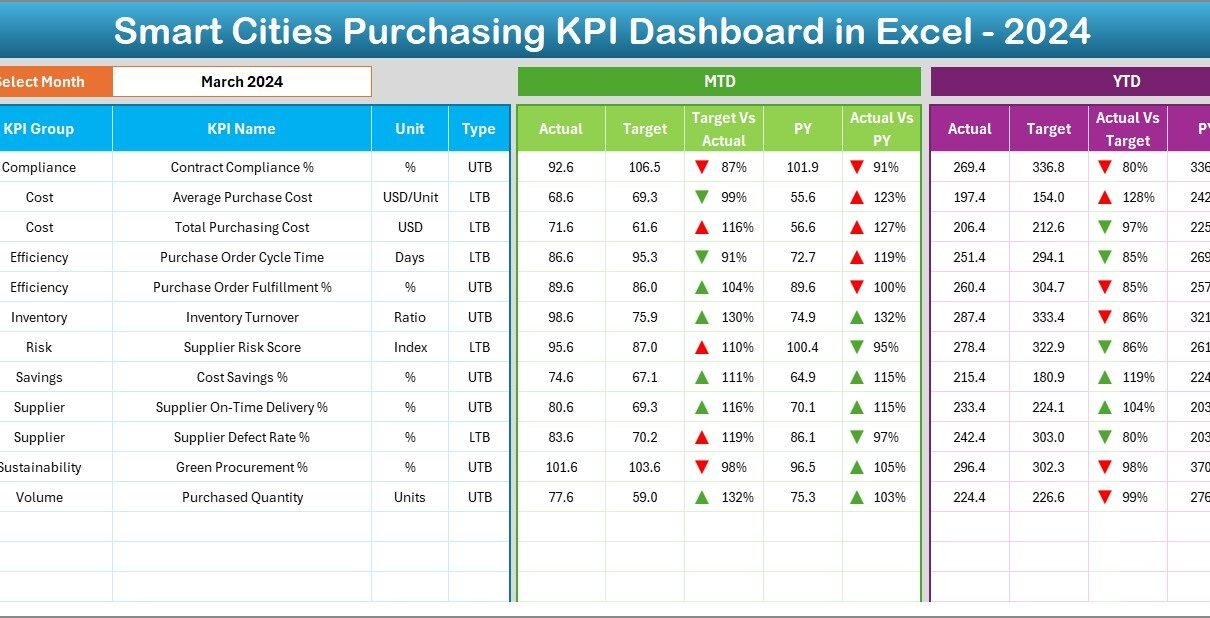
Dashboard Sheet: How Are KPIs Displayed?
The Dashboard Sheet serves as the core of the entire solution. It visually displays all KPIs for purchasing performance.
Key Functionalities:
- Month selection dropdown at cell D3
- Automatic dashboard refresh when the month changes
- Clear KPI cards and tables
KPIs Displayed on the Dashboard:
- MTD Actual
- MTD Target
- MTD Previous Year
- Target vs Actual variance
- Previous Year vs Actual variance
- Conditional formatting with up/down arrows
Additionally, the dashboard shows:
- YTD Actual
- YTD Target
- YTD Previous Year
- Variance analysis with visual indicators
Because of this design, users instantly understand performance gaps and trends.

Click to buy Smart Cities Purchasing KPI Dashboard in Excel
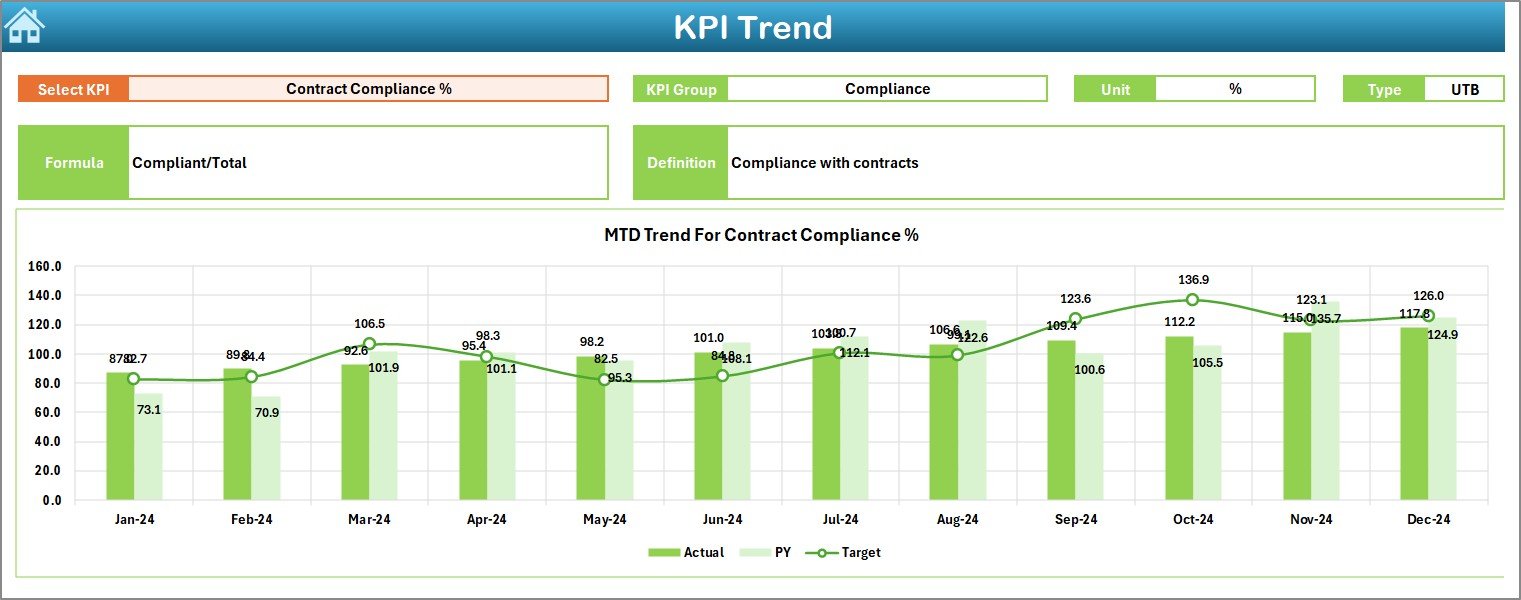
Trend Sheet: How Can You Analyze KPI Behavior?
The Trend Sheet allows deeper KPI analysis. Instead of only viewing summary numbers, users can explore trends.
Key Features:
- KPI selection dropdown at cell C3
- Display of:
KPI Group
KPI Unit
KPI Type (Upper the Better or Lower the Better)
KPI Formula
KPI Definition
Trend Analysis:
- MTD trend chart for Actual, Target, and Previous Year
- YTD trend chart for Actual, Target, and Previous Year
Because trends reveal patterns, teams can proactively identify risks and opportunities.
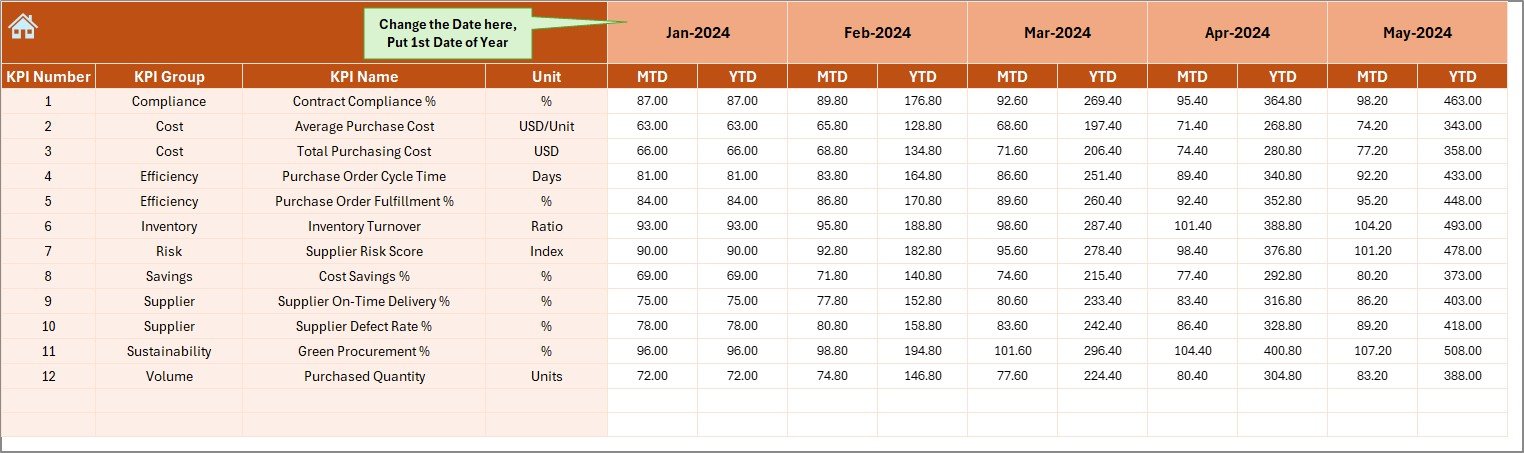
Actual Numbers Input Sheet: Where Do You Enter Data?
The Actual Numbers Input Sheet acts as the data entry point for current-year performance.
How It Works:
- Enter actual MTD and YTD values
- Change the year start month using cell E1
- Select months dynamically
Because this structure remains flexible, users can easily adjust fiscal calendars.
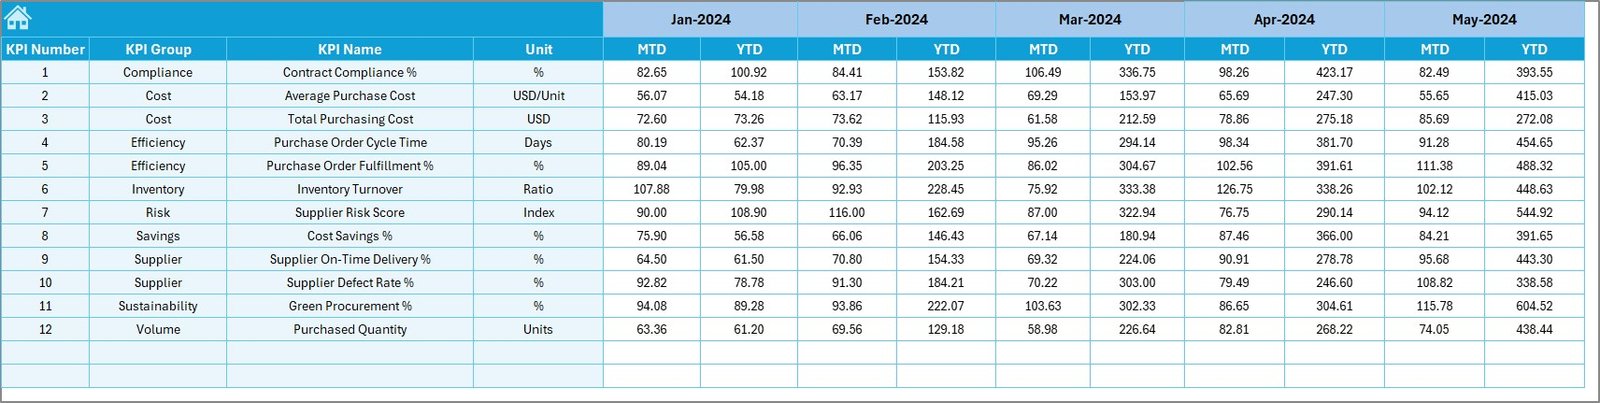
Target Sheet: How Are Targets Managed?
The Target Sheet stores planned performance benchmarks.
Key Capabilities:
- Monthly MTD targets
- Cumulative YTD targets
- KPI-wise target entry
Because targets remain separate from actuals, variance analysis stays accurate and transparent.
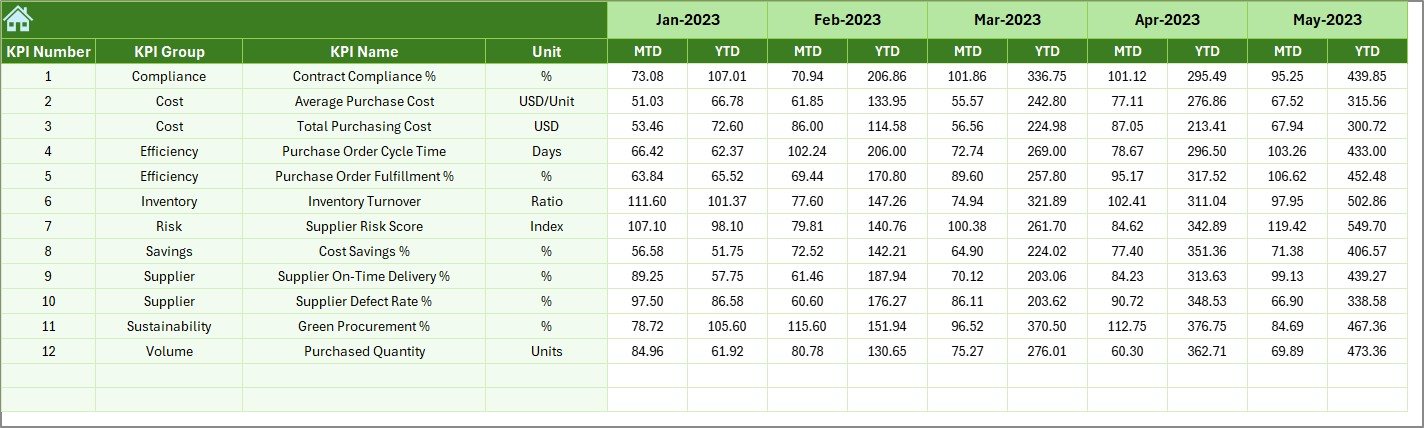
Previous Year Numbers Sheet: Why Is Historical Data Important?
The Previous Year Numbers Sheet captures historical purchasing data.
Benefits:
- Enables year-over-year comparison
- Highlights improvement or decline
- Supports trend-based decisions
By comparing current performance with historical data, procurement teams gain context and clarity.
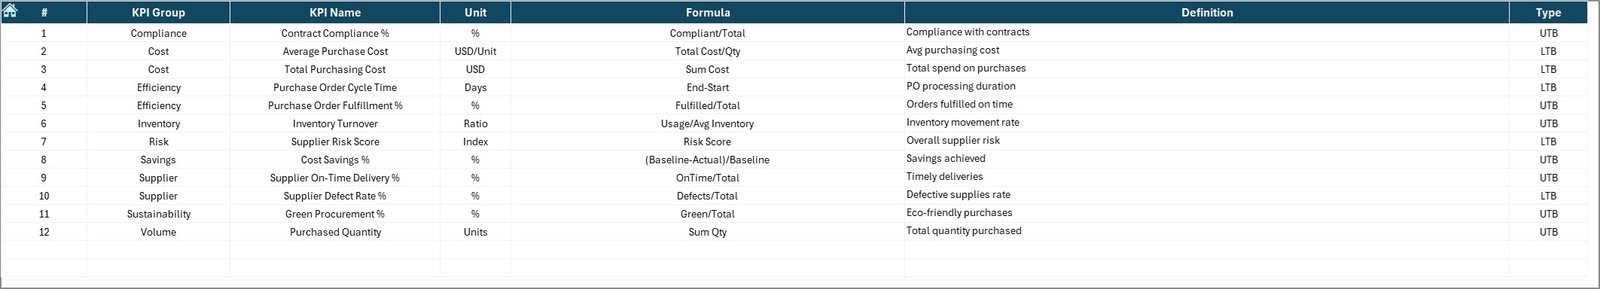
KPI Definition Sheet: How Does Standardization Help?
The KPI Definition Sheet ensures consistency and clarity.
Information Captured:
- KPI Name
- KPI Group
- KPI Unit
- KPI Formula
- KPI Definition
Because everyone uses the same definitions, confusion disappears and alignment improves.
Advantages of Smart Cities Purchasing KPI Dashboard in Excel
A Smart Cities Purchasing KPI Dashboard in Excel delivers significant operational and strategic benefits.
- Centralized Procurement Visibility
All purchasing KPIs exist in one Excel file. Therefore, teams avoid scattered reports.
- Faster Decision-Making
Because KPIs update instantly, leaders act quickly and confidently.
- Cost Control and Budget Discipline
Target vs Actual analysis highlights overspending early.
- Improved Vendor Performance Tracking
Consistent KPI monitoring strengthens supplier accountability.
- No Need for Expensive BI Tools
Excel provides enterprise-level insights without additional software costs.
- Easy Customization
Teams can add KPIs, modify formulas, or change visuals easily.
How Does This Dashboard Improve Smart City Governance?
Smart cities demand transparency. Therefore, procurement reporting must support audits, compliance, and public accountability.
This dashboard:
- Improves reporting accuracy
- Enhances financial discipline
- Supports data-driven governance
- Strengthens stakeholder confidence
As a result, purchasing operations align better with smart city goals.
Best Practices for the Smart Cities Purchasing KPI Dashboard in Excel
To maximize value, follow these best practices.
- Define KPIs Clearly
Always document KPI definitions and formulas in the KPI Definition sheet.
- Update Data Regularly
Enter actuals monthly to maintain dashboard accuracy.
- Validate Targets Annually
Review targets at the start of each fiscal year.
- Use Consistent Units
Ensure KPI units remain consistent across all sheets.
- Review Trends, Not Just Totals
Trend charts reveal patterns that single numbers hide.
- Limit KPI Overload
Track meaningful KPIs instead of too many metrics.
Who Can Use a Smart Cities Purchasing KPI Dashboard in Excel?
This dashboard suits multiple roles and industries.
Ideal Users Include:
- Smart city project managers
- Procurement officers
- Finance and budgeting teams
- Urban planning authorities
- Government agencies
- Public-private partnership teams
Because Excel remains widely accessible, teams adopt this dashboard easily.
Real-World Use Cases of Smart Cities Purchasing KPI Dashboard
Use Case 1: Infrastructure Procurement
Track budget utilization and vendor performance across city projects.
Use Case 2: Utility Purchases
Monitor energy and water procurement costs and trends.
Use Case 3: Technology and IoT Procurement
Analyze spending on smart sensors, systems, and platforms.
Use Case 4: Compliance Monitoring
Track procurement compliance KPIs for audits and governance.
Why Excel Remains the Best Tool for Smart City KPI Dashboards
Although BI tools exist, Excel continues to dominate.
Reasons Include:
- Familiar interface
- Low learning curve
- High flexibility
- Easy sharing
- No licensing cost
Therefore, Excel dashboards remain practical and powerful.
Conclusion: Why Choose a Smart Cities Purchasing KPI Dashboard in Excel?
A Smart Cities Purchasing KPI Dashboard in Excel empowers organizations to manage procurement with clarity, control, and confidence. Because it combines structured data, automated calculations, and interactive visuals, it transforms raw numbers into meaningful insights.
Moreover, it supports transparency, cost control, and strategic decision-making. If your smart city initiative demands accountability and efficiency, this dashboard provides a proven solution.
Frequently Asked Questions (FAQs)
What is a Smart Cities Purchasing KPI Dashboard in Excel?
It is an Excel-based tool that tracks and analyzes purchasing KPIs for smart city projects.
Can this dashboard handle multiple KPIs?
Yes. You can track multiple KPIs across MTD, YTD, and previous-year comparisons.
Does the dashboard require advanced Excel skills?
No. Basic Excel knowledge is sufficient to use and maintain it.
Can I customize the KPIs?
Yes. You can easily add, modify, or remove KPIs.
Is this dashboard suitable for government projects?
Absolutely. It supports transparency, audits, and compliance needs.
How often should data be updated?
Ideally, update data monthly for accurate insights.
Visit our YouTube channel to learn step-by-step video tutorials
Watch the step-by-step video tutorial:
Click to buy Smart Cities Purchasing KPI Dashboard in Excel