Smart city projects are growing rapidly across the world. Governments and urban authorities now manage hundreds of tenders related to infrastructure, transportation, energy, IT systems, water management, and public services. Because budgets remain high and public accountability remains strict, monitoring tender performance accurately has become more important than ever.
However, when tender data stays scattered across spreadsheets, emails, and manual reports, decision-makers lose visibility. As a result, budget overruns increase, tender progress slows down, and performance tracking becomes reactive instead of proactive.
That is exactly why the Smart Cities Tender Dashboard in Excel becomes a powerful and practical solution.
In this detailed and SEO-friendly blog post, you will learn everything about the Smart Cities Tender Dashboard in Excel. You will understand what it is, how it works, its structure, analytical pages, advantages, best practices, and frequently asked questions. By the end, you will clearly see how this dashboard helps smart city authorities gain control, transparency, and confidence in tender management.
Click to Purchases Smart Cities Tender Dashboard in Excel
What Is a Smart Cities Tender Dashboard in Excel?
A Smart Cities Tender Dashboard in Excel is a ready-to-use analytical template designed to track, analyze, and visualize smart city tender data in one centralized place. Instead of reviewing raw tender lists, this dashboard converts data into meaningful KPIs, charts, and trends.
Because the dashboard is built in Microsoft Excel, it remains simple to use, flexible, and widely accessible. At the same time, it delivers strong analytical depth without requiring expensive BI tools.
This dashboard helps answer important questions such as:
-
What is the total budget allocated to smart city tenders?
-
How much contract value is associated with approved tenders?
-
How many tenders are published, cancelled, or in progress?
-
Which cities receive the highest tender budgets?
-
Which vendors handle the most tenders?
-
What is the average project progress across cities?
-
How do tenders change month by month?
Why Do Smart Cities Need a Tender Dashboard?
Smart city tenders involve multiple stakeholders, vendors, cities, and project categories. Therefore, managing them manually often leads to delays and data gaps.
A Smart Cities Tender Dashboard becomes essential because it:
-
Centralizes tender data in one file
-
Improves budget and contract transparency
-
Tracks tender status and publishing performance
-
Supports city-wise and vendor-wise analysis
-
Enables trend-based planning and monitoring
As a result, authorities make faster, data-driven, and more accountable decisions.
Click to Purchases Smart Cities Tender Dashboard in Excel
Key Features of the Smart Cities Tender Dashboard in Excel
The Smart Cities Tender Dashboard in Excel comes with a clean layout and structured analytics. Let us explore its key features in detail.
Page Navigator for Seamless Navigation
The dashboard includes a Page Navigator located on the left side. This navigator allows users to move easily between analytical pages.
Because of this feature, users save time and access insights instantly without searching across worksheets.
Dashboard Structure – 5 Analytical Pages Explained
The Smart Cities Tender Dashboard in Excel contains 5 dedicated analytical pages, each designed to answer specific tender-related questions.
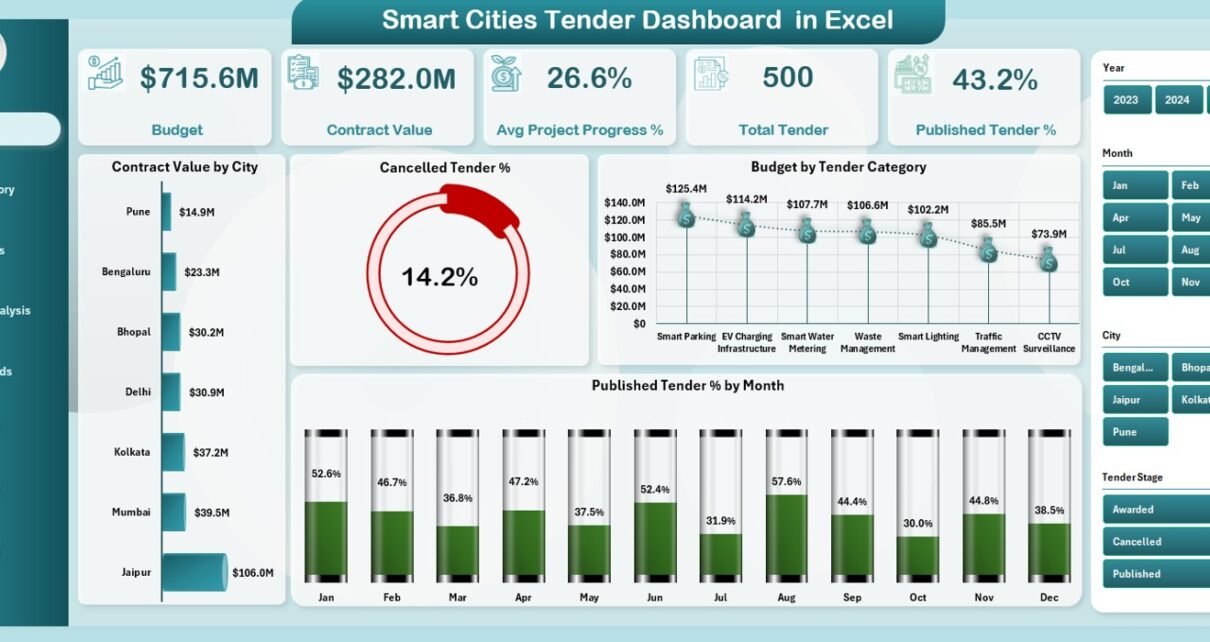
1. Overview Page – What Is the Overall Smart Cities Tender Status?
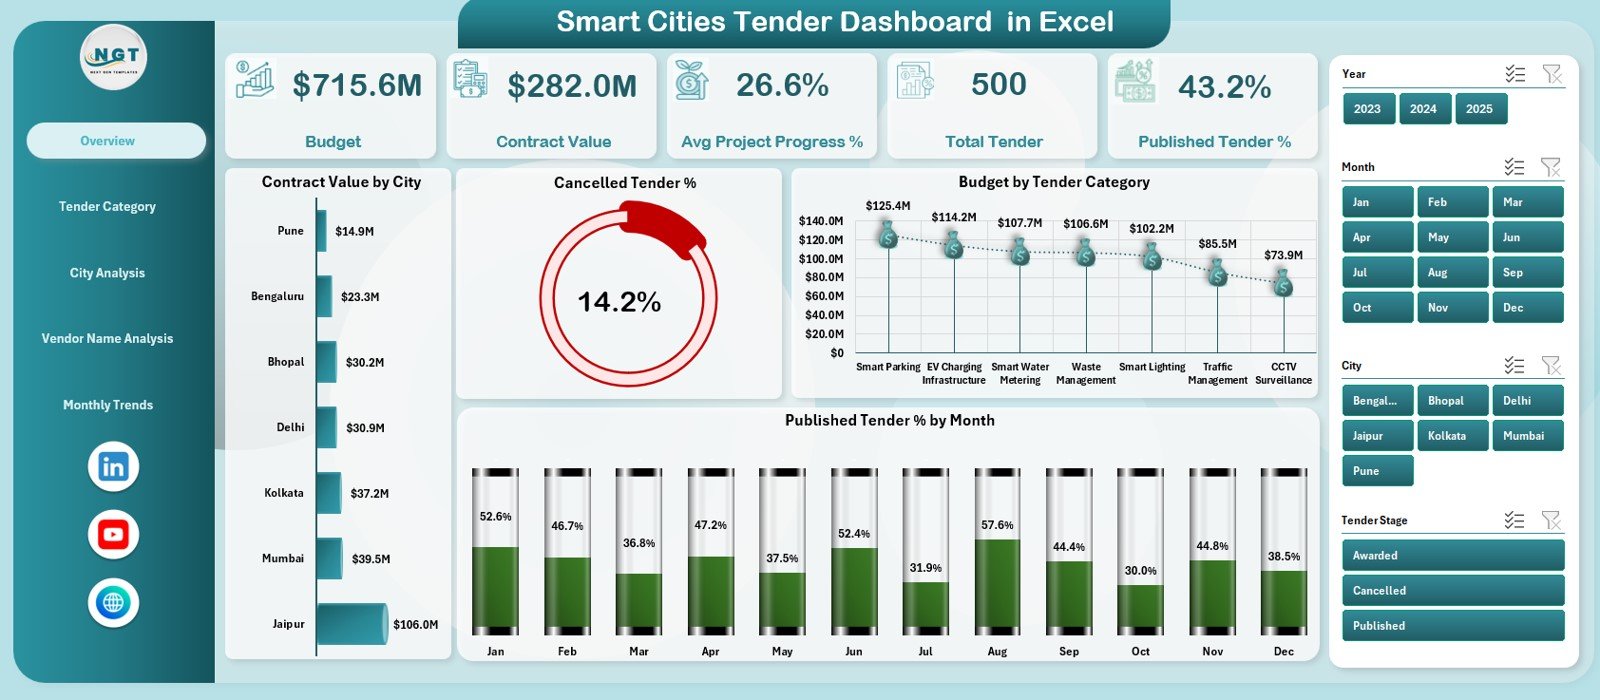
The Overview Page provides a high-level snapshot of smart city tender performance. It acts as the main control panel for decision-makers.
KPI Cards on the Overview Page
The Overview Page includes 5 KPI cards that summarize key tender metrics:
-
Budget – Shows total budget allocated for smart city tenders
-
Contract Value – Displays total value of awarded contracts
-
Average Project Progress % – Indicates average execution progress
-
Total Tenders – Shows total number of tenders
-
Published Tender % – Highlights publishing efficiency
These KPIs help leaders understand overall tender health at a glance.
Charts on the Overview Page
The Overview Page also includes 4 powerful charts:
-
Contract Value by City – Compares contract value across cities
-
Cancelled Tender % – Highlights cancellation rate
-
Budget by Tender Category – Shows budget allocation by category
-
Published Tender % by Month – Tracks monthly publishing trends
Together, these visuals provide instant clarity on performance and risks.
2. Tender Category Analysis – Which Categories Perform Better?
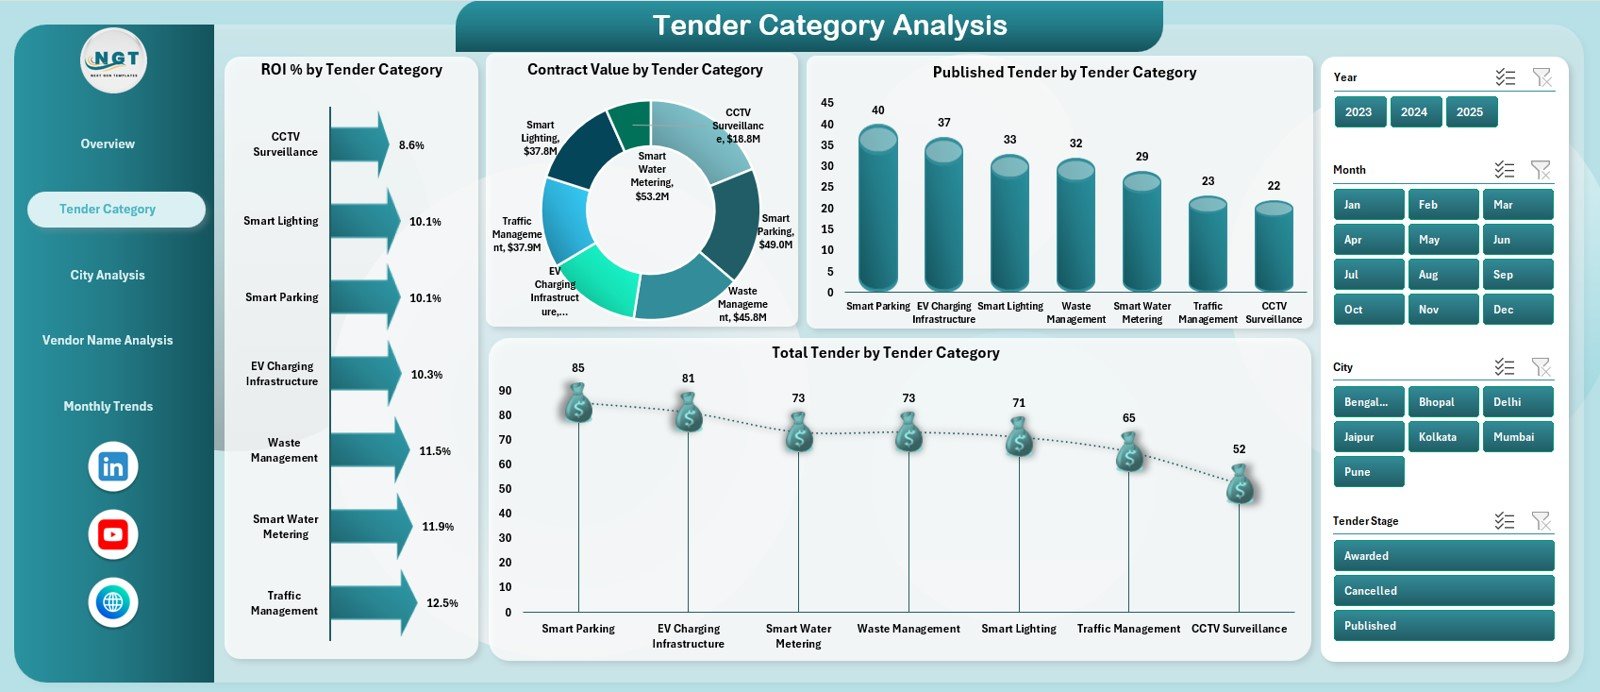
Smart city tenders span multiple categories such as transport, energy, IT, water, and public safety. Therefore, category-wise analysis becomes essential.
Key Charts on Tender Category Analysis Page
This page includes 4 detailed charts:
-
ROI % by Tender Category – Shows return performance by category
-
Contract Value by Tender Category – Compares awarded values
-
Published Tenders by Category – Tracks publishing volume
-
Total Tenders by Category – Highlights workload distribution
As a result, authorities can prioritize high-impact categories.
3. City Analysis – Which Cities Drive More Tenders and Budgets?
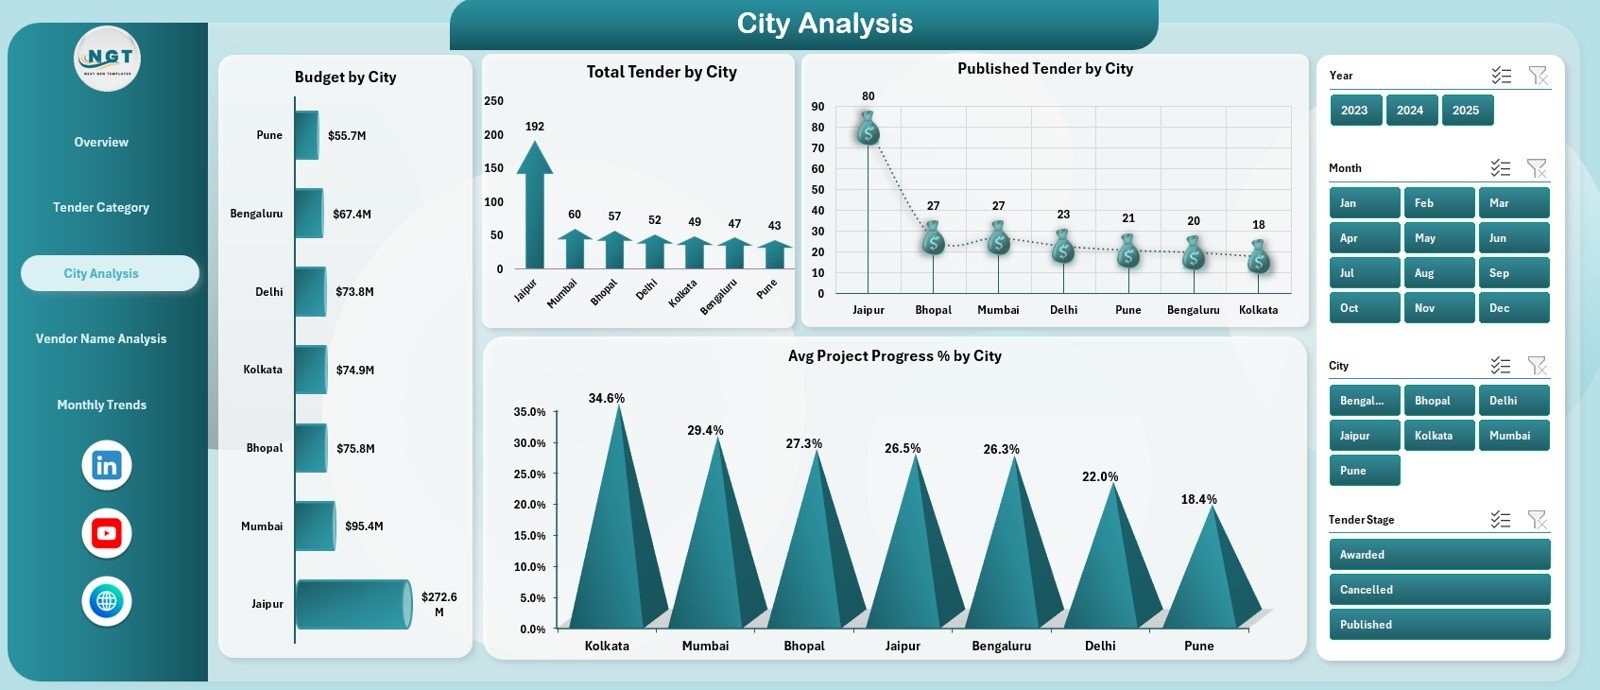
Smart city initiatives often span multiple cities. Therefore, understanding city-wise tender performance becomes critical.
Key Charts on City Analysis Page
This page includes 4 insightful charts:
-
Budget by City – Shows budget allocation across cities
-
Total Tenders by City – Compares tender volume
-
Published Tenders by City – Tracks publishing activity
-
Average Project Progress % by City – Highlights execution status
Because of this analysis, planners can identify underperforming cities early.
Click to Purchases Smart Cities Tender Dashboard in Excel
4. Vendor Name Analysis – Which Vendors Handle the Most Tenders?
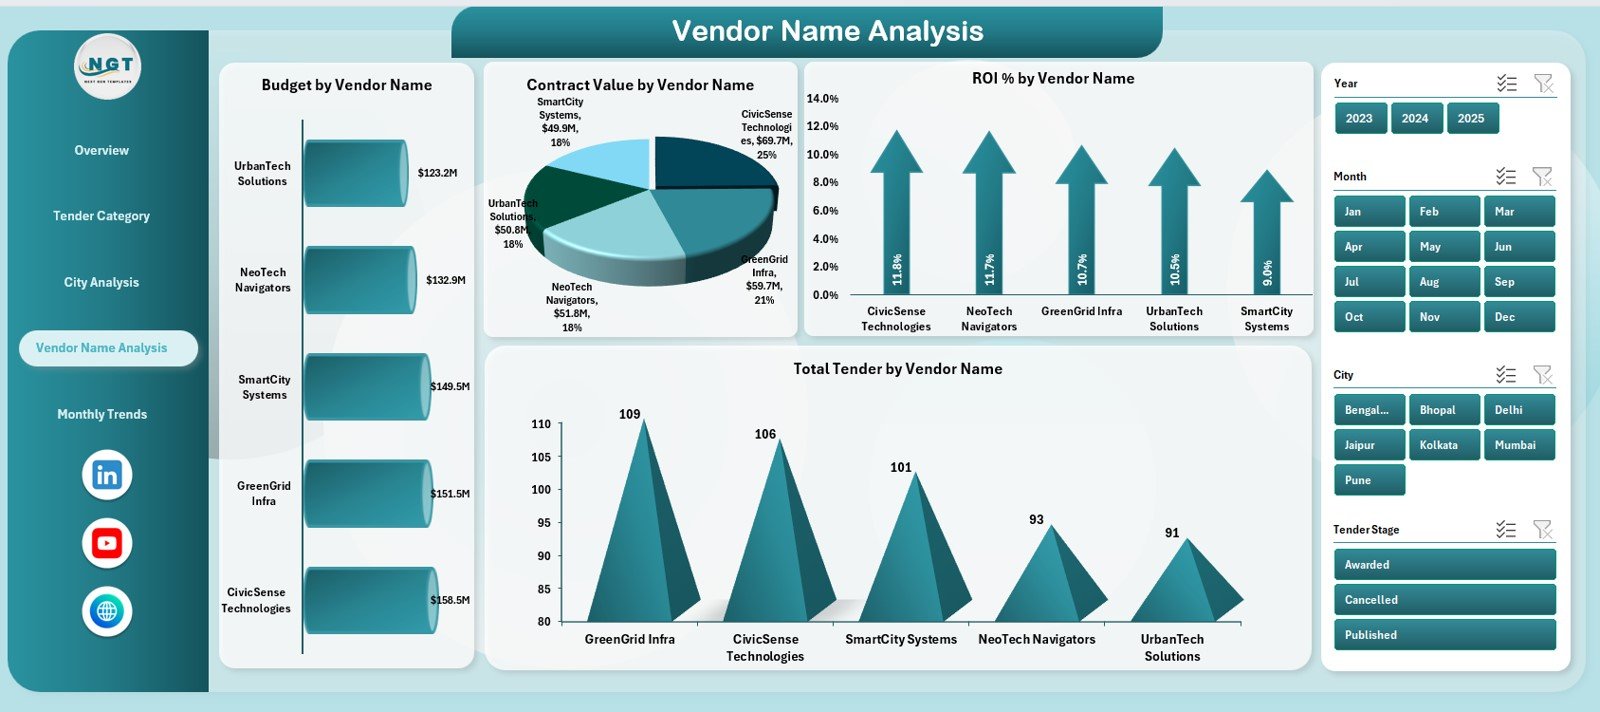
Vendor performance directly affects project execution. Therefore, vendor-wise analysis plays a key role.
Key Charts on Vendor Name Analysis Page
This page includes 4 powerful charts:
-
Budget by Vendor Name – Shows budget handled by each vendor
-
Contract Value by Vendor Name – Highlights awarded contract value
-
ROI % by Vendor Name – Compares vendor efficiency
-
Total Tenders by Vendor Name – Shows vendor workload
As a result, authorities can evaluate vendor reliability and performance.
5. Monthly Trends – How Do Smart City Tenders Change Over Time?
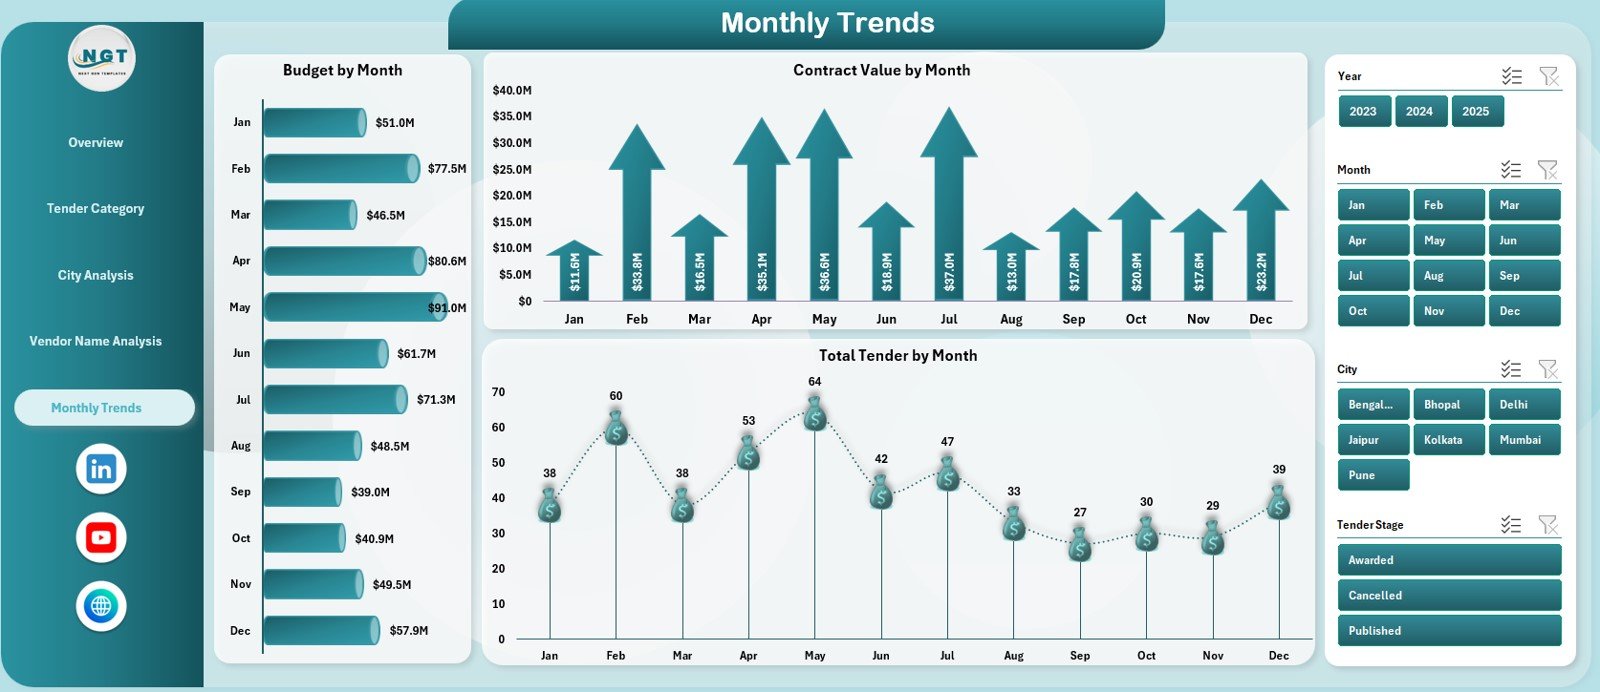
The Monthly Trends Page focuses on time-based analysis.
Key Charts on Monthly Trends Page
This page includes 3 trend charts:
-
Budget by Month – Tracks monthly budget allocation
-
Contract Value by Month – Shows awarding trends
-
Total Tenders by Month – Highlights tender volume changes
These trends support forecasting, planning, and workload balancing.
Support Sheet and Data Sheet – Foundation of the Dashboard
Behind the visuals lies a strong data structure.
-
Data Sheet stores raw tender information such as city, category, vendor, budget, contract value, progress, and status.
-
Support Sheet contains calculations, helper columns, and formulas that power charts and KPIs.
Because of this setup, the dashboard remains scalable and easy to maintain.
Advantages of Smart Cities Tender Dashboard in Excel
1. Centralized Tender Visibility
The dashboard consolidates all tender data into one structured file.
2. Improved Budget Control
Users can clearly track budgets and contract values.
3. Better Publishing and Progress Tracking
Publishing percentage and progress metrics improve transparency.
4. City-Wise Performance Monitoring
Authorities can quickly identify cities that need attention.
5. Vendor Performance Evaluation
Vendor-wise ROI and tender volume support better vendor selection.
6. Easy to Use and Cost-Effective
Because the dashboard runs in Excel, teams avoid expensive tools.
7. Data-Driven Decision Making
Visual insights enable faster and more confident decisions.
Best Practices for the Smart Cities Tender Dashboard in Excel
1. Keep Tender Data Clean and Updated
Always maintain accurate tender status and values.
2. Update the Dashboard Regularly
Update data monthly or whenever new tenders are published.
3. Standardize City and Vendor Names
Consistent naming improves reporting accuracy.
4. Monitor Cancelled Tenders Closely
Track cancellation percentage to identify process issues.
5. Use Category Insights for Planning
Allocate resources based on high-ROI categories.
6. Track Project Progress Actively
Monitor progress percentage to avoid delays.
7. Protect the Dashboard Structure
Secure formulas and layouts to prevent accidental changes.
Click to Purchases Smart Cities Tender Dashboard in Excel
Who Can Benefit from a Smart Cities Tender Dashboard in Excel?
This dashboard benefits multiple stakeholders, including:
-
Smart city authorities and planners
-
Government procurement teams
-
Project management offices
-
Finance and audit departments
-
Vendor management teams
-
Senior government officials
Conclusion – Why the Smart Cities Tender Dashboard in Excel Is Essential
Smart city projects demand transparency, accountability, and strong monitoring. Therefore, relying on manual tender tracking no longer works.
The Smart Cities Tender Dashboard in Excel provides a complete, visual, and easy-to-use solution. It centralizes tender data, improves budget control, tracks progress, and supports better decision-making.
If you want better visibility, efficiency, and control over smart city tenders, this dashboard becomes an essential tool.
Frequently Asked Questions (FAQs)
What is a Smart Cities Tender Dashboard in Excel?
It is an Excel-based dashboard that tracks budgets, tenders, contracts, vendors, cities, and progress for smart city projects.
Who should use this dashboard?
Smart city authorities, procurement teams, finance teams, and project managers benefit the most.
Can I customize the dashboard?
Yes, because it is built in Excel, you can customize charts and KPIs easily.
Does it support vendor performance analysis?
Yes, the Vendor Name Analysis page tracks budget, contract value, ROI, and tender volume.
Can this dashboard help with planning and forecasting?
Yes, monthly trends support workload planning and budget forecasting.
Do I need advanced Excel skills to use it?
No, basic Excel knowledge is sufficient.
Is this dashboard suitable for government projects?
Yes, it is ideal for government and public-sector smart city initiatives.
Click to Purchases Smart Cities Tender Dashboard in Excel
Visit our YouTube channel to learn step-by-step video tutorials