In today’s competitive business environment, strategic planning plays a central role in guiding organizations toward growth and sustainability. However, creating a plan is not enough. Companies must also measure, monitor, and analyze their strategic objectives to ensure they stay on track. This is where a Strategic Planning Dashboard in Power BI becomes an essential tool.
This article explores what a Strategic Planning Dashboard is, why it matters, its features, advantages, best practices, and how organizations can maximize its use for better results.
Click to Purchases Strategic Planning Dashboard in Power BI
What Is a Strategic Planning Dashboard in Power BI?
A Strategic Planning Dashboard is a business intelligence solution designed in Power BI to track and monitor organizational goals, initiatives, and performance. It consolidates data from multiple departments into a single, interactive platform. Instead of relying on scattered spreadsheets or static reports, decision-makers get real-time insights into progress, budget, and performance.
The dashboard helps:
-
Monitor progress against organizational goals.
-
Track KPIs (Key Performance Indicators) at different levels.
-
Visualize trends over time to identify strengths and weaknesses.
-
Align departmental initiatives with strategic objectives.
By using Power BI, organizations gain a dynamic, user-friendly, and customizable solution to evaluate strategy execution effectively.
Key Features of the Strategic Planning Dashboard
The Strategic Planning Dashboard in Power BI includes multiple pages that focus on different perspectives. Each page is designed with slicers, cards, and charts for clarity and interactivity. Below are the five major sections:
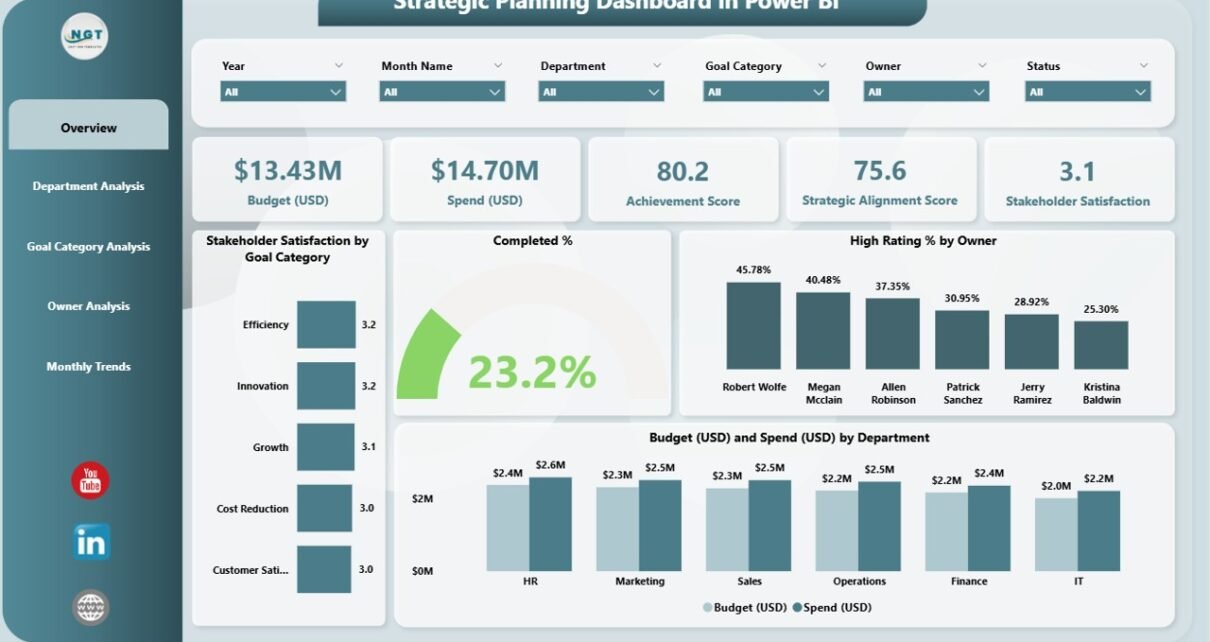
Overview Page
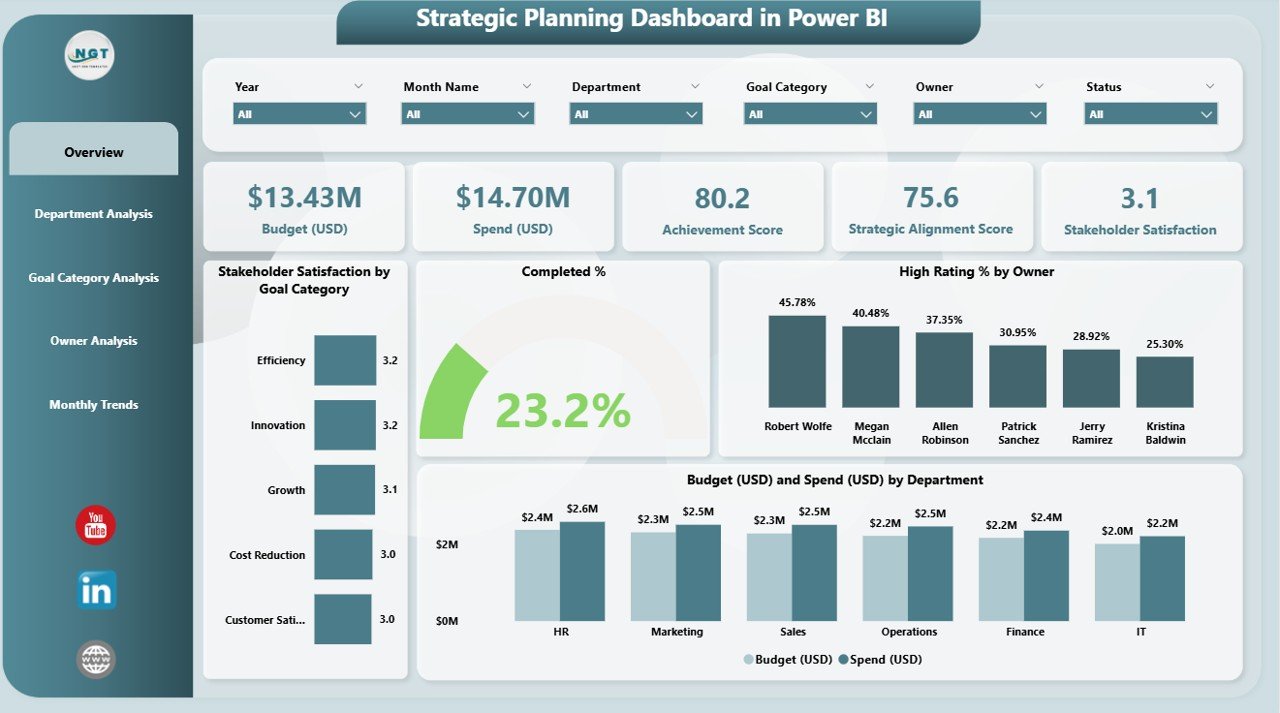
The Overview Page is the main landing page of the dashboard. It provides a quick snapshot of organizational performance.
-
Cards: 5 summary cards show top-level metrics such as completion rates, ratings, and financial data.
Charts: Four key visualizations highlight:
- Stakeholder Satisfaction by Goal Category
- Completed %
- High Rating % by Owner
- Budget vs. Spend by Department
This page helps leaders understand overall progress without diving into detailed analysis.
Click to Purchases Strategic Planning Dashboard in Power BI
Department Analysis Page
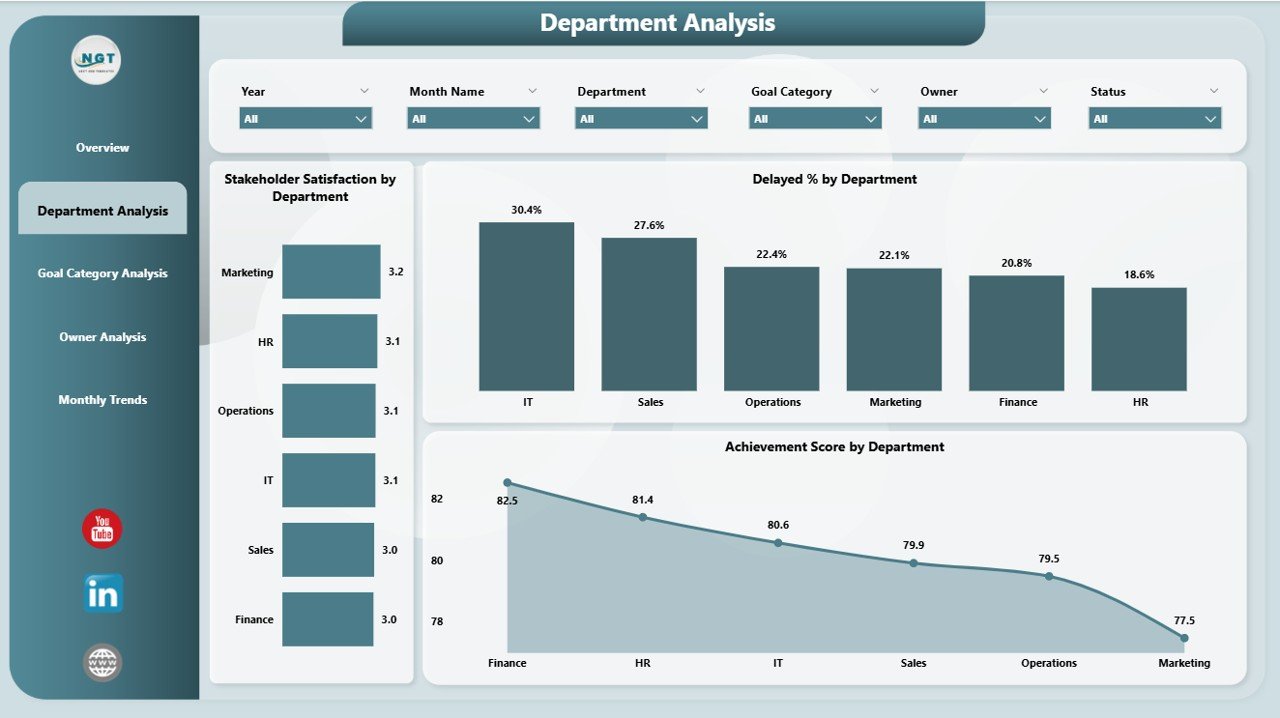
The Department Analysis Page gives a departmental breakdown of performance.
Charts include:
- Stakeholder Satisfaction by Department
- Delayed % by Department
- Achievement Score by Department
This view helps identify strong and weak departments, enabling better resource allocation.
Goal Category Analysis Page
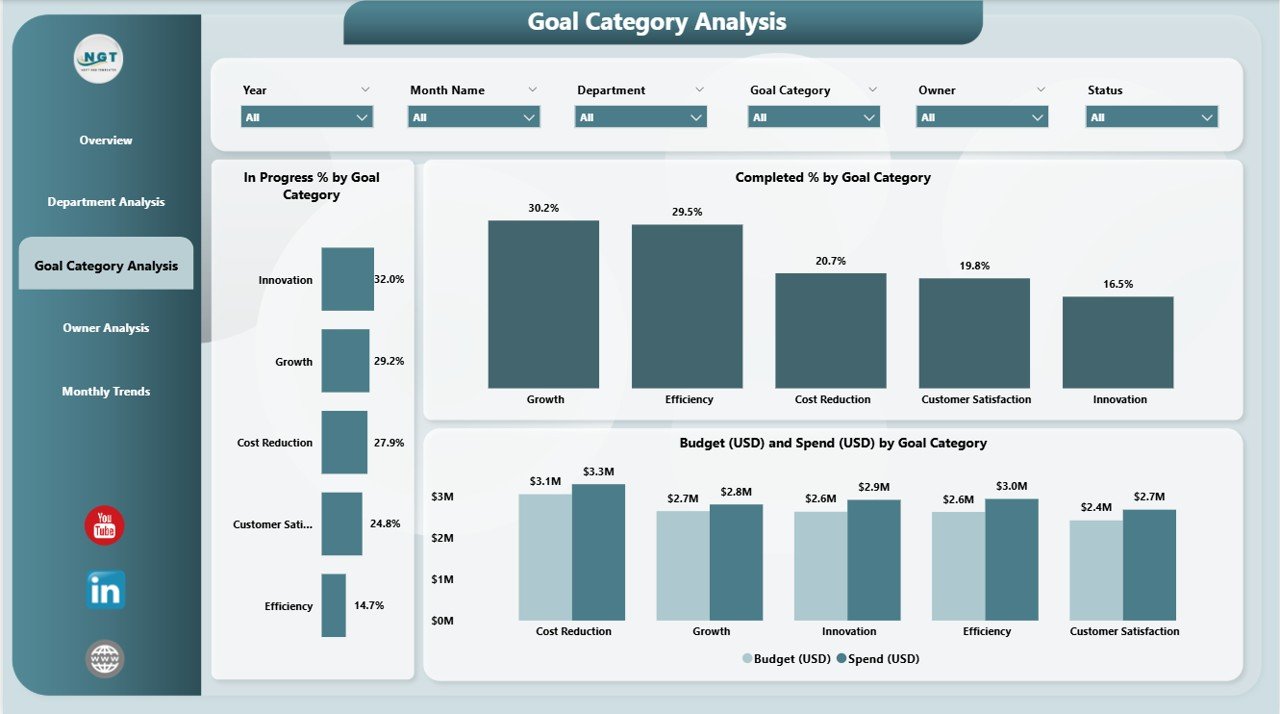
The Goal Category Analysis Page focuses on progress within different goal categories.
Charts include:
- In Progress % by Goal Category
- Completed % by Goal Category
- Budget vs. Spend by Category
This analysis is essential for checking whether organizational goals are on track and whether financial resources are being used efficiently.
Owner Analysis Page
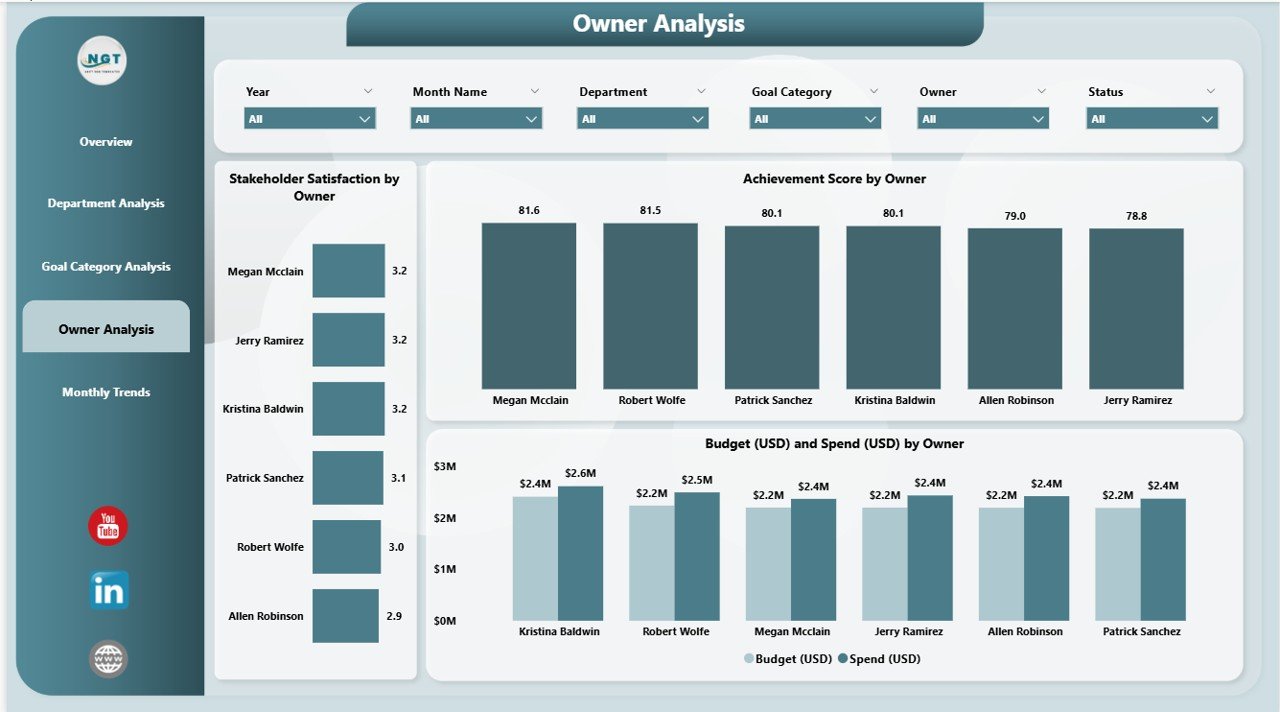
The Owner Analysis Page evaluates performance by goal owner or responsible person.
Charts include:
- Stakeholder Satisfaction by Owner
- Achievement Score by Owner
- Budget vs. Spend by Owner
This view provides accountability and highlights high-performing individuals. It also reveals owners who may need more support to achieve goals.
Monthly Trends Page
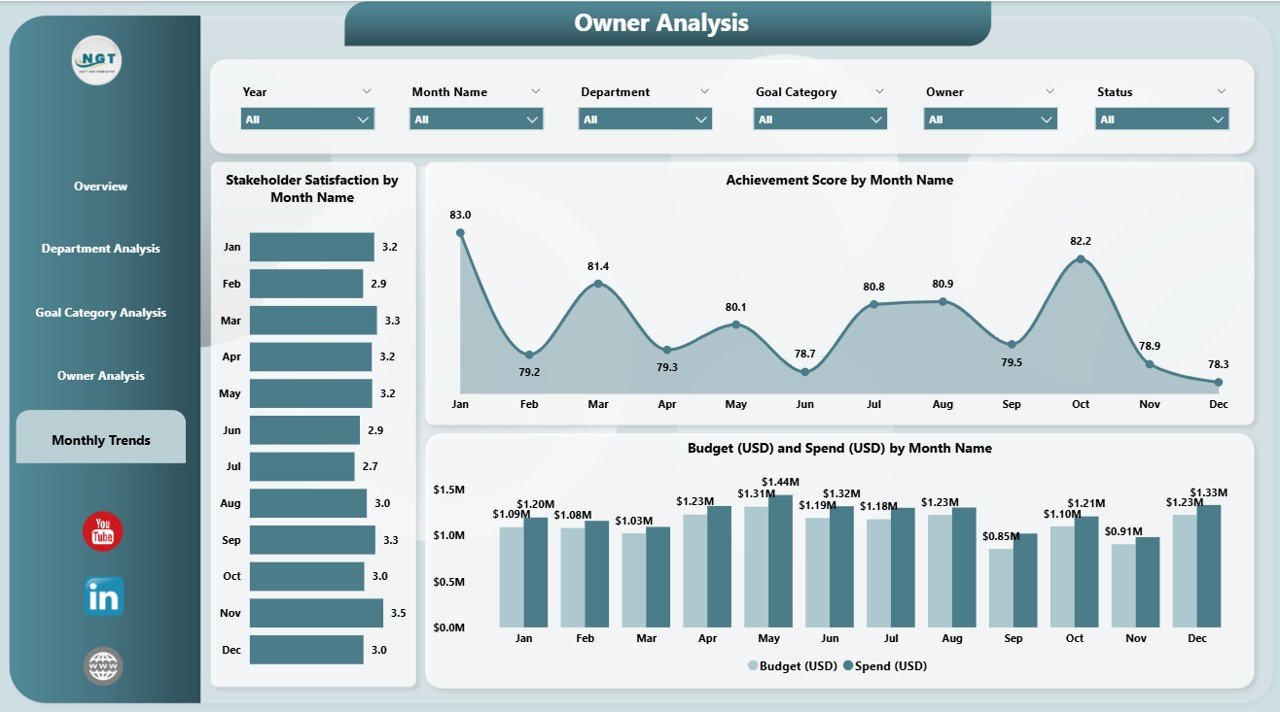
The Monthly Trends Page tracks progress and satisfaction over time.
Charts include:
- Stakeholder Satisfaction by Month
- Achievement Score by Month
- Budget vs. Spend by Month
By reviewing monthly data, organizations can identify patterns, seasonal fluctuations, and long-term trends.
Why Do Businesses Need a Strategic Planning Dashboard?
Organizations face constant pressure to align strategy with execution. Without proper monitoring, goals often remain aspirational rather than achievable. A Strategic Planning Dashboard in Power BI ensures:
-
Real-time insights instead of outdated reports.
-
Centralized data that removes silos.
-
Better accountability for owners and departments.
-
Efficient budget tracking to avoid overspending.
-
Data-driven decisions instead of guesswork.
Ultimately, it helps leaders ensure that strategic objectives are not just documented but actively achieved.
Advantages of a Strategic Planning Dashboard in Power BI
Using Power BI for strategic planning provides organizations with multiple advantages:
✅ Centralized Monitoring: All goals, KPIs, and financials in one platform.
✅ Interactivity: Slicers and filters make analysis quick and simple.
✅ Real-time Data: Automatically updates from Excel or other sources.
✅ Custom Visualization: Charts and cards simplify complex data.
✅ Performance Accountability: Tracks progress by department, owner, and goal category.
✅ Budget vs. Spend Analysis: Ensures funds are allocated wisely.
✅ Trend Analysis: Identifies growth patterns and problem areas early.
Best Practices for the Strategic Planning Dashboard
To maximize the value of a Strategic Planning Dashboard in Power BI, organizations should follow best practices:
-
Define Clear KPIs: Choose measurable and meaningful indicators aligned with strategic goals.
-
Maintain Data Accuracy: Ensure source data is clean, updated, and consistent.
-
Use Interactive Filters: Add slicers for departments, goals, and timelines for deeper analysis.
-
Design for Simplicity: Avoid clutter; focus on visuals that drive decisions.
-
Incorporate Financials: Always connect goals to budget and spending.
-
Review Regularly: Hold monthly or quarterly review sessions using the dashboard.
-
Encourage Ownership: Assign goals to responsible individuals and track accountability.
-
Leverage Automation: Automate data refreshes to avoid manual updates.
Opportunities for Improvement
Even though dashboards are powerful, organizations can continuously refine them. Some improvement opportunities include:
-
Enhanced Data Sources: Integrating data from ERP, CRM, or HR systems.
-
Mobile Optimization: Making dashboards mobile-friendly for field managers.
-
AI-Powered Insights: Using predictive analytics to forecast goal achievement.
-
Collaboration Tools: Embedding dashboards in Microsoft Teams for shared visibility.
-
Customization: Allowing stakeholders to build personalized views.
Click to Purchases Strategic Planning Dashboard in Power BI
How Can Different Stakeholders Use the Dashboard?
A Strategic Planning Dashboard in Power BI is not just for executives. It benefits multiple stakeholders:
-
Executives: Monitor organizational progress and allocate resources effectively.
-
Department Heads: Track performance at the departmental level.
-
Project Managers: Align project deliverables with strategic goals.
-
Finance Teams: Compare budgets with spending to maintain financial discipline.
-
Employees: Understand how their work contributes to broader organizational objectives.
Steps to Build a Strategic Planning Dashboard in Power BI
If you want to create your own version of this dashboard, follow these steps:
-
Collect Data: Gather data from Excel, ERP, or project management tools.
-
Define KPIs: Identify strategic goals and measurable indicators.
-
Import Data into Power BI: Connect Excel or other sources to Power BI.
-
Build Pages: Create different pages for overview, department, category, owner, and monthly analysis.
-
Add Visuals: Use cards, bar charts, line charts, and pie charts as needed.
-
Set Up Slicers: Add filters for month, department, owner, or category.
-
Format Dashboard: Apply consistent colors, labels, and titles.
-
Publish and Share: Publish the dashboard in Power BI Service and share it with stakeholders.
-
Schedule Data Refresh: Automate updates to keep data current.
-
Review and Refine: Continuously improve the dashboard with stakeholder feedback.
Conclusion
A Strategic Planning Dashboard in Power BI is more than just a reporting tool. It is a powerful solution that aligns organizational goals, monitors progress, and ensures accountability. By combining data from multiple sources into a clear and interactive format, it helps leaders make informed decisions, optimize budgets, and drive strategic success.
Organizations that adopt such dashboards position themselves for agility, efficiency, and long-term growth.
Frequently Asked Questions (FAQs)
1. What is a Strategic Planning Dashboard?
It is a Power BI dashboard that tracks organizational goals, performance, and budgets in real time.
2. How does it help in business growth?
It aligns strategy with execution, ensures accountability, and provides actionable insights for better decision-making.
3. Can small businesses use this dashboard?
Yes. Small and medium-sized businesses can use it to track goals, monitor spending, and improve performance visibility.
4. What kind of data sources can be connected?
Excel, ERP, CRM, HR systems, and other project management tools can be connected to Power BI.
5. How often should the dashboard be updated?
Ideally, the dashboard should update automatically with scheduled refreshes, but at minimum, it should be reviewed monthly.
6. What KPIs are commonly tracked?
Common KPIs include completion %, achievement score, stakeholder satisfaction, delayed %, and budget vs. spend.
7. Is training required to use it?
Basic Power BI knowledge is helpful, but the dashboard is user-friendly, so most stakeholders can navigate it easily.
Visit our YouTube channel to learn step-by-step video tutorials