In the fast-moving world of supply chain and logistics, financial clarity is no longer optional—it’s essential. From tracking transportation costs to measuring inventory turnover, businesses need real-time, visual insights to make smart decisions. That’s where the Supply Chain and Logistics Financial Health KPI Dashboard in Excel comes in.
This dynamic Excel-based dashboard template helps you monitor key performance indicators (KPIs), compare actual performance against targets, and gain full visibility into financial health—all without complex software or coding.
Let’s dive into everything you need to know about this ready-to-use solution, including its features, benefits, best practices, and frequently asked questions.
Click to Purchases Supply Chain and Logistics Financial Health KPI Dashboard in Excel
What Is a Supply Chain and Logistics Financial Health KPI Dashboard in Excel?
A Supply Chain and Logistics Financial Health KPI Dashboard in Excel is a powerful data visualization tool that tracks and analyzes critical financial metrics related to logistics and supply chain performance. Built inside a familiar Excel interface, it allows users to monitor KPIs such as freight cost per unit, inventory holding cost, delivery cost, and more—month-over-month and year-to-date.
It brings together data from multiple sources and presents it in an interactive format using charts, slicers, dropdowns, and conditional formatting for instant decision-making.
Overview of the Dashboard Structure
This Excel dashboard consists of 7 powerful worksheets, each with a unique purpose:
Home Sheet
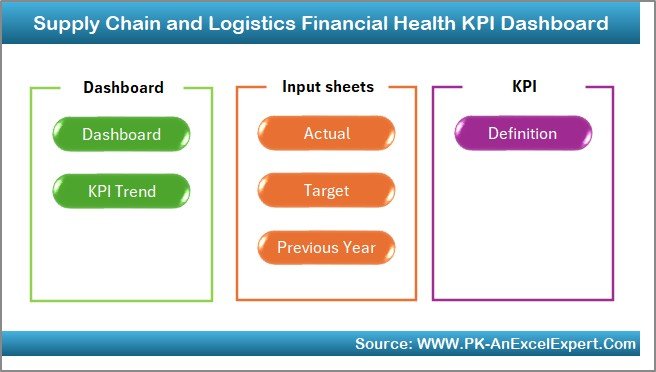
The Home Sheet acts as the dashboard’s navigation panel. It includes 6 interactive buttons that take you directly to each worksheet, saving time and enhancing user experience.
Dashboard Sheet Tab
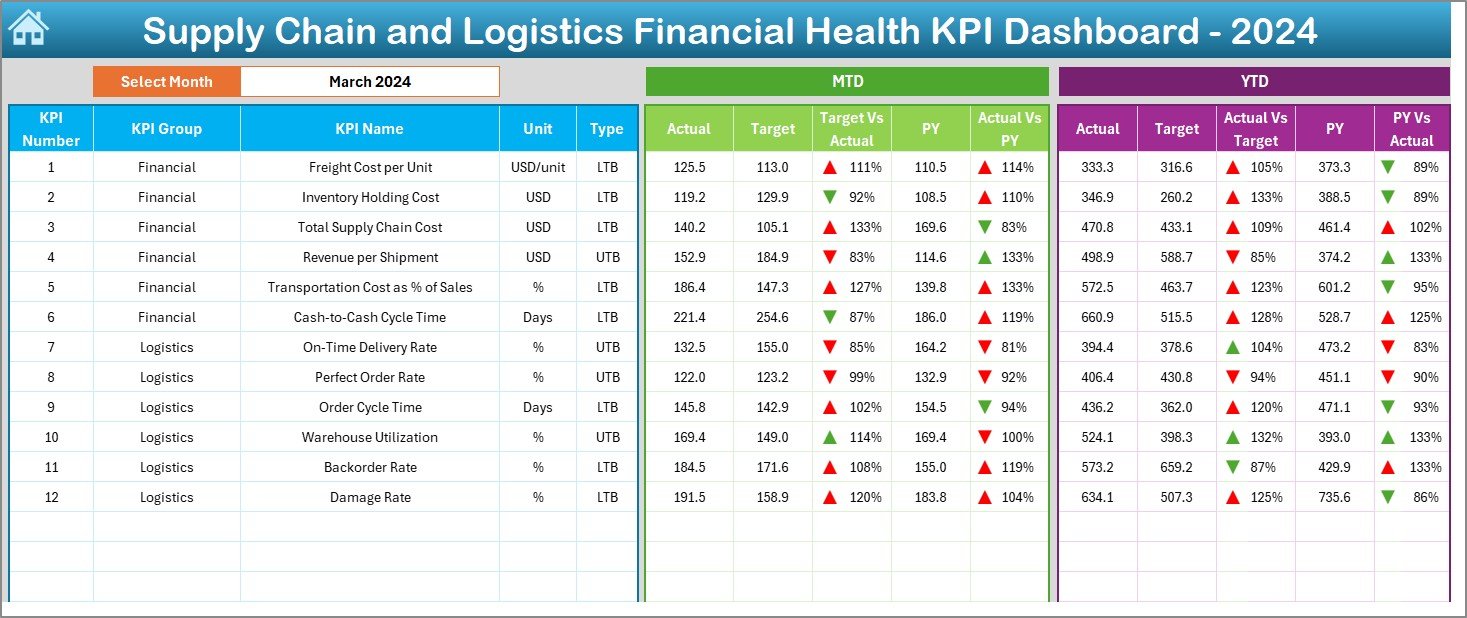
This is the main visualization sheet, where you can:
-
Select the desired Month using the dropdown in cell
D3.
View MTD (Month-to-Date) and YTD (Year-to-Date) metrics for:
- Actual performance
- Target values
- Previous year figures
Visual cues like conditional formatting arrows (up/down) help you quickly identify:
-
Whether you’re meeting or missing your targets
-
Performance versus previous year (PY)
This sheet updates dynamically based on the month you select—giving you real-time financial insights.
KPI Trend Sheet Tab
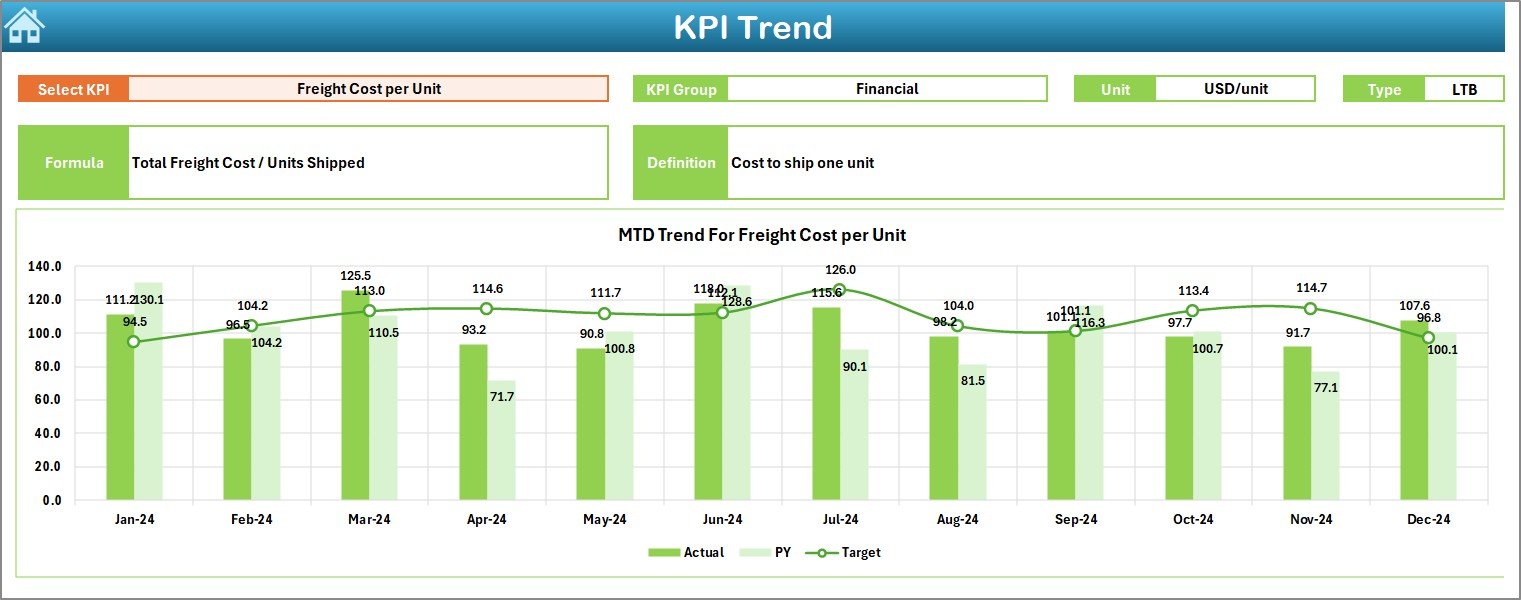
Want to deep dive into a specific KPI? This sheet lets you:
-
Select any KPI Name from a dropdown.
View important details such as:
- KPI Group
- Unit
- KPI Type (UTB: Upper the Better or LTB: Lower the Better)
- Formula and Definition
The sheet also displays MTD and YTD trend charts for that KPI to help visualize its trajectory.
Click to Purchases Supply Chain and Logistics Financial Health KPI Dashboard in Excel
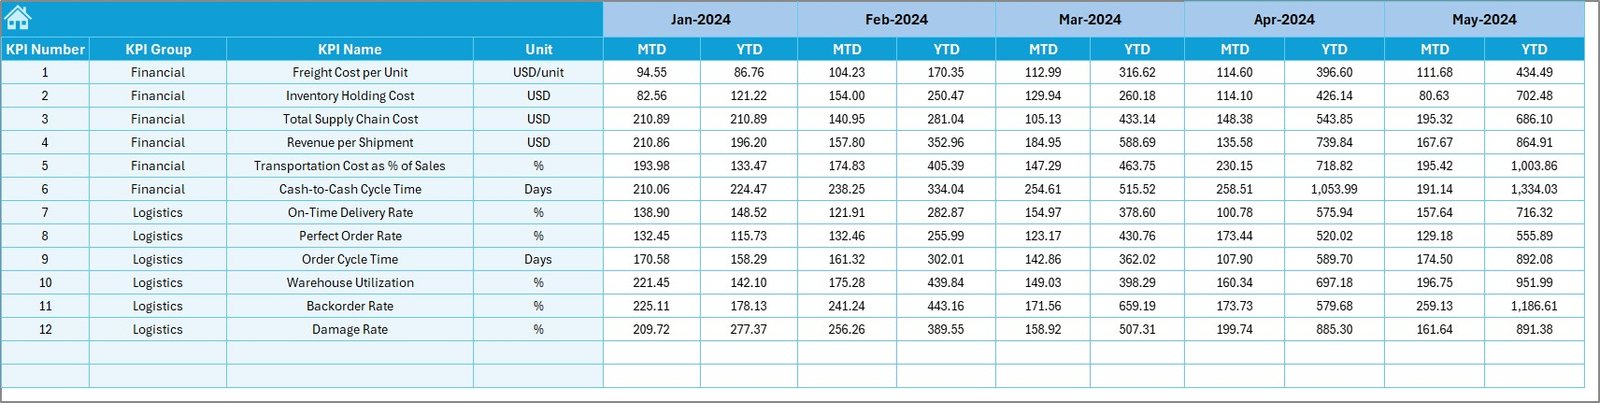
Actual Numbers Input Sheet
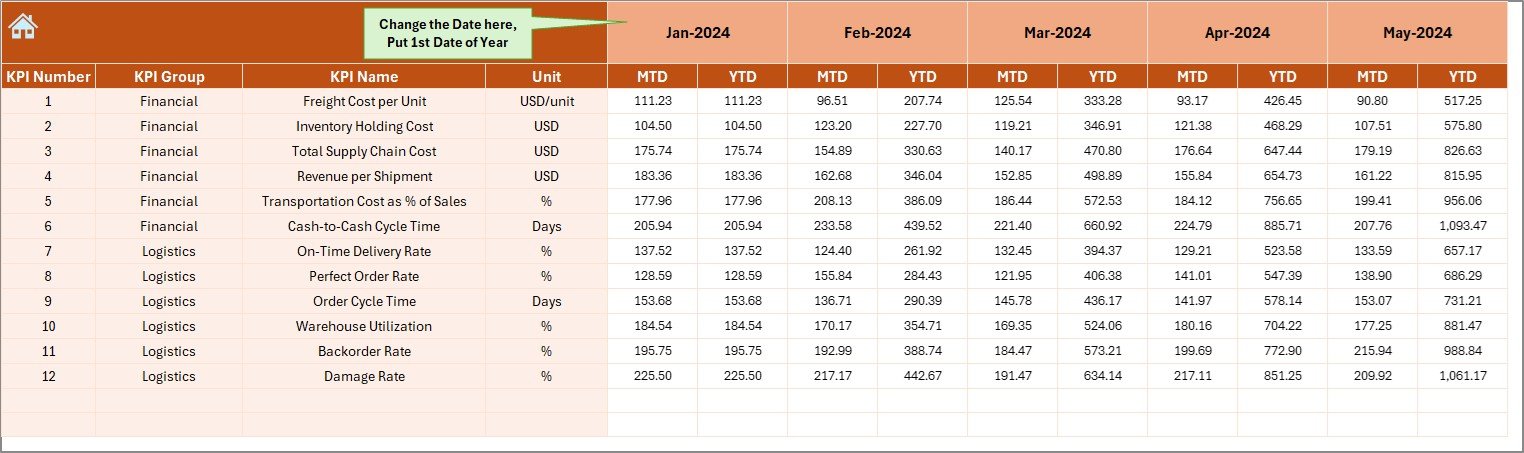
Here’s where data entry becomes smart and streamlined:
-
Enter monthly Actual values for MTD and YTD
-
Set the first month of the year using cell
E1to align timelines automatically
Target Sheet Tab
Input your MTD and YTD target values for each KPI by month. This sheet powers the comparison visuals in the Dashboard tab.
Previous Year Number Sheet
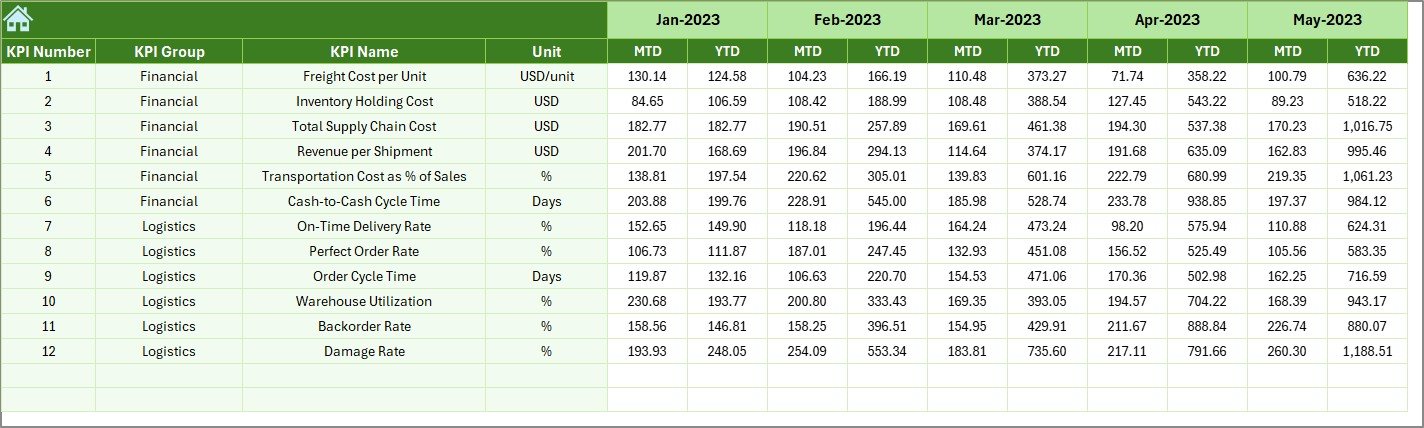
Maintain historical perspective by entering Previous Year actuals, again using the same format as the current year.
KPI Definition Sheet
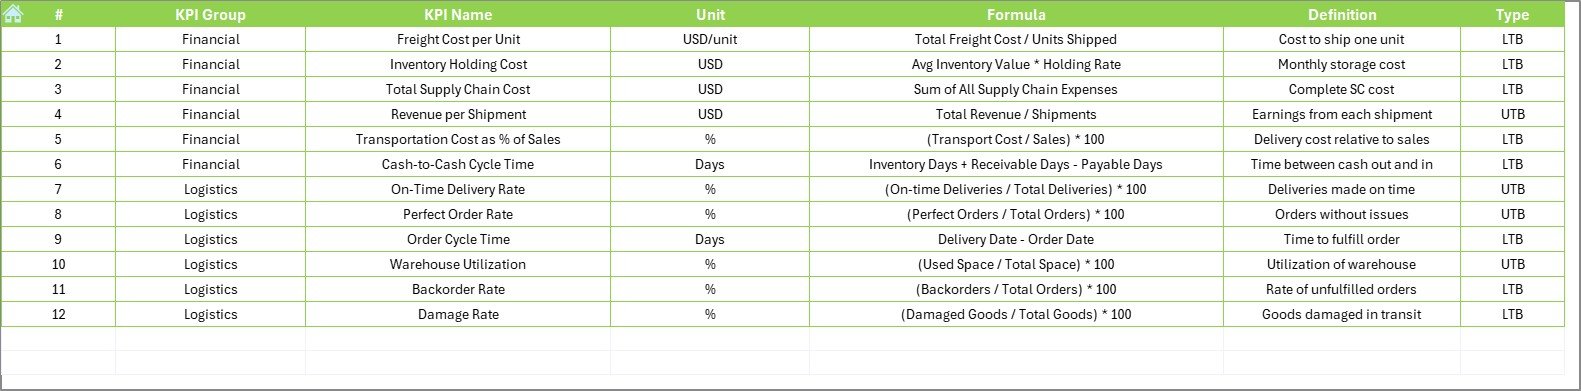
Keep your KPIs well-documented with fields for:
-
KPI Name
-
KPI Group
-
Unit
-
Formula
-
Definition
This sheet serves as the reference point for the entire dashboard.
Advantages of Using This Dashboard
Using the Supply Chain and Logistics Financial Health KPI Dashboard in Excel offers several business-critical benefits:
📌 Real-Time Visibility
Instantly see how your logistics operation is performing—month by month or year-to-date—without toggling between multiple reports.
📌 Target vs Actual Tracking
Get a clear picture of how your current performance stacks up against your goals.
📌 Informed Decision Making
Charts, arrows, and trend visuals empower your team to spot issues early and take timely action.
📌 Easy Customization
Since it’s built in Excel, anyone with basic Excel knowledge can customize KPIs, formulas, or visuals.
📌 Cost-Effective
No need to invest in expensive software. This dashboard provides premium functionality at zero recurring cost.
Most Useful KPIs to Track in Supply Chain & Logistics Financial Health
Here are examples of top KPIs you can track in this dashboard:
-
Freight Cost per Unit
-
Total Delivery Cost
-
Inventory Holding Cost
-
Cost per Order
-
Warehouse Utilization Rate
-
On-Time Shipment Rate
-
Order Accuracy Rate
-
Return Processing Cost
-
Logistics Cost as % of Sales
-
Transportation Spend per Region
Each KPI can be configured as either UTB (Upper the Better) or LTB (Lower the Better) depending on business goals.
Best Practices for Using the KPI Dashboard
To get the most value out of your Supply Chain and Logistics Financial KPI Dashboard, follow these best practices:
✔️ Set Clear KPI Definitions
Make sure every KPI is clearly defined in the KPI Definition Sheet. Avoid ambiguous terms.
✔️ Keep Data Updated Monthly
Regular updates to Actual, Target, and Previous Year numbers ensure your dashboard reflects real-time performance.
✔️ Use Conditional Formatting Wisely
The dashboard uses up/down arrows to signal progress. Stick to this format—it quickly communicates what’s working and what needs attention.
✔️ Focus on Trends, Not Just Numbers
Trends often reveal insights that static numbers can’t. Use the KPI Trend Sheet to spot recurring issues or areas of improvement.
✔️ Align KPIs With Business Goals
Don’t track every metric—only track what directly supports strategic goals like cost reduction, speed improvement, or customer satisfaction.
Why Excel Is the Perfect Tool for Logistics KPI Tracking
You might wonder: Why use Excel when there are ERP and BI tools?
Here’s why Excel still rules:
-
Universally Used: Everyone knows Excel. No special training required.
-
Fully Customizable: Add new KPIs, charts, or formulas anytime.
-
Offline Capability: No internet? No problem.
-
Easy Integration: Import/export data from multiple sources.
For startups, SMEs, and logistics professionals, Excel delivers a powerful mix of flexibility, functionality, and familiarity.
How to Customize the Dashboard for Your Business
Click to Purchases Supply Chain and Logistics Financial Health KPI Dashboard in Excel
Let’s say your business wants to focus more on warehouse performance. Here’s how you can tailor the dashboard:
Add new KPIs like:
- Average Warehouse Pick Time
- Inventory Turnover Ratio
-
Update the Target Sheet with new monthly goals.
-
Enter your actuals in the Actual Numbers Input Sheet.
-
Define the KPIs in the KPI Definition Sheet.
-
Done! The Dashboard and KPI Trend charts will update automatically.
Real-Life Use Case: Reducing Transportation Costs
A logistics company used this dashboard to track Freight Cost per Unit. By comparing Actual vs Target values over several months, they spotted a spike in fuel surcharge expenses.
They adjusted routing strategies and re-negotiated contracts with carriers. Within three months, they reduced freight costs by 12% and improved margins—all tracked through the dashboard.
Conclusion: A Smarter Way to Track Financial Health
In a supply chain environment, what gets measured gets managed. This Excel-based KPI dashboard is more than a tracking tool—it’s your financial control center. Whether you want to reduce costs, boost efficiency, or align teams with strategic targets, this dashboard helps you do it all in one place.
Frequently Asked Questions (FAQs)
Q1. How do I install or use this KPI Dashboard?
No installation required. Simply open the Excel file and start entering your actual, target, and previous year numbers.
Q2. Can I add more KPIs to the dashboard?
Yes! You can easily expand the KPI list by editing the KPI Definition, Target, and Actual Numbers Input sheets.
Q3. What is the difference between UTB and LTB KPIs?
-
UTB (Upper the Better): Higher values are better (e.g., On-Time Delivery Rate).
-
LTB (Lower the Better): Lower values are better (e.g., Freight Cost per Unit).
Q4. Is this suitable for non-financial teams?
Absolutely. Even operations or warehouse teams can use this dashboard with basic Excel knowledge.
Q5. Can I track weekly performance too?
This version focuses on MTD and YTD. However, you can adapt it to include weekly data by modifying the sheet layout and formulas.
Q6. Does this template work in Google Sheets?
Some formulas and slicers may not work the same way. It is optimized for Excel 2013 or later.
Q7. What kind of businesses can use this dashboard?
This dashboard is ideal for:
-
Logistics companies
-
E-commerce brands
-
Retailers
-
Wholesalers
-
Any business managing supply chains
Click to Purchases Supply Chain and Logistics Financial Health KPI Dashboard in Excel
Visit our YouTube channel to learn step-by-step video tutorials