Modern manufacturing industries operate in a highly competitive and data-driven environment. Synthetic fiber manufacturers must continuously monitor production efficiency, quality performance, operational costs, and delivery timelines. However, many organizations still depend on scattered spreadsheets and manual reporting methods. As a result, managers struggle to identify performance gaps and make timely decisions.
Therefore, businesses increasingly adopt structured KPI dashboards to transform raw operational data into meaningful insights. One powerful solution is the Synthetic Fibers KPI Dashboard in Excel — a ready-to-use performance monitoring tool designed specifically for synthetic fiber manufacturing operations.
In this comprehensive guide, you will learn everything about the Synthetic Fibers KPI Dashboard in Excel, including its structure, features, benefits, implementation approach, best practices, and frequently asked questions.
Click to Purchases Synthetic Fibers KPI Dashboard in Excel
What Is a Synthetic Fibers KPI Dashboard in Excel?
A Synthetic Fibers KPI Dashboard in Excel is a structured performance monitoring system that tracks manufacturing KPIs using automated calculations, visual indicators, and trend analysis.
Instead of reviewing multiple reports separately, production managers can analyze all important KPIs from one centralized dashboard. Consequently, decision-makers gain instant visibility into operational performance and take corrective actions faster.
Moreover, Excel provides flexibility, automation, and ease of use. Therefore, organizations can implement this dashboard without investing in expensive software.
Why Do Synthetic Fiber Manufacturers Need a KPI Dashboard?
Synthetic fiber production involves multiple stages such as polymerization, spinning, drawing, finishing, and packaging. Each stage generates valuable performance data. However, without proper tracking, companies fail to use this data effectively.
A KPI dashboard solves this problem because it:
-
Centralizes performance monitoring
-
Tracks operational efficiency
-
Improves production planning
-
Supports data-driven decision-making
-
Identifies performance deviations early
As a result, organizations improve productivity while reducing operational risks.
Click to Purchases Synthetic Fibers KPI Dashboard in Excel
Key Features of the Synthetic Fibers KPI Dashboard in Excel
This ready-to-use dashboard includes 7 structured worksheets, each designed for a specific purpose. Together, they create a complete KPI management system.
1️⃣ Home Sheet – Smart Navigation Center
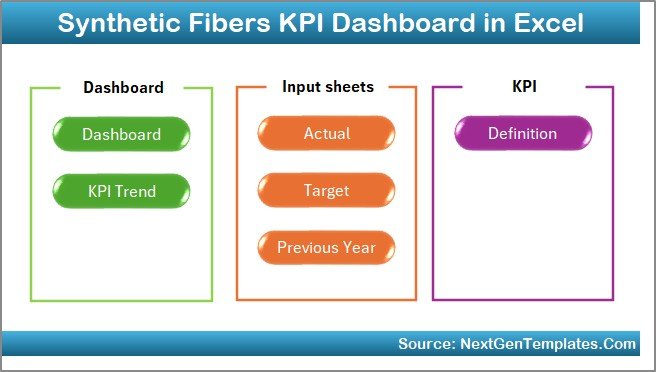
The Home Sheet works as an index page of the dashboard.
Key Highlights:
-
Contains 6 navigation buttons
-
Enables quick sheet access
-
Improves user experience
-
Reduces navigation time
Because users can jump directly to required sections, they save time and maintain workflow efficiency.
Click to Purchases Synthetic Fibers KPI Dashboard in Excel
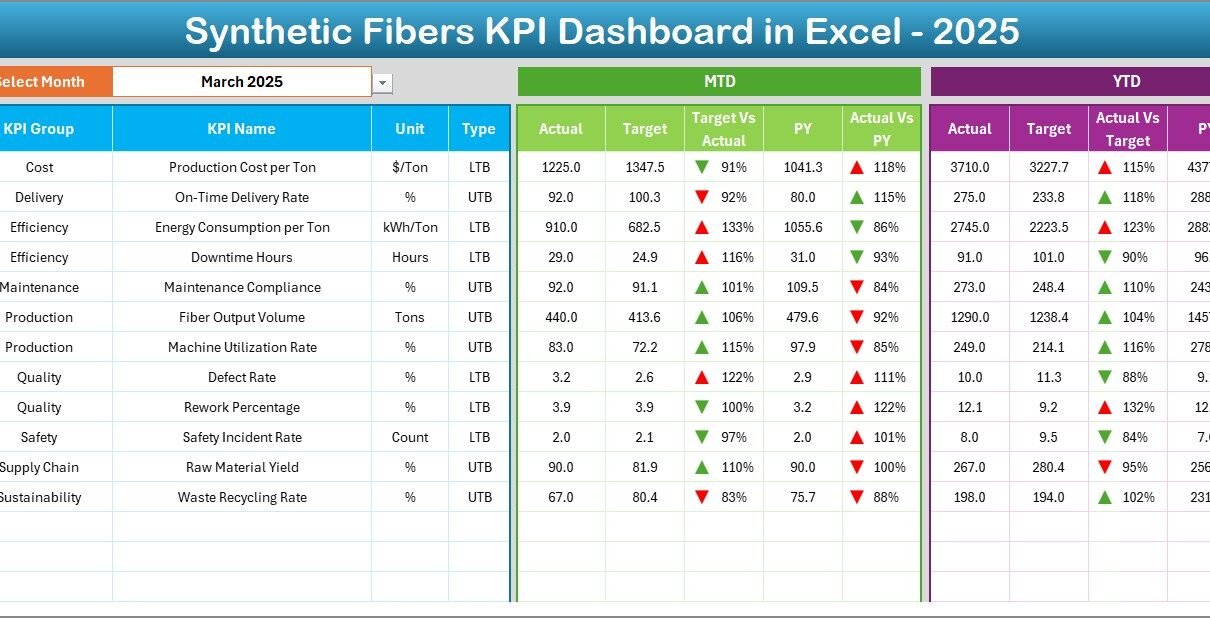
2️⃣ Dashboard Sheet – Main Performance Overview
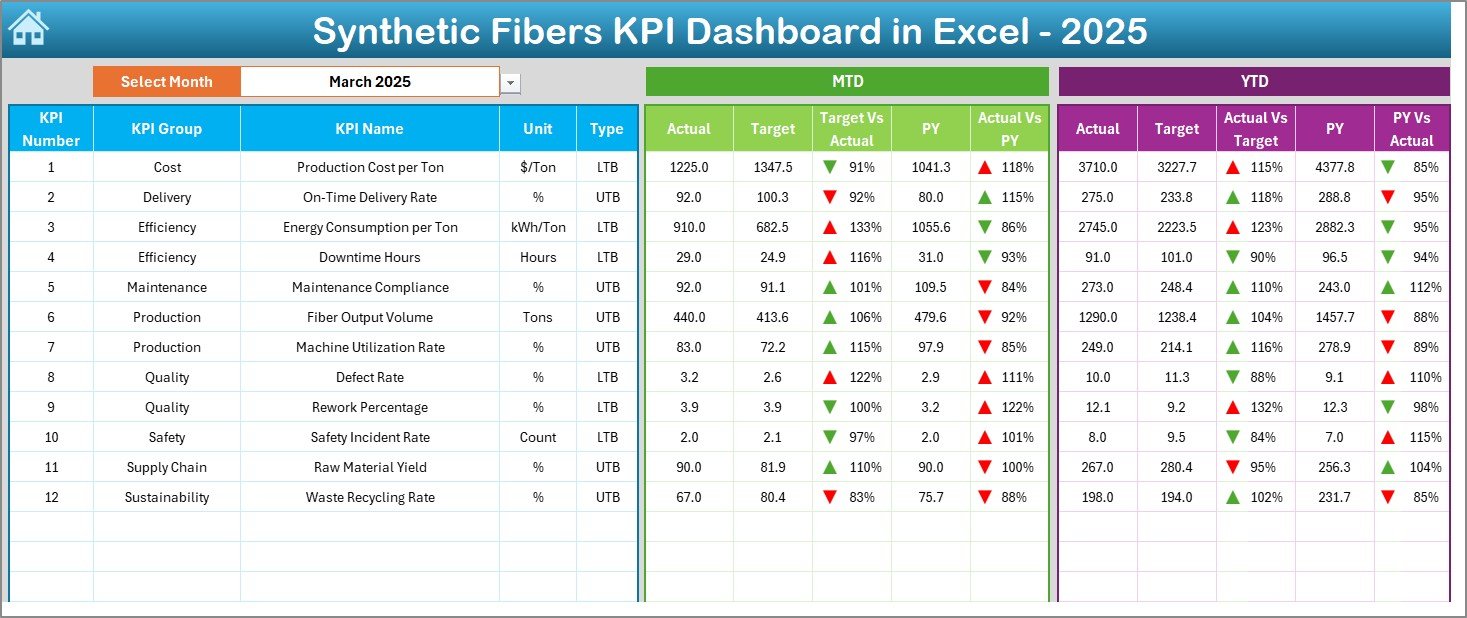
The Dashboard Sheet acts as the core of the entire system.
Here, users can view complete KPI performance in one place.
Key Functionalities
-
Month selection dropdown available in cell D3
-
Dashboard updates automatically based on selected month
-
Displays MTD and YTD performance
-
Shows Target vs Actual comparison
-
Displays Previous Year vs Actual comparison
Performance Metrics Displayed
-
MTD Actual
-
MTD Target
-
Previous Year Data
-
YTD Actual
-
YTD Target
-
YTD Previous Year
Additionally, conditional formatting uses up and down arrows to highlight performance trends. Therefore, managers quickly identify improvement or decline.
Click to Purchases Synthetic Fibers KPI Dashboard in Excel
3️⃣ KPI Trend Sheet – Detailed Performance Analysis
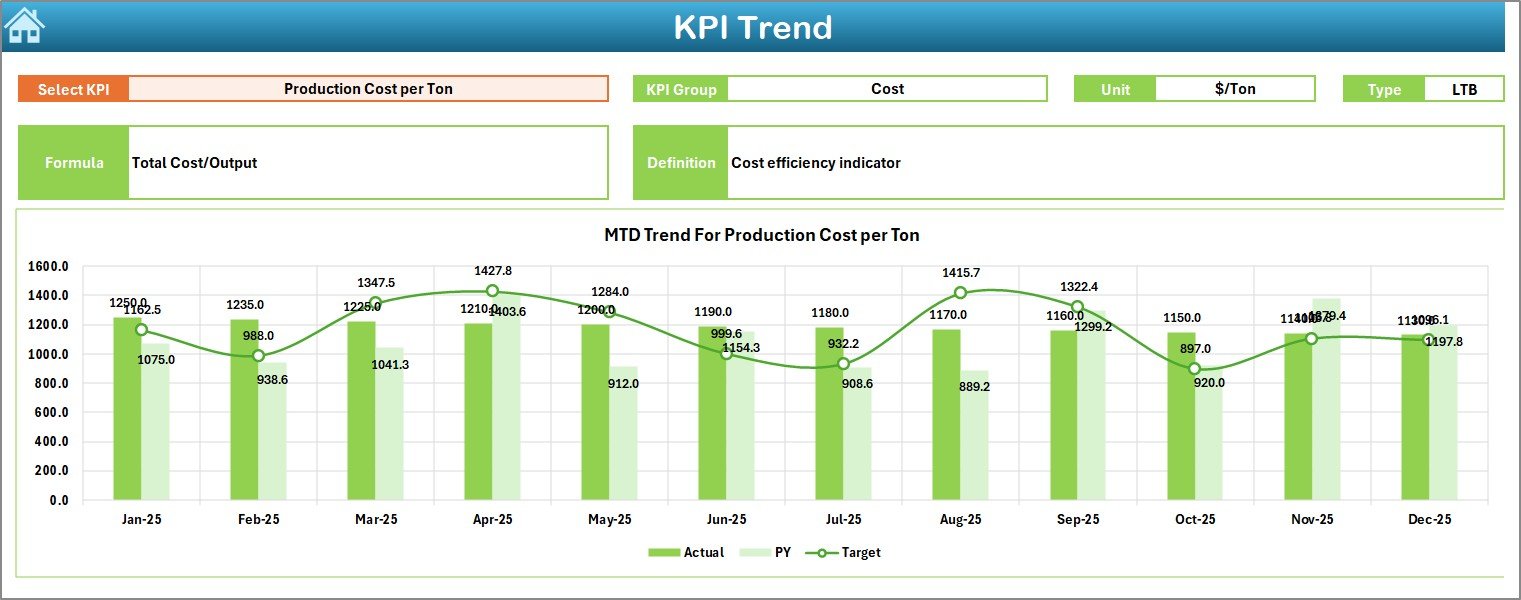
The KPI Trend Sheet provides deeper insights into individual KPIs.
Users can select a KPI from the dropdown in cell C3, and the dashboard immediately updates.
Information Displayed
-
KPI Group
-
Unit of Measurement
-
KPI Type (Lower the Better / Upper the Better)
-
KPI Formula
-
KPI Definition
Trend Visualization
The sheet also includes:
-
MTD Trend Chart
-
YTD Trend Chart
-
Actual vs Target comparison
-
Previous Year comparison
Because trend analysis reveals patterns over time, managers make more accurate strategic decisions.
Click to Purchases Synthetic Fibers KPI Dashboard in Excel
4️⃣ Actual Numbers Input Sheet – Data Entry Section
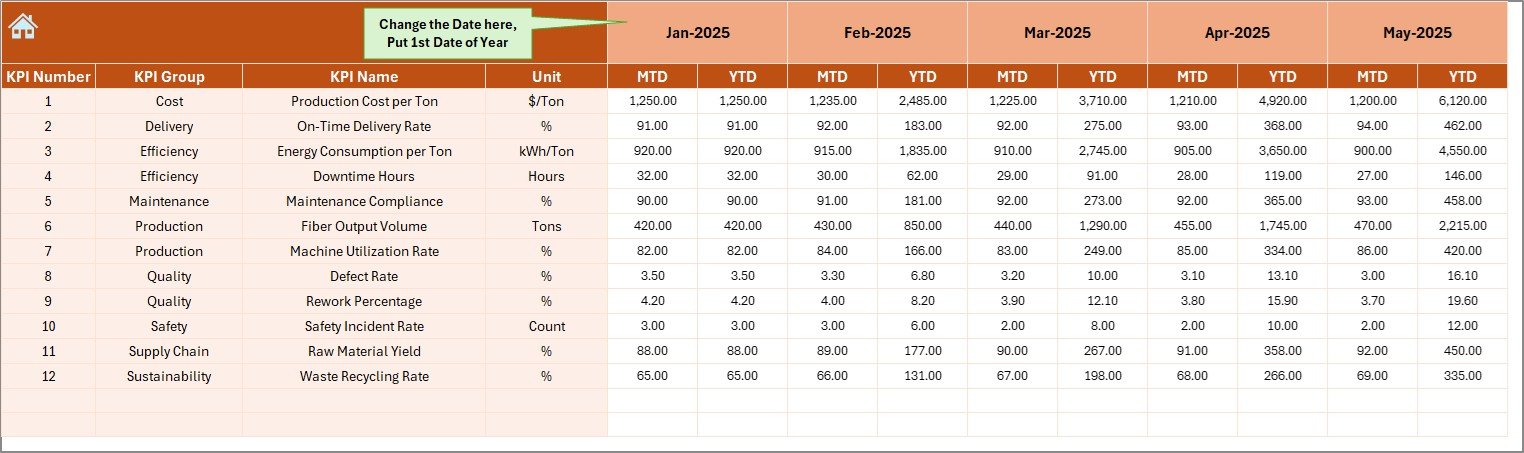
This sheet allows users to enter current-year performance data.
How It Works
-
Select the first month of the year in cell E1
-
Enter MTD and YTD actual values
-
Dashboard updates automatically
Since data entry remains centralized, errors decrease significantly.
5️⃣ Target Sheet – Performance Planning
The Target Sheet stores planned KPI targets.
Users must enter:
-
Monthly MTD Targets
-
Monthly YTD Targets
As a result, organizations can compare planned versus actual performance easily.
6️⃣ Previous Year Number Sheet – Historical Comparison
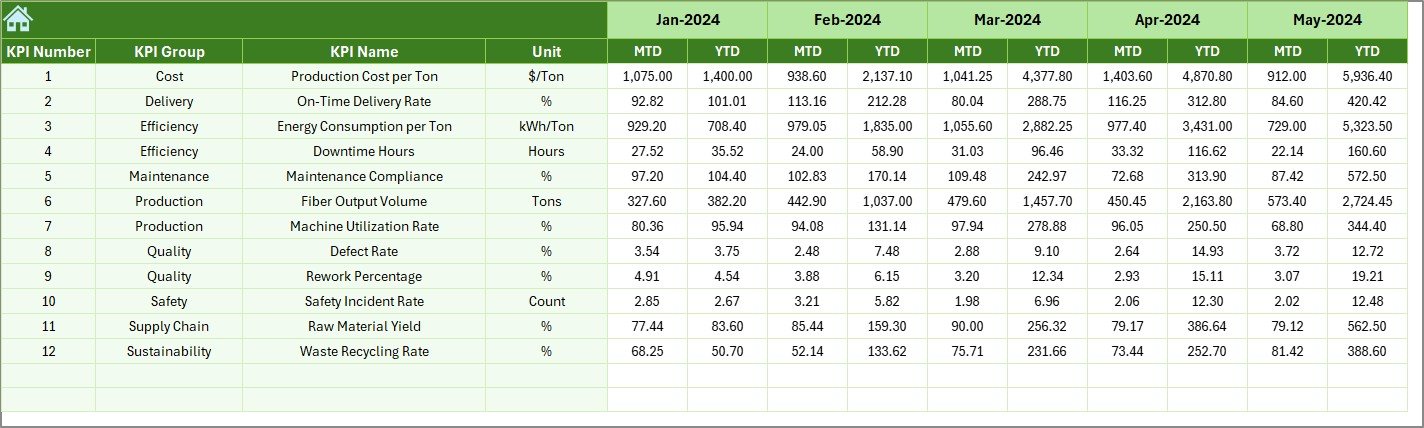
Historical analysis plays a major role in performance evaluation.
In this sheet, users enter previous-year KPI numbers similar to current data.
Therefore, organizations can:
-
Analyze growth trends
-
Compare yearly performance
-
Identify long-term improvements
7️⃣ KPI Definition Sheet – KPI Management Hub
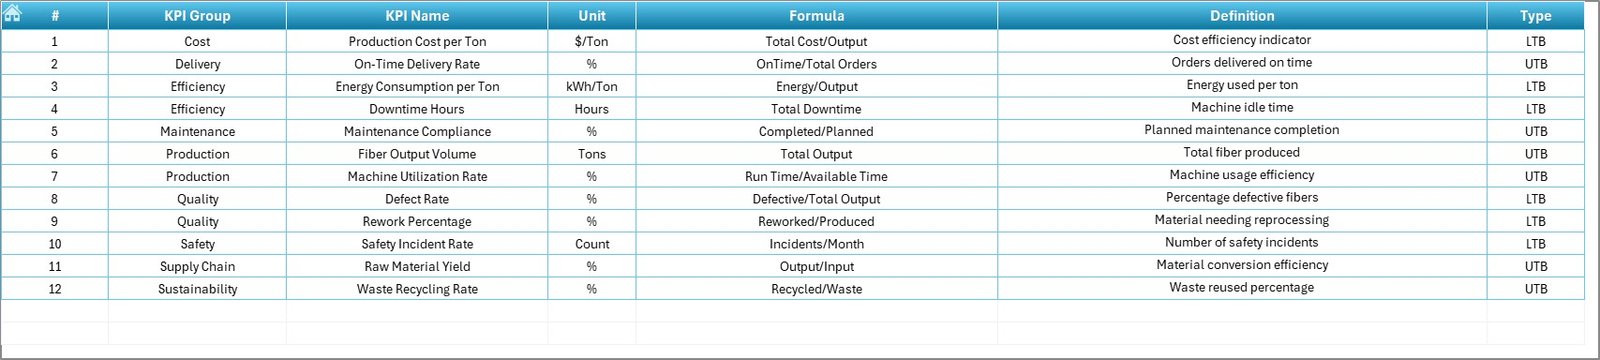
This sheet defines all KPIs used in the dashboard.
Required Information
-
KPI Name
-
KPI Group
-
Unit
-
Formula
-
KPI Definition
Because definitions remain centralized, teams maintain consistency in performance measurement.
Click to Purchases Synthetic Fibers KPI Dashboard in Excel
What KPIs Can Be Tracked in a Synthetic Fibers Dashboard?
Synthetic fiber manufacturing involves operational, quality, and financial metrics. Some commonly tracked KPIs include:
Production KPIs
-
Production Output Volume
-
Machine Utilization Rate
-
Production Efficiency
-
Downtime Percentage
Quality KPIs
-
Defect Rate
-
Yarn Strength Consistency
-
Rejection Rate
-
Customer Complaints
Operational KPIs
-
Energy Consumption per Ton
-
Raw Material Utilization
-
Maintenance Compliance
Financial KPIs
-
Production Cost per Unit
-
Profit Margin
-
Inventory Turnover
Tracking these KPIs ensures balanced performance monitoring.
Click to Purchases Synthetic Fibers KPI Dashboard in Excel
How Does the Dashboard Improve Decision-Making?
A KPI dashboard converts raw numbers into visual insights. Therefore, managers understand performance instantly.
Faster Decisions
Managers identify underperforming areas quickly.
Better Planning
Historical comparisons support accurate forecasting.
Improved Accountability
Teams track performance against targets clearly.
Real-Time Monitoring
Monthly updates provide continuous visibility.
Consequently, organizations operate more efficiently.
Advantages of Synthetic Fibers KPI Dashboard in Excel
Implementing this dashboard provides several benefits.
✅ Centralized Performance Monitoring
All KPIs appear in one location, which simplifies analysis.
✅ Easy to Use
Excel familiarity reduces training requirements.
✅ Automated Calculations
Formulas calculate comparisons automatically.
✅ Visual Performance Indicators
Conditional formatting highlights trends clearly.
✅ Better Productivity
Managers focus on insights instead of manual reporting.
✅ Cost-Effective Solution
Companies avoid expensive software investments.
How to Implement the Synthetic Fibers KPI Dashboard Successfully?
Successful implementation requires structured steps.
Step 1: Define Business Objectives
First, identify operational goals such as productivity improvement or cost reduction.
Step 2: Select Relevant KPIs
Choose KPIs aligned with manufacturing priorities.
Step 3: Enter KPI Definitions
Populate the KPI Definition sheet carefully.
Step 4: Input Target Values
Define realistic monthly targets.
Step 5: Add Historical Data
Enter previous-year values for comparison.
Step 6: Update Actual Data Monthly
Maintain regular data updates.
Following these steps ensures accurate reporting.
Click to Purchases Synthetic Fibers KPI Dashboard in Excel
Best Practices for the Synthetic Fibers KPI Dashboard
Organizations achieve maximum results when they follow proven practices.
✔ Keep KPIs Limited and Relevant
Too many KPIs create confusion. Focus on critical metrics.
✔ Update Data Regularly
Consistent updates maintain dashboard reliability.
✔ Standardize KPI Definitions
Ensure all departments interpret KPIs similarly.
✔ Use Visual Indicators Wisely
Clear visuals improve decision-making speed.
✔ Review Trends Monthly
Trend analysis helps identify long-term patterns.
✔ Train Team Members
Users must understand dashboard usage clearly.
Common Challenges and How to Overcome Them
Although dashboards provide strong benefits, some challenges may arise.
Data Inconsistency
Solution: Use standardized input formats.
Manual Entry Errors
Solution: Validate data before entry.
KPI Overload
Solution: Focus on strategic KPIs only.
Lack of Adoption
Solution: Provide user training sessions.
By addressing these issues early, organizations ensure success.
Why Excel Remains a Powerful Dashboard Tool
Many organizations wonder why Excel still dominates dashboard creation.
Flexibility
Users customize dashboards easily.
Accessibility
Almost every organization already uses Excel.
Automation Capability
Formulas and conditional formatting automate analysis.
Integration
Excel connects with multiple data sources.
Therefore, Excel continues to serve as a reliable business intelligence tool.
Click to Purchases Synthetic Fibers KPI Dashboard in Excel
Who Can Benefit from This Dashboard?
The Synthetic Fibers KPI Dashboard serves multiple roles.
-
Production Managers
-
Plant Heads
-
Operations Teams
-
Quality Managers
-
Supply Chain Managers
-
Business Analysts
-
Manufacturing Consultants
Each stakeholder gains actionable insights.
Future Scope of KPI Dashboards in Manufacturing
Manufacturing analytics continues to evolve rapidly.
In the future, dashboards will integrate with:
-
IoT-enabled machines
-
Real-time production monitoring
-
Predictive maintenance systems
-
AI-based forecasting
However, Excel dashboards remain the foundation for structured performance management.
Conclusion
The Synthetic Fibers KPI Dashboard in Excel provides a practical and powerful solution for monitoring manufacturing performance. It transforms scattered operational data into structured insights that support faster and smarter decisions.
Because the dashboard combines automation, visualization, and trend analysis, organizations improve efficiency, quality, and profitability simultaneously. Moreover, its simple design ensures easy adoption across teams.
Therefore, synthetic fiber manufacturers that implement KPI dashboards gain a strong competitive advantage through data-driven management.
Click to Purchases Synthetic Fibers KPI Dashboard in Excel
Frequently Asked Questions (FAQs)
What is a KPI dashboard in manufacturing?
A KPI dashboard tracks key performance indicators visually, allowing managers to monitor operational performance efficiently.
Why should synthetic fiber manufacturers use KPI dashboards?
They help monitor production efficiency, quality performance, and cost control in one centralized system.
Can beginners use this Excel dashboard?
Yes. The dashboard uses simple data entry sheets and automated calculations, making it beginner-friendly.
How often should the dashboard be updated?
Organizations should update KPI data monthly to maintain accurate analysis.
Can we customize KPIs in this dashboard?
Yes. Users can modify KPIs easily through the KPI Definition sheet.
Does the dashboard support yearly comparison?
Yes. It includes previous-year data comparison for performance evaluation.
Is Excel suitable for industrial dashboards?
Absolutely. Excel provides flexibility, automation, and cost efficiency for KPI tracking.
Click to Purchases Synthetic Fibers KPI Dashboard in Excel
Visit our YouTube channel to learn step-by-step video tutorials