The thrift fashion industry grows rapidly because consumers want sustainable, budget-friendly, and unique fashion choices. Store owners must track sales, categories, product returns, customer satisfaction, and store-wise performance to stay competitive. However, manual reporting slows down the decision-making process. As a result, teams lose clarity, miss trends, and struggle to understand how different stores or categories perform.
A Thrift Fashion Dashboard in Excel solves these challenges. It turns your raw fashion data into clear visuals, helping you understand your business within seconds. You track performance, analyze profits, and manage categories easily. You also explore the complete customer journey because the dashboard shows satisfaction ratings, return patterns, and payment method behaviors.
In this detailed guide, you will learn what the Thrift Fashion Dashboard in Excel is, how it works, and why it helps thrift stores make smarter decisions. You will also explore each dashboard page, advantages, best practices, and FAQs.
Click to Purchases Thrift Fashion Dashboard in Excel
What Is a Thrift Fashion Dashboard in Excel?
A Thrift Fashion Dashboard in Excel is a ready-to-use business intelligence template that helps thrift store owners and managers analyze their entire operations. It connects to a structured data sheet and converts the information into dashboards with charts, slicers, cards, and visual insights.
The dashboard includes five analytical pages:
-
Overview
-
Store Name Analysis
-
Category Analysis
-
Payment Status Analysis
-
Monthly Trends
Each page contains important charts, slicing options, and KPI cards. Therefore, you understand what drives growth and what needs improvement.
Click to Purchases Thrift Fashion Dashboard in Excel
Why Do Thrift Stores Need a Fashion Analytics Dashboard?
Thrift stores manage thousands of items. Every product has a category, price, discount, store location, payment mode, satisfaction rating, and return status. When this data stays inside spreadsheets, teams face several problems:
-
They struggle to find trends.
-
They take more time to prepare reports.
-
They cannot compare stores or categories easily.
-
They fail to track product delivery and returns on time.
-
They do not understand customer satisfaction properly.
A Thrift Fashion Dashboard in Excel organizes everything. You interact with the data through charts, KPI cards, and slicers. Because of this, you take better decisions quickly.
Dashboard Structure – What Makes This Template Easy to Use?
The dashboard includes a Page Navigator on the left side. You can move from one page to another without scrolling or searching. The design keeps all important visuals on the right side, making the layout clean and professional.
You simply update the Data Sheet, and the dashboard refreshes automatically.
Let’s explore each page in detail.
Click to Purchases Thrift Fashion Dashboard in Excel
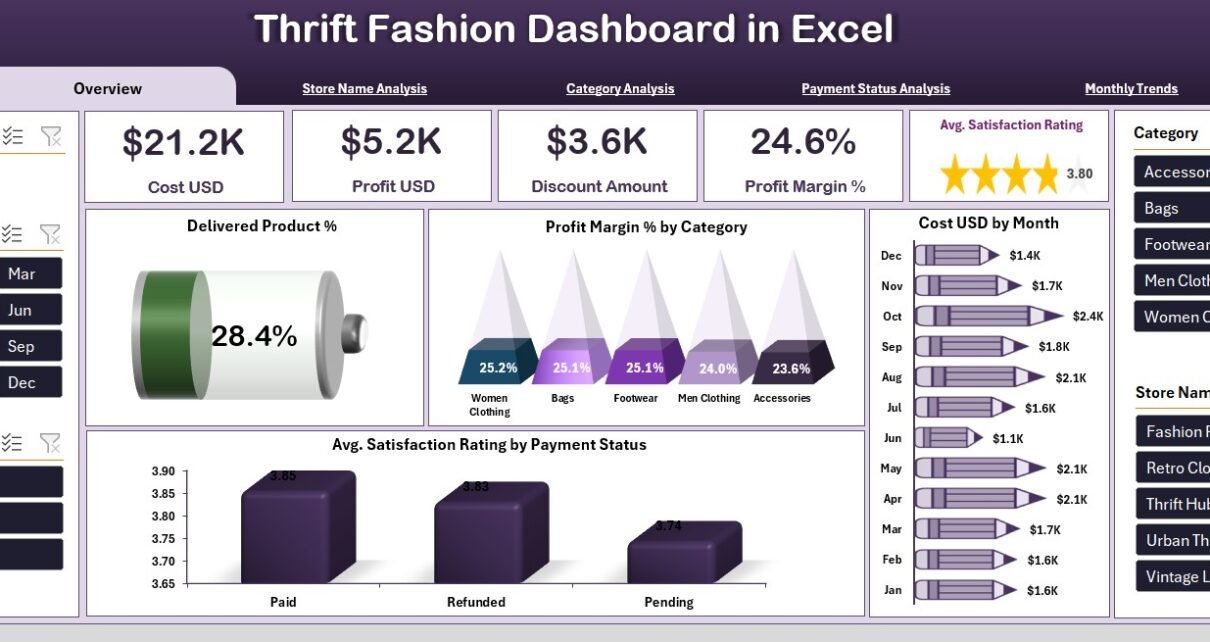
1. Overview Page

The Overview Page gives you a quick summary of your thrift business. It displays the most important KPIs and charts that show the overall performance.
Key Features of the Overview Page
✔ Right-Side Slicers
You can filter the data by month, store name, payment status, category, or any custom fields. These slicers help you understand performance under different conditions.
✔ Five KPI Cards
The cards help you track your most important business metrics at a glance:
-
Delivered Product Percentage
-
Total Profit
-
Average Satisfaction Rating
-
Total Cost
-
Total Sales Value
These cards help you monitor your business without scrolling or reading long tables.
✔ Four Insightful Charts
1. Delivered Product % Chart
This chart shows the percentage of products delivered successfully. It helps you detect delivery issues quickly.
2. Profit Margin % by Category
You see which product categories give you the best profit margins. You can boost pricing, refine sourcing, or increase focus on profitable segments.
3. Cost (USD) by Month
This chart reveals your monthly spending. You identify high-cost months and plan budgets with more accuracy.
4. Average Satisfaction Rating by Payment Status
Customer satisfaction varies by payment method. You may find that customers who pay through online wallets show different satisfaction patterns than those who use cash. This chart highlights those patterns clearly.
Why This Page Matters
The Overview Page gives you a complete snapshot of your business. It works as your daily performance tracker. Because of this, you understand the business health instantly.
Click to Purchases Thrift Fashion Dashboard in Excel
2. Store Name Analysis
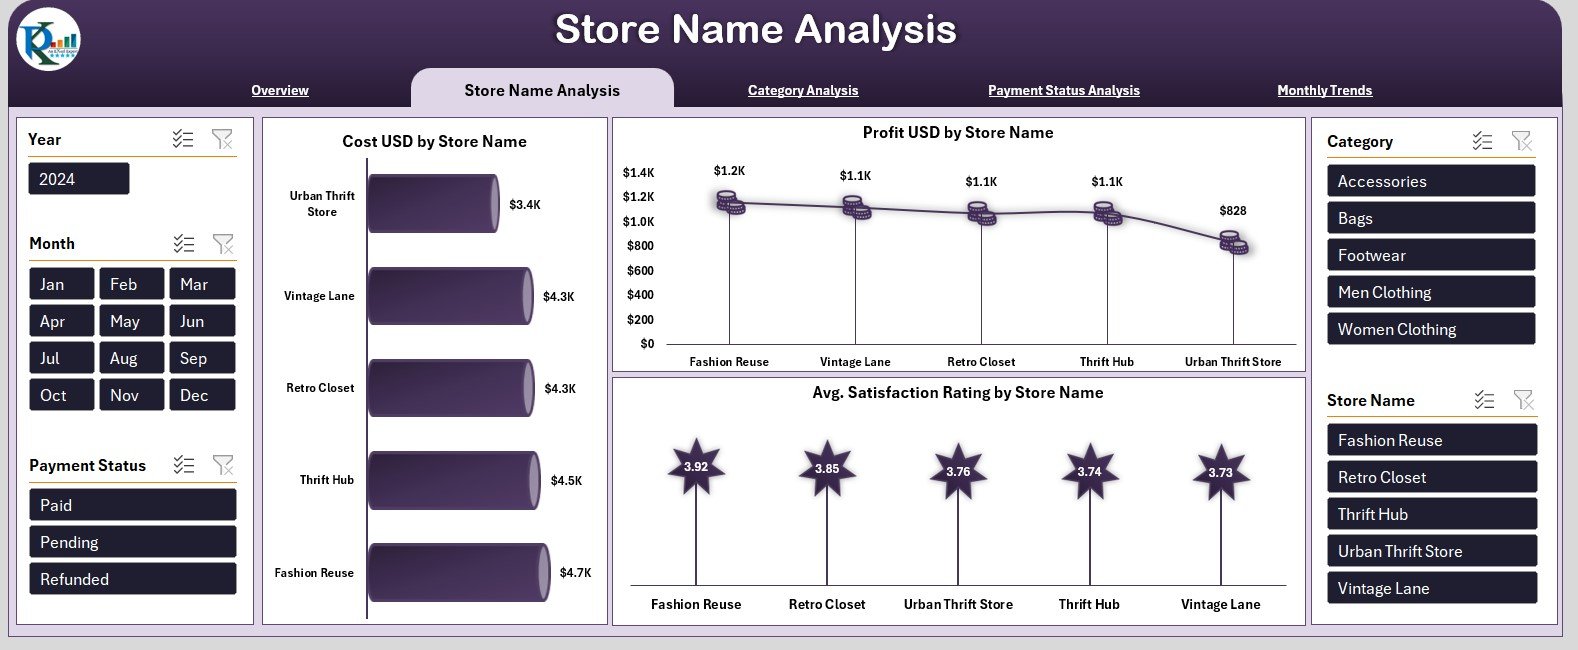
If you run multiple thrift stores, you must compare their performance. The Store Name Analysis Page highlights sales, profits, and satisfaction ratings for each store.
Key Features of the Store Name Analysis Page
✔ Right-Side Slicers
You switch between months, categories, and payment statuses to compare performance.
✔ Three Powerful Charts
1. Cost (USD) by Store Name
You see which store spends more and which store maintains better cost control. This insight helps you reduce unnecessary expenses.
2. Profit (USD) by Store Name
This chart helps you identify your top-performing stores. You understand which stores drive the highest sales and profits.
3. Average Satisfaction Rating by Store Name
Customer experience matters the most. This chart shows which store builds stronger loyalty and which store needs improvement.
Why This Page Matters
Store managers and business owners use this page to evaluate overall performance. It supports strategic decisions such as staff training, inventory allocation, and location-based campaigns.
3. Category Analysis
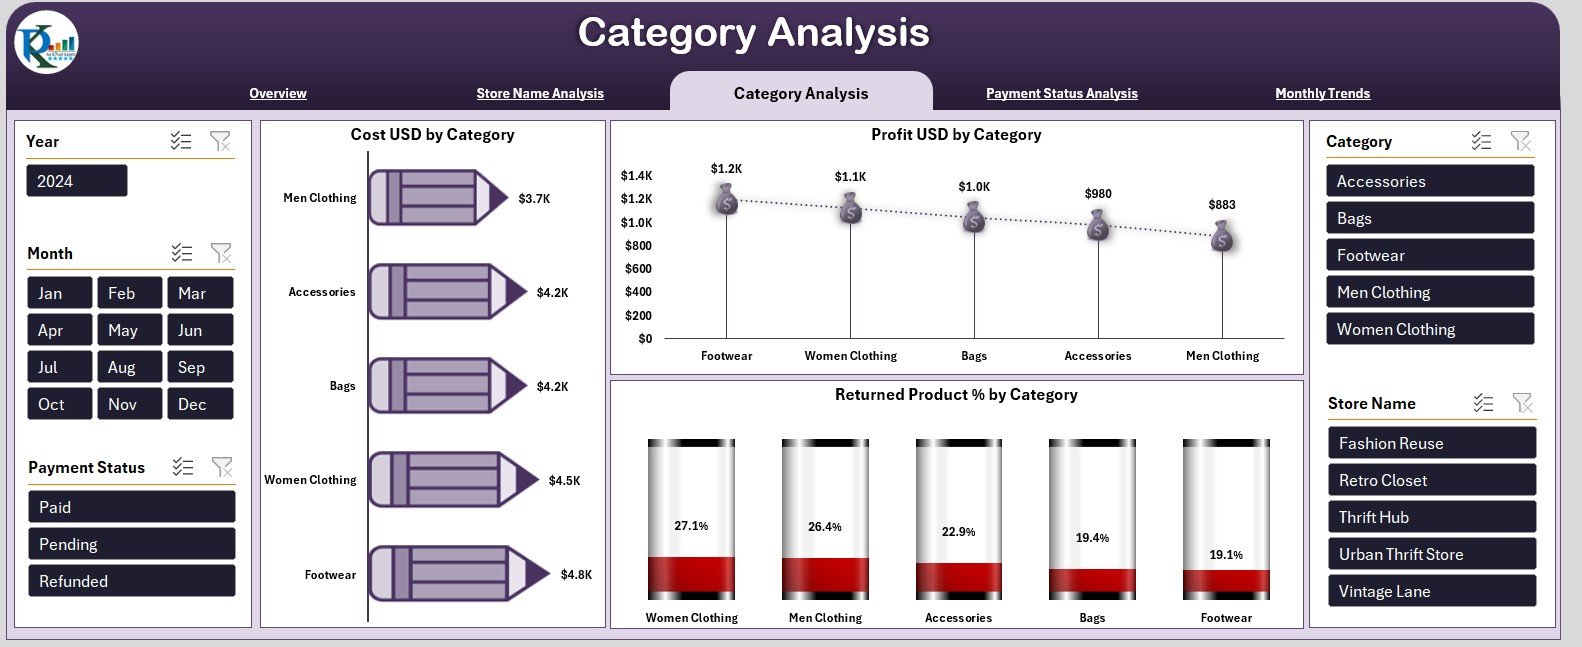
Every thrift store depends on the success of different product categories like clothing, accessories, shoes, bags, and jewelry. Some categories run well every month, while others may face returns or low satisfaction.
The Category Analysis Page helps you understand category-wise performance.
Key Elements on the Category Analysis Page
✔ Right-Side Slicers
These slicers help you examine category performance under different payment statuses, store names, and time periods.
✔ Three Essential Charts
1. Cost (USD) by Category
This chart shows how much you spend on each product category. You understand which category consumes the highest cost.
2. Profit (USD) by Category
You identify your most profitable product categories. You can also see low-performing segments that need improvement.
3. Returned Product % by Category
Returns affect profits directly. This chart helps you identify categories with high return percentages. You take quick action to improve product quality or vendor selection.
Why This Page Matters
Category performance drives business success. This page helps you optimize pricing, discounts, marketing, and stock planning.
Click to Purchases Thrift Fashion Dashboard in Excel
4. Payment Status Analysis
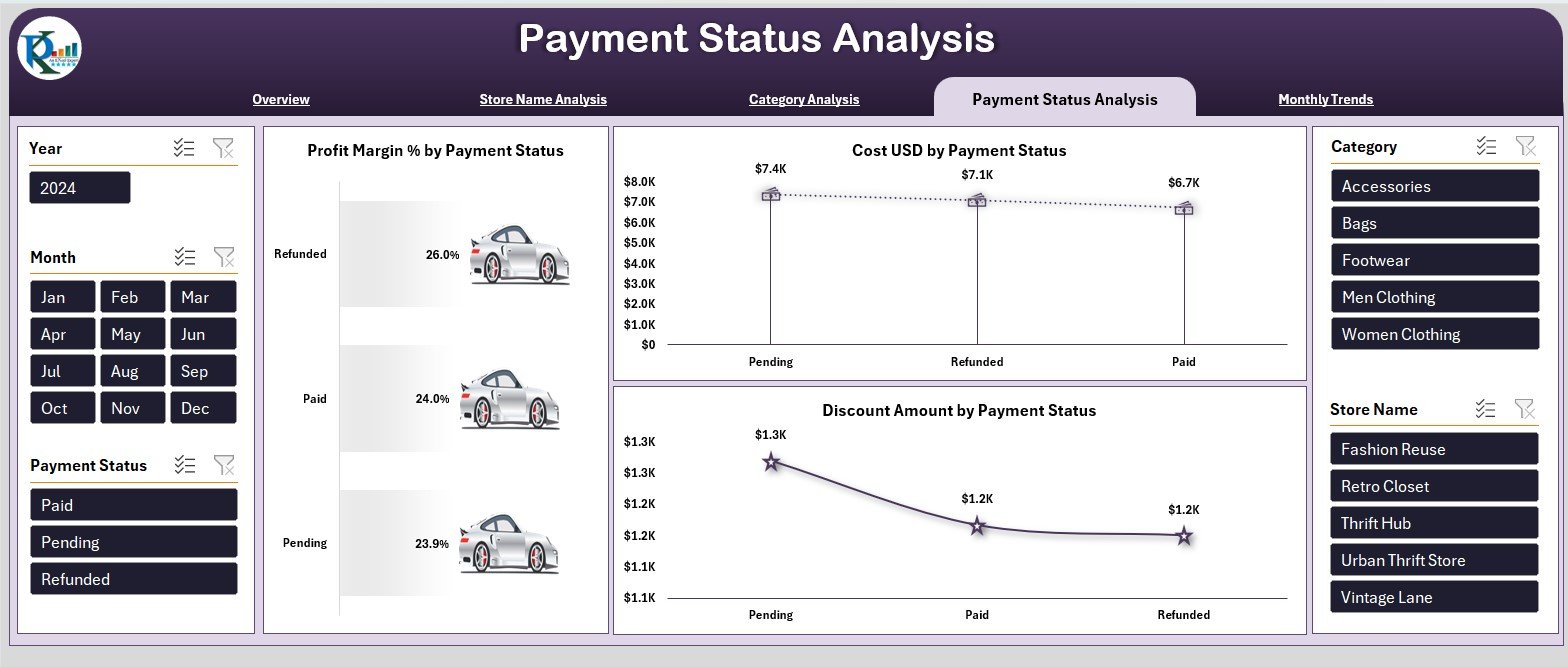
Customers use various payment methods in thrift stores. Each method influences satisfaction, profit margin, and discount behavior. The Payment Status Analysis Page reveals how payment modes impact business results.
Key Features of the Payment Status Analysis Page
✔ Right-Side Slicers
You filter the results by store name, month, and category.
✔ Three Detailed Charts
1. Profit Margin % by Payment Status
This chart helps you understand which payment methods deliver the best profit margins.
2. Cost (USD) by Payment Status
You see the cost distribution across different payment statuses.
3. Discount Amount by Payment Status
Discount behavior varies by payment method. This chart shows where you offer higher discounts and how that affects sales.
Why This Page Matters
This analysis supports pricing, offers, and promotional strategies. You also understand payment trends and customer preferences.
Click to Purchases Thrift Fashion Dashboard in Excel
5. Monthly Trends
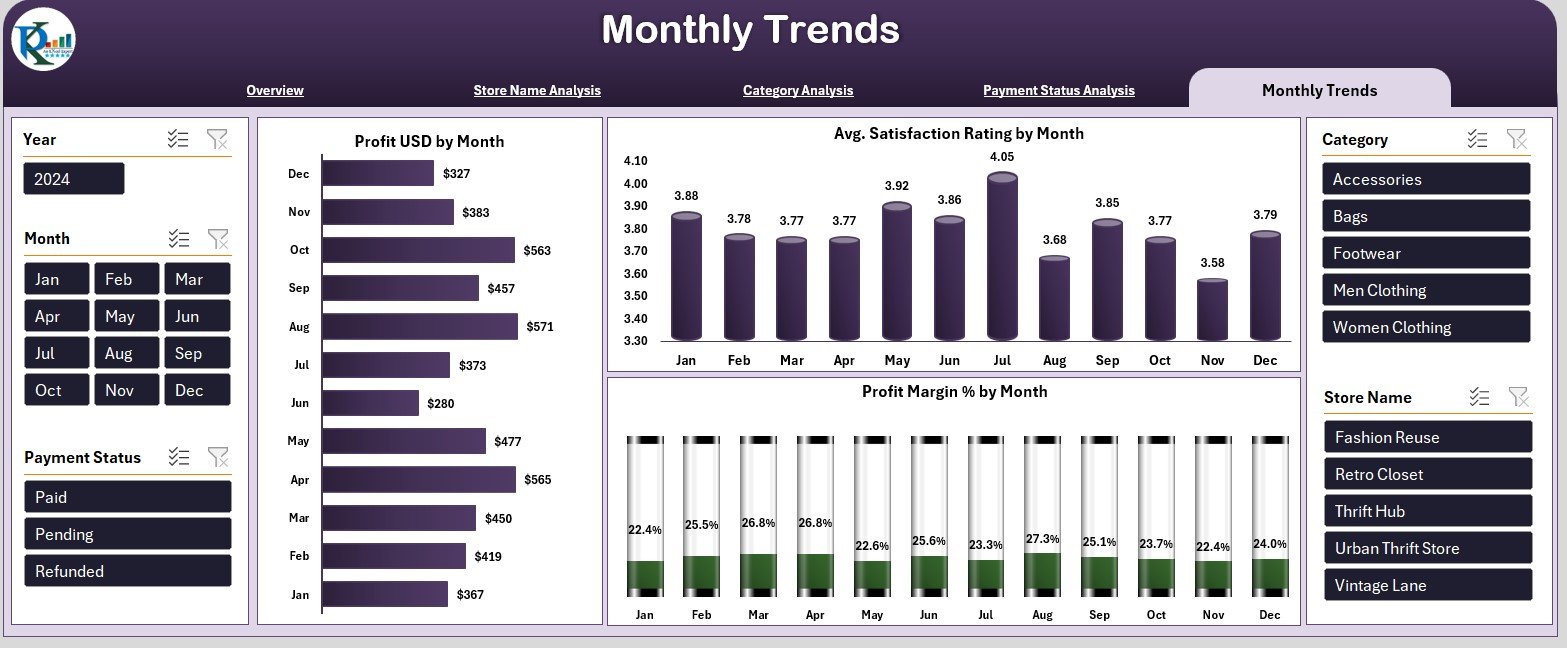
The Monthly Trends Page displays your performance month by month. It reveals long-term patterns in sales, satisfaction, and profit.
Key Charts on the Monthly Trends Page
✔ Right-Side Slicers
You compare different stores, categories, and payment methods across months.
✔ Three Trend-Based Charts
1. Profit (USD) by Month
This chart highlights your monthly profit. You see which months perform well and which ones slow down.
2. Average Satisfaction Rating by Month
Satisfaction fluctuates every month. This chart helps you understand customer behavior and service quality.
3. Profit Margin % by Month
Profit margin trends show how efficiently you manage costs and pricing through the year.
Why This Page Matters
Monthly trends help you forecast future performance. You estimate inventories, manage staffing, and plan promotions with better accuracy.
Support Sheet and Data Sheet
Apart from dashboard pages, the template includes:
✔ Support Sheet
It stores essential drop-down values like categories, store names, and payment statuses. The dashboard uses these values to maintain consistency.
✔ Data Sheet
This sheet contains the raw transactional data. It includes fields like:
-
Store name
-
Category
-
Product cost
-
Sales price
-
Profit
-
Payment status
-
Discount
-
Satisfaction rating
-
Delivery status
-
Month name
You update this sheet regularly, and the dashboard refreshes automatically.
Click to Purchases Thrift Fashion Dashboard in Excel
Advantages of a Thrift Fashion Dashboard in Excel
This dashboard offers several practical benefits for thrift businesses:
✔ 1. Clear Performance Tracking
You see all important KPIs in one place.
✔ 2. Faster Decision-Making
Charts and slicers help you understand data instantly.
✔ 3. Improved Category Management
You identify high-performing and low-performing categories quickly.
✔ 4. Better Profit Optimization
Profit, cost, and margin charts reveal hidden opportunities.
✔ 5. Enhanced Customer Satisfaction
You track satisfaction ratings and act immediately.
✔ 6. Store-Level Insights
You compare store performance and detect areas of improvement.
✔ 7. Strong Trend Analysis
You monitor monthly trends and predict future performance.
✔ 8. Easy-to-Use Excel Template
The dashboard works smoothly even for beginners.
Click to Purchases Thrift Fashion Dashboard in Excel
Best Practices for Using the Thrift Fashion Dashboard in Excel
Follow these practices to get the best results:
✔ 1. Update Data Sheet Regularly
Fresh data ensures accurate results.
✔ 2. Maintain Clean Data
Use consistent names, correct formats, and proper dates.
✔ 3. Use Slicers Smartly
Switch between filters to explore deeper insights.
✔ 4. Review Monthly Trends Every Month
This helps you prepare budgets and promotions.
✔ 5. Compare Stores and Categories Often
This strengthens decision-making for staffing and inventory.
✔ 6. Track Return Rates
High return rates indicate issues in quality or product selection.
✔ 7. Study Payment Behavior
Payment status insights help you adjust discount and offer strategies.
✔ 8. Share Insights with Teams
Teams act faster when everyone understands the numbers.
Conclusion
A Thrift Fashion Dashboard in Excel gives thrift businesses complete control over their performance. It brings all store, category, payment, satisfaction, and monthly insights into one interactive dashboard. You make smarter decisions, boost profitability, and improve customer experience easily.
The dashboard’s five pages—Overview, Store Analysis, Category Analysis, Payment Status Analysis, and Monthly Trends—help you understand everything from daily performance to long-term patterns.
With clean data and regular updates, this dashboard becomes one of the most powerful tools for any thrift fashion business.
Click to Purchases Thrift Fashion Dashboard in Excel
Frequently Asked Questions (FAQs)
1. What is a Thrift Fashion Dashboard in Excel?
It is a ready-to-use dashboard template that displays store performance, category insights, profits, and customer satisfaction in Excel.
2. Who can use this dashboard?
Thrift store owners, analysts, retail managers, and sustainability fashion businesses.
3. Does this dashboard require Excel expertise?
No. Anyone with basic Excel knowledge can use it.
4. Can I customize the dashboard?
Yes. You can change charts, colors, categories, or add new KPIs.
5. Does it support multiple stores?
Yes. The dashboard includes store-wise analysis.
6. Does the dashboard show monthly trends?
Yes. It includes profit, satisfaction, and margin trends.
7. How do I update the dashboard?
You update the Data Sheet, and all visuals refresh automatically.
8. Can I analyze discount patterns?
Yes. The Payment Status page highlights discount trends clearly.
Click to Purchases Thrift Fashion Dashboard in Excel
Visit our YouTube channel to learn step-by-step video tutorials