Managing a training budget can be challenging for organizations of all sizes. Every company wants to upskill its employees, but without proper tracking, costs can spiral out of control. Many HR and training departments still rely on static spreadsheets, which makes it hard to monitor expenses, track variances, and evaluate program effectiveness.
This is where a Training Budget Dashboard in Power BI comes into play. It transforms complex financial data into easy-to-read visuals that help managers make smarter decisions about employee development.
In this article, we will explore everything you need to know about the Training Budget Dashboard in Power BI, including its features, advantages, best practices, and opportunities for improvement. By the end, you will understand why businesses across industries are adopting this solution to optimize their training investments.
Click to Purchases Training Budget Dashboard in Power BI
What is a Training Budget Dashboard in Power BI?
A Training Budget Dashboard in Power BI is a pre-designed reporting tool that integrates training and financial data from Excel or other sources into Power BI. It provides an interactive and dynamic view of training expenses, approvals, utilization, and trends.
Instead of manually analyzing raw numbers, HR teams, L&D managers, and finance professionals can use this dashboard to:
-
Track training expenses in real time.
-
Compare actual spending with allocated budgets.
-
Monitor budget utilization by department, program, or trainer.
-
Identify overspending and take corrective action quickly.
-
Analyze monthly and yearly training trends.
This dashboard not only saves time but also supports data-driven decision-making in training and development.
Key Features of the Training Budget Dashboard in Power BI
The Training Budget Dashboard comes with multiple pages, each focusing on a different area of analysis. Let’s explore these pages one by one.
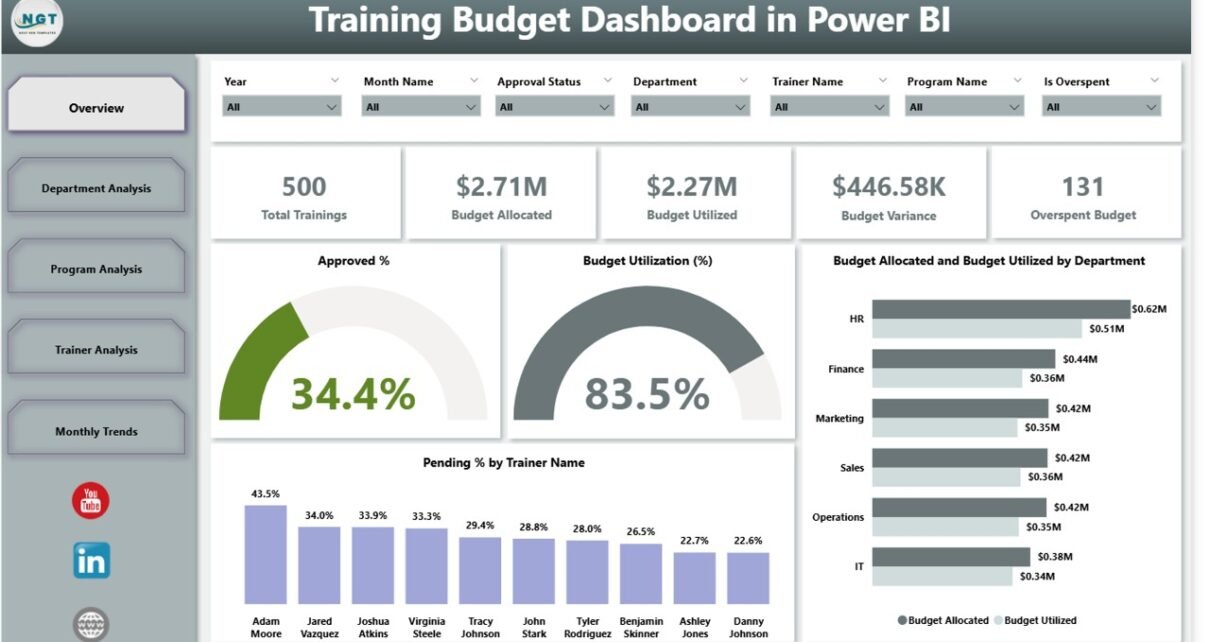
Overview Page
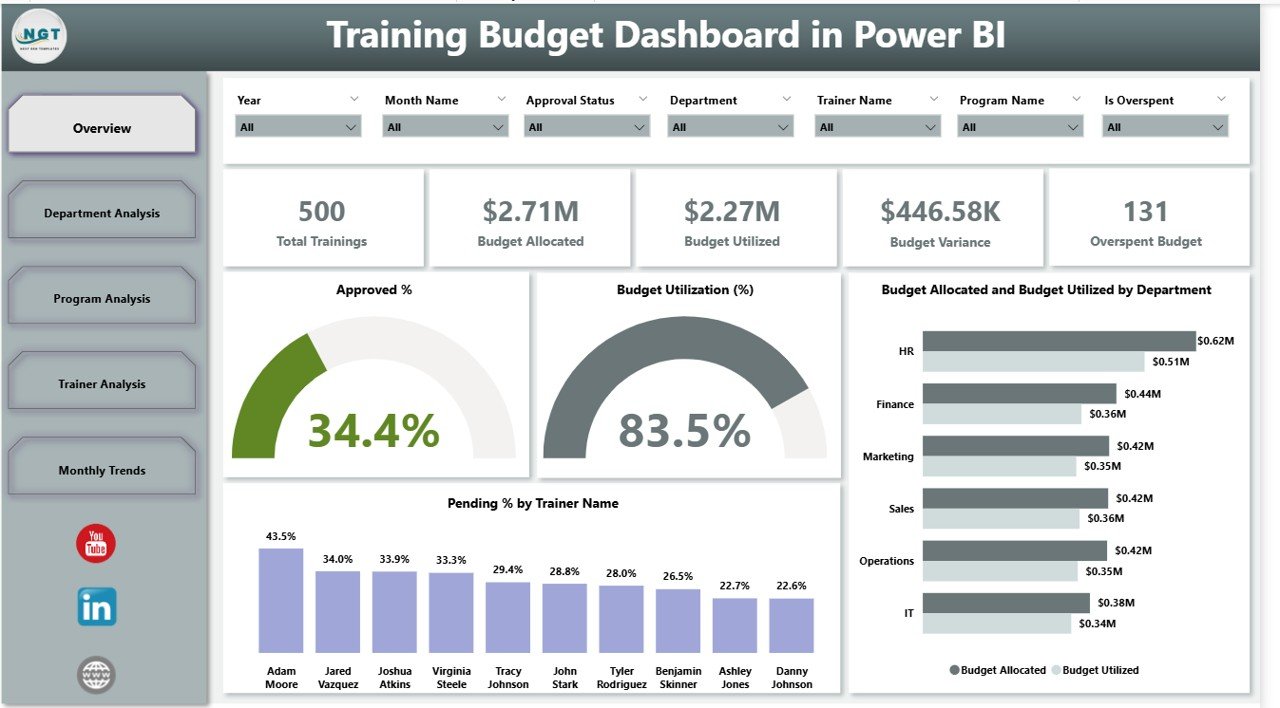
The Overview Page is the main entry point of the dashboard. It includes six slicers for filtering data and five key performance cards that highlight essential metrics.
Key Highlights:
-
Approved %: Shows the percentage of training programs that have received budget approval.
-
Budget Utilization (%): Displays how much of the allocated budget has been used.
-
Budget Allocation vs. Utilized: Compares the planned budget with actual spending.
-
Pending % by Trainer Name: Tracks budget approvals or requests still waiting for confirmation.
This page gives decision-makers a quick snapshot of the overall training budget health.
Department Analysis
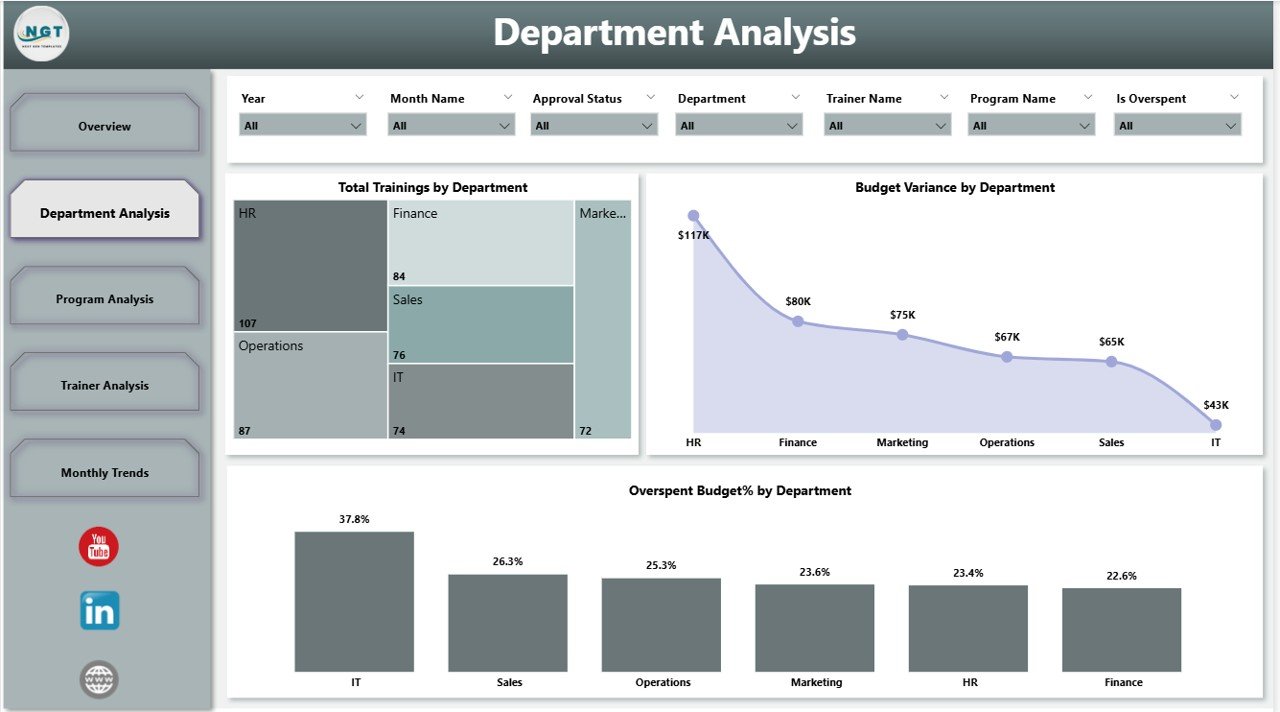
The Department Analysis Page provides insights into how each department is utilizing its training funds. It comes with six slicers for customized filtering and three critical charts.
Key Charts:
-
Total Trainings by Department: Shows the number of training sessions conducted per department.
-
Budget Variance by Department: Highlights the difference between allocated and actual budget.
-
Overspend Budget % by Department: Identifies departments where training costs exceeded the allocated budget.
This page helps HR teams compare performance across departments and manage resource allocation effectively.
Click to Purchases Training Budget Dashboard in Power BI
Program Analysis
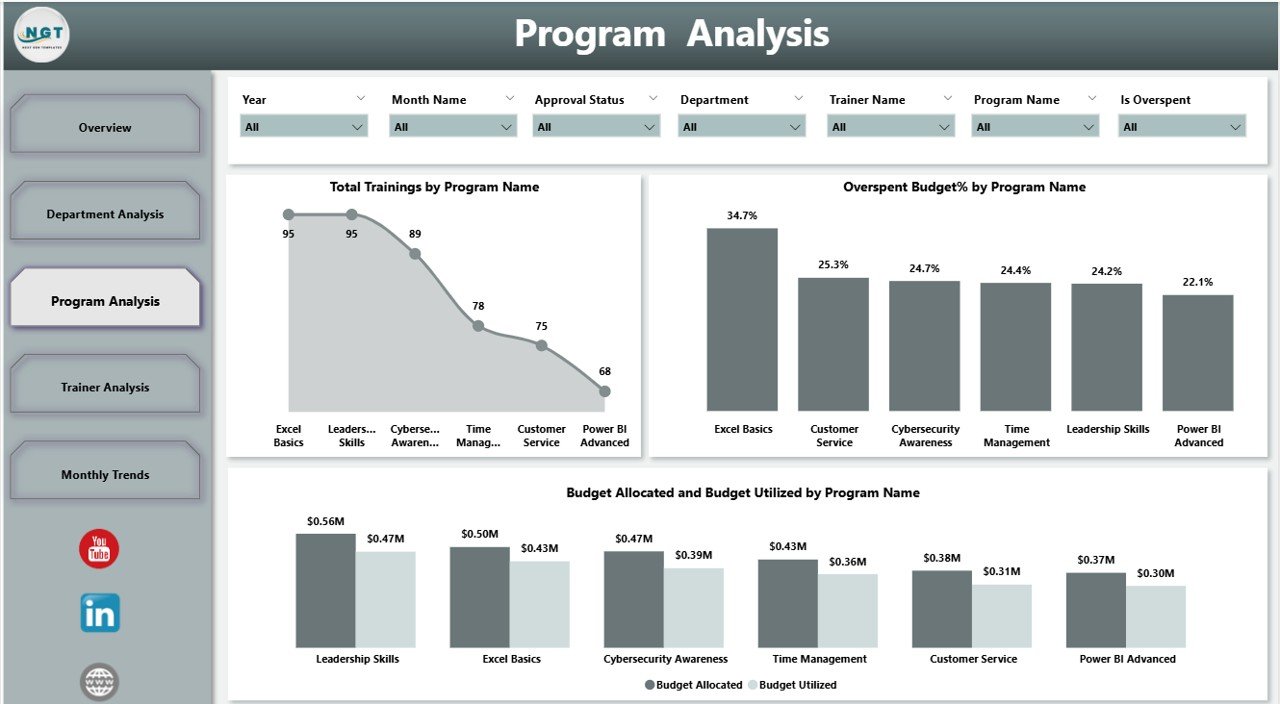
The Program Analysis Page focuses on the training programs themselves. With six slicers, users can drill down into specific details.
Key Charts:
-
Total Trainings by Program Name: Tracks how many sessions were conducted for each program.
-
Budget Variance by Program: Shows whether individual programs stayed within or exceeded budget.
-
Budget Allocation vs. Utilized by Program: Provides a financial comparison for each training program.
This analysis helps organizations identify which programs deliver value and which may require restructuring or better cost management.
Trainer Analysis

The Trainer Analysis Page evaluates the effectiveness and cost efficiency of trainers. Like the other pages, it comes with six slicers for detailed filtering.
Key Charts:
-
Total Trainings by Trainer Name: Displays the number of sessions conducted by each trainer.
-
Reject % by Trainer Name: Shows the percentage of rejected or unapproved sessions by trainer.
-
Budget Allocation vs. Utilized by Trainer: Compares the allocated budget with actual trainer expenses.
This page allows organizations to assess trainer performance and approval rates, ensuring that investments in trainers are justified.
Monthly Trends

The final page, Monthly Trends, provides time-based insights with six slicers and multiple charts.
Key Charts:
-
Total Trainings by Month Name: Highlights the distribution of training sessions across months.
-
Overspend Budget by Month Name: Identifies periods where training expenses exceeded allocations.
-
Budget Allocation vs. Utilized by Month: Compares monthly planned vs. actual spending.
This analysis helps organizations spot seasonal patterns and plan training schedules more effectively.
Why Do Businesses Need a Training Budget Dashboard?
Managing training costs is no longer just about controlling expenses. It is about ensuring that every training dollar spent adds value to employee growth and organizational performance.
Key reasons businesses need this dashboard include:
-
Real-Time Tracking: See training spend instantly without waiting for manual reports.
-
Error Reduction: Reduce human errors associated with spreadsheets.
-
Faster Decisions: Make informed choices about future training investments.
-
Cross-Department Insights: Understand which departments use budgets efficiently.
-
Performance Optimization: Measure ROI of training programs and trainers.
Advantages of Training Budget Dashboard in Power BI
Here are the main benefits organizations can expect:
✅ Easy to Use – Interactive visuals make data simple to understand.
✅ Time-Saving – Reduces time spent preparing and analyzing reports.
✅ Cost Control – Identifies overspending areas quickly.
✅ Transparency – Provides visibility for management, HR, and finance teams.
✅ Better Planning – Helps plan budgets more accurately for future training cycles.
✅ Scalability – Works for small teams and large organizations alike.
Opportunities for Improvement
Even though this dashboard offers a powerful solution, there are still areas that organizations can enhance:
🔹 Integration with HR Systems – Linking directly with HR platforms for real-time updates.
🔹 Advanced Predictive Analysis – Using AI and machine learning to forecast future training costs.
🔹 Feedback Metrics – Adding employee feedback scores to measure training effectiveness.
🔹 Mobile-Friendly Views – Optimizing dashboards for mobile devices.
🔹 Custom Alerts – Setting up notifications for overspending or low utilization.
Best Practices for Using the Training Budget Dashboard
To maximize the value of your Training Budget Dashboard, follow these best practices:
-
Keep Data Clean and Updated
-
Regularly refresh your Excel or data source to avoid outdated insights.
-
-
Use Slicers Effectively
-
Apply filters for department, trainer, or program to get deeper insights.
-
-
Monitor Key KPIs Weekly
-
Focus on metrics like utilization %, variance, and overspending.
-
-
Involve Stakeholders
-
Share the dashboard with HR, finance, and department heads for collaboration.
-
-
Plan Ahead Using Trends
-
Use monthly trend analysis to forecast next quarter’s training requirements.
-
Conclusion
The Training Budget Dashboard in Power BI is a must-have tool for organizations that want to optimize their training investments. It provides clear, actionable insights into budget allocation, utilization, department-wise performance, trainer efficiency, and monthly trends.
By using this dashboard, businesses can control costs, reduce errors, and improve training outcomes. When combined with best practices and continuous improvements, the dashboard becomes an essential part of modern workforce development strategy.
Frequently Asked Questions (FAQs)
1. What is the main purpose of a Training Budget Dashboard in Power BI?
The main purpose is to help organizations monitor training expenses, compare them with allocated budgets, and identify overspending or underutilization.
2. Who can benefit from this dashboard?
HR managers, training coordinators, finance teams, and business leaders can benefit by gaining real-time insights into training investments.
3. Can this dashboard be customized?
Yes. Power BI allows customization, so organizations can add charts, metrics, or filters that match their specific training requirements.
4. How does it integrate with Excel data?
The dashboard connects to Excel files where training and budget data is stored. Once linked, Power BI automatically refreshes and updates visuals.
5. Does it support predictive analysis?
By default, it tracks actuals and trends. However, with additional setup, predictive analysis using Power BI’s AI tools can be integrated.
6. Can small businesses use this dashboard?
Absolutely. Even small companies with limited training budgets can benefit from the clear visibility this dashboard provides.
7. Is this dashboard mobile-friendly?
Yes, Power BI dashboards can be viewed on mobile apps, but further optimization may be needed for the best experience.
Visit our YouTube channel to learn step-by-step video tutorials
Click to Purchases Training Budget Dashboard in Power BI
Watch the step-by-step video tutorial: