In today’s fast-paced global economy, businesses must communicate effectively across borders. Whether you’re a translation agency, localization project manager, or global marketing team, managing translation performance data can quickly become complex. That’s why we’ve created the Translation & Localization Dashboard in Excel — a ready-to-use analytical solution that simplifies multilingual project tracking, cost management, and performance monitoring.
This Excel dashboard helps you visualize project metrics, translation efficiency, proofreading costs, profit margins, and revenue across languages, industries, and months — all in one place. With dynamic visuals, interactive slicers, and clean design, it turns raw data into actionable insights that empower better business decisions.
Click to Purchases Translation & Localization Dashboard in Excel
What Is a Translation & Localization Dashboard in Excel?
A Translation & Localization Dashboard in Excel is an analytical tool designed to monitor key performance indicators (KPIs) and financial metrics for translation projects. It enables you to track translation costs, proofreading expenses, payment performance, client satisfaction, and overall profitability — all while breaking down insights by industry, source language, and target language.
This dashboard brings transparency to every stage of the localization workflow. From measuring translation efficiency to identifying high-cost areas, the dashboard allows managers to make informed decisions based on accurate, real-time data.
🧭 Structure of the Translation & Localization Dashboard
The dashboard is structured into five analytical pages and a support data sheet for raw inputs. Let’s explore each section in detail.
1️⃣ Overview Page
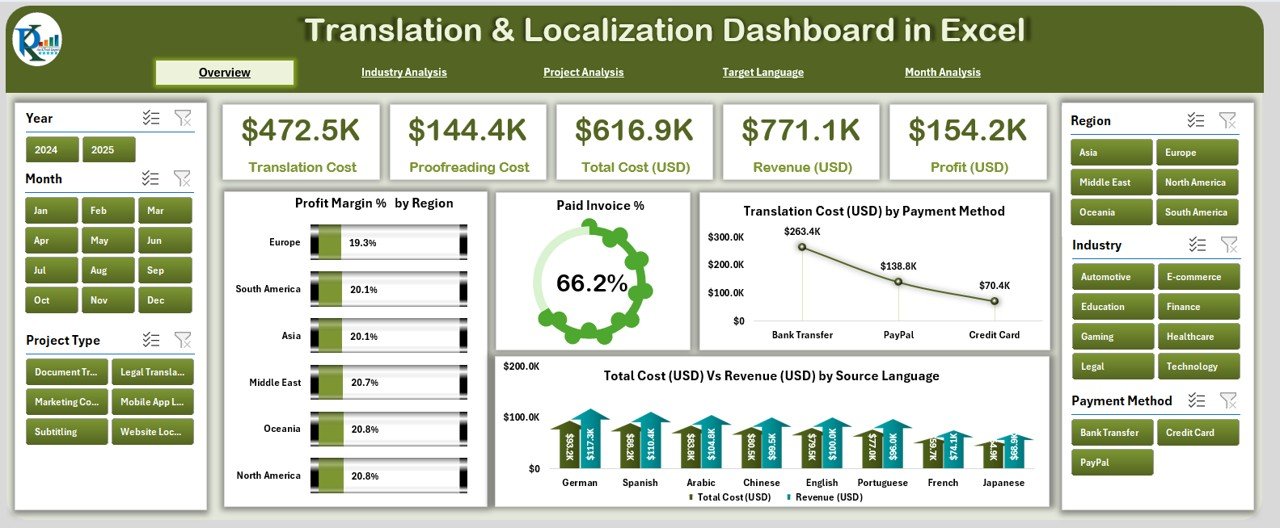
The Overview Page is the command center of your dashboard. Located on the main page, it offers a quick snapshot of translation performance using visual cards and interactive charts.
-
Page Navigator: On the left side, you’ll find an easy-to-use navigator for quick access to all dashboard pages.
-
KPI Cards: Five key metric cards display essential performance indicators such as Total Revenue, Total Cost, Profit Margin %, Paid Invoice %, and Translation Volume.
Charts Included:
- Profit Margin % by Region – Understand which regions deliver the highest profitability.
- Paid Invoice % – Track client payment efficiency.
- Translation Cost (USD) by Payment Method – Identify cost patterns by payment method.
- Total Cost (USD) vs Revenue (USD) by Source Language – Compare cost efficiency and income by language pair.
This page offers a complete picture of your financial health and translation efficiency.
2️⃣ Industry Analysis Page
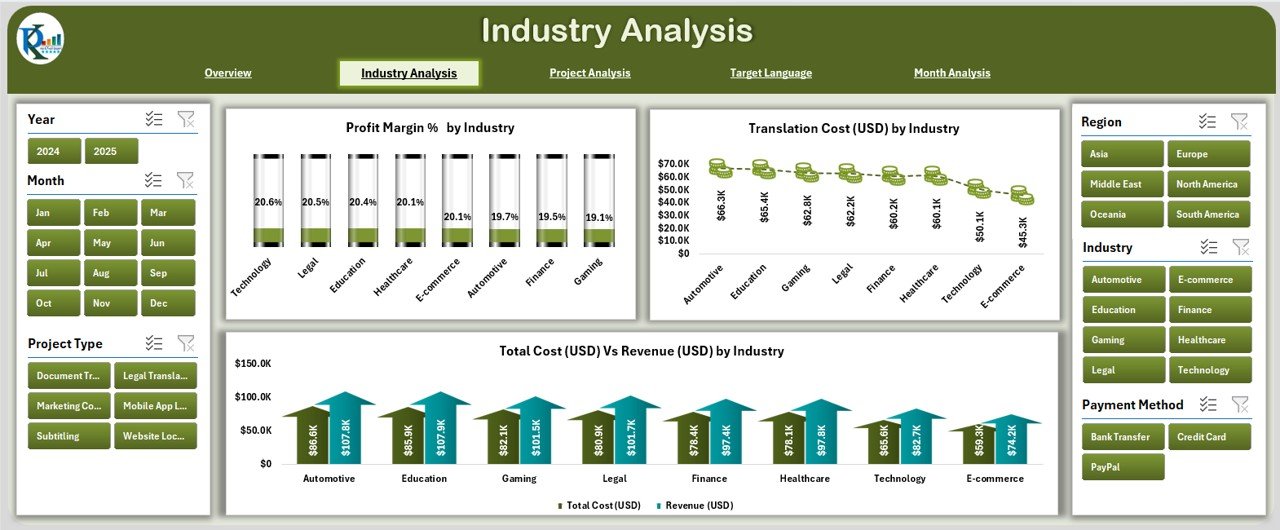
The Industry Analysis Page provides insights into how your translation performance varies across industries.
Charts Included:
- Profit Margin % by Industry – Evaluate which industries yield the highest margins.
- Translation Cost (USD) by Industry – Identify cost drivers and high-spending sectors.
- Total Cost (USD) vs Revenue (USD) by Industry – Measure profitability gaps across sectors.
This view is especially helpful for translation firms catering to multiple domains like legal, medical, technical, or marketing. By understanding which industries generate the most profit, you can strategically focus on high-value clients.
Click to Purchases Translation & Localization Dashboard in Excel
3️⃣ Project Analysis Page
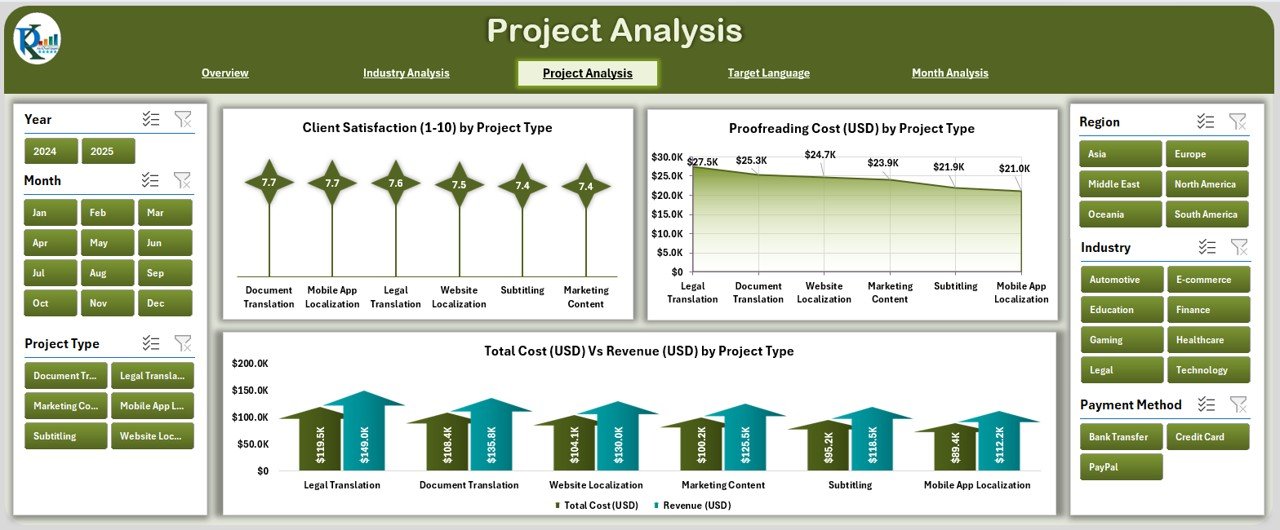
Every project is unique — with different scopes, deadlines, and budgets. The Project Analysis Page provides a project-specific breakdown of performance metrics.
Charts Included:
- Client Satisfaction (1–10) by Project Type – Gauge client happiness based on project categories.
- Proofreading Cost (USD) by Project Type – Track how much proofreading contributes to total cost.
- Total Cost (USD) vs Revenue (USD) by Project Type – Measure efficiency and profitability by project format (e.g., document translation, software localization, multimedia adaptation).
With this analysis, you can easily spot which project types perform well and which need better cost control.
4️⃣ Target Language Analysis Page
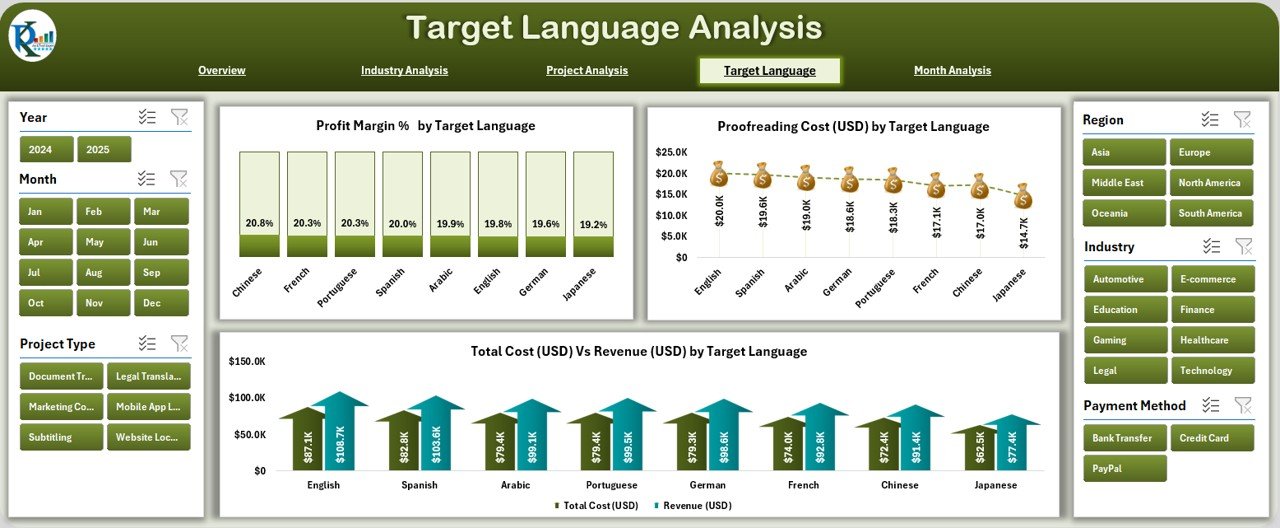
This section highlights how translation and proofreading costs vary by target language. It’s ideal for identifying cost-intensive or high-margin language pairs.
Charts Included:
- Profit Margin % by Target Language – Discover your most profitable translation destinations.
- Proofreading Cost (USD) by Target Language – Assess language-specific labor costs.
- Total Cost (USD) vs Revenue (USD) by Target Language – Compare cost-revenue balance by linguistic category.
Localization managers can use this data to refine pricing models, allocate resources efficiently, and negotiate better vendor rates.
5️⃣ Month Analysis Page
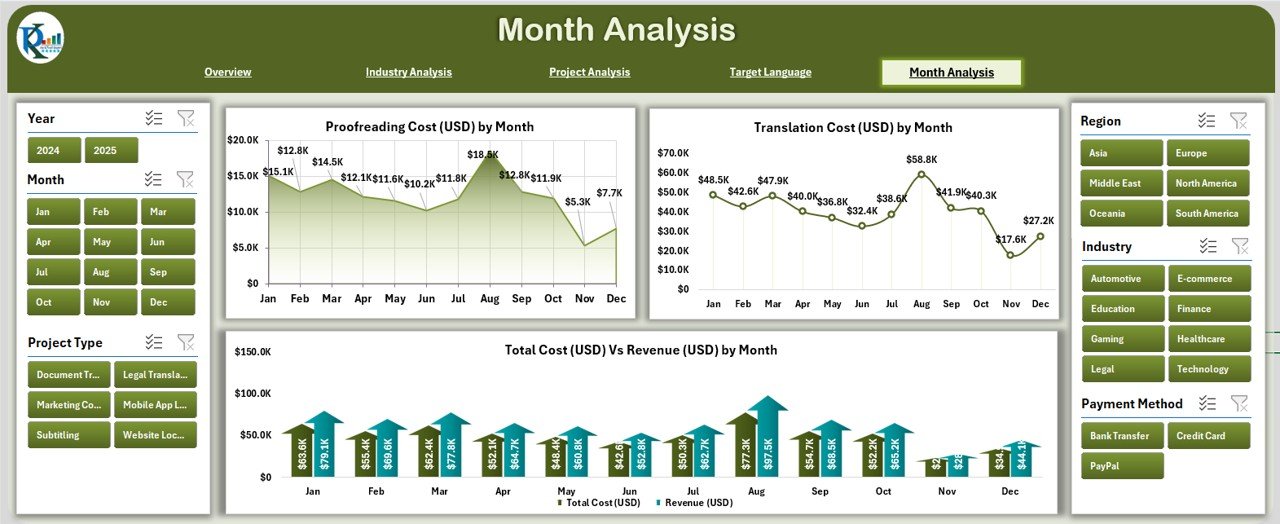
Seasonal performance is crucial in translation businesses. The Month Analysis Page tracks monthly trends to identify peak and low seasons.
Charts Included:
- Proofreading Cost (USD) by Month
- Total Cost (USD) vs Revenue (USD) by Month
- Translation Cost (USD) by Month
This helps you forecast workload, allocate resources efficiently, and maintain profitability throughout the year.
📊 Support Sheet & Data Sheet
The Support Sheet serves as a back-end reference for dropdown lists, slicers, and lookup values.
The Data Sheet stores all your raw project and financial data. Every chart and KPI in the dashboard pulls data dynamically from this sheet, ensuring accuracy and real-time updates.
Why Use a Translation & Localization Dashboard in Excel?
Translation projects often involve multiple currencies, languages, and workflows. Without a structured monitoring system, it’s easy to lose visibility over cost control, project timelines, or profitability. Here’s why using this dashboard is a game-changer:
📈 Centralized Data: Consolidate all translation project information in one workbook.
🔄 Dynamic Insights: Update charts automatically with new data entries.
💵 Cost Transparency: See exactly where your money goes in each project.
🧠 Smarter Decisions: Use data-driven insights to adjust pricing and resource allocation.
🕒 Time Efficiency: Replace manual calculations with automated summaries and visuals.
🎯 Goal Tracking: Compare actual performance against targets at any time.
How to Use the Translation & Localization Dashboard
Using this Excel dashboard is simple and intuitive:
-
Enter Data: Record your project details in the Data Sheet — including project type, source and target language, industry, costs, and revenue.
-
Refresh Pivots: Update pivot tables or slicers to pull the latest data.
-
Navigate Pages: Use the left-side navigator to jump between Overview, Industry, Project, Target Language, and Month Analysis.
-
Analyze Trends: Use slicers to filter by month, year, industry, or language for focused insights.
-
Take Action: Identify high-cost languages or underperforming industries and optimize your resource planning.
Real-World Applications
This dashboard is ideal for:
-
Translation Agencies – Monitor translator performance, client satisfaction, and profit margins.
-
Localization Companies – Track multi-language projects and cost per target market.
-
Freelance Translators – Manage personal projects and compare profitability across clients.
-
Corporate Teams – Analyze internal translation efforts for marketing, HR, or documentation.
By using this Excel tool, you bring clarity, accuracy, and strategic value to translation management.
Click to Purchases Translation & Localization Dashboard in Excel
Advantages of Translation & Localization Dashboard in Excel
Here are some key benefits of using this dashboard:
1. Centralized Project Tracking
Keep all project data — from costs to satisfaction scores — in one location, making analysis quick and simple.
2. Enhanced Financial Control
Monitor costs by project type, language, or industry, allowing you to minimize overspending and improve profit margins.
3. Improved Decision-Making
Data visualization makes it easy to spot patterns, evaluate ROI, and allocate resources more effectively.
4. Real-Time Reporting
Charts and pivot tables update automatically, ensuring that every insight you view is based on the latest data.
5. Customizable and Scalable
Because it’s built in Excel, you can add new KPIs, change visual themes, or integrate more datasets as your business grows.
🔍 Best Practices for the Translation & Localization Dashboard
To make the most of your dashboard, follow these best practices:
-
Maintain Data Consistency: Use standardized naming conventions for languages, industries, and projects.
-
Update Regularly: Refresh your data weekly or monthly to maintain accuracy.
-
Use Filters Wisely: Apply slicers to narrow analysis to relevant timeframes or clients.
-
Visual Clarity: Keep your charts clean and avoid overcrowding visuals.
-
Monitor KPIs: Track metrics like Profit Margin %, Paid Invoice %, and Client Satisfaction consistently.
-
Archive Old Data: Move past project data to separate sheets to maintain performance and speed.
-
Automate Where Possible: Use Excel formulas or VBA macros for faster data processing.
Following these steps ensures your dashboard stays functional, insightful, and easy to manage.
📊 Example Insights You Can Derive
-
Which languages bring the highest revenue with minimal cost.
-
Which industries have the highest translation demand.
-
How client satisfaction correlates with project types.
-
What months have the most translation activity.
-
Which projects experience the largest profit margins.
These insights can guide pricing strategies, staffing decisions, and business development initiatives.
💬 Conclusion
The Translation & Localization Dashboard in Excel bridges the gap between translation management and data analysis. It gives localization teams a powerful, structured way to track costs, performance, and profitability across multiple dimensions — industries, languages, projects, and time periods.
With its intuitive design, dynamic charts, and actionable insights, this dashboard is an essential tool for anyone managing multilingual content. Whether you’re an agency owner, translator, or project manager, this Excel template will help you streamline operations and grow profitably in the global marketplace.
❓ Frequently Asked Questions (FAQs)
1. What is the main purpose of a Translation & Localization Dashboard in Excel?
It helps users monitor financial, operational, and quality metrics of translation projects — allowing better decision-making through clear visual insights.
2. Can this dashboard be customized for my company’s needs?
Yes. You can easily modify sheets, add KPIs, change chart types, or include additional filters depending on your business model.
3. How often should I update the data?
It’s best to update your data weekly or after each project completion to maintain accurate performance tracking.
4. Do I need advanced Excel skills to use it?
Not at all. The dashboard is fully automated and user-friendly, requiring only basic Excel knowledge to enter data and refresh visuals.
5. Can I share this dashboard with my team?
Yes, you can share it via OneDrive, Google Drive, or as an Excel file on your network. Team members can view insights and track KPIs collaboratively.
6. What kind of charts are included?
The dashboard includes multiple visualizations such as bar charts, line graphs, and combo charts for comparing revenue, cost, and profit across various dimensions.
7. How does this dashboard help improve client satisfaction?
By tracking client satisfaction scores and project performance, it helps identify areas needing quality improvement, ensuring consistently high service delivery.
Visit our YouTube channel to learn step-by-step video tutorials