Transportation teams often track delivery performance, fleet efficiency, cost control, safety, service reliability, and customer commitments in separate monthly files. The problem is not always lack of data; it is the time spent turning that data into a consistent KPI review. The Transportation KPI Dashboard in Excel gives you a structured workbook for MTD and YTD reporting, target comparison, previous-year benchmarking, and KPI trend analysis in one ready-to-use template.
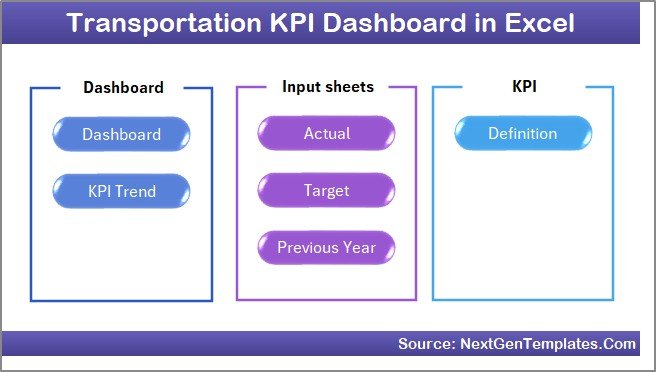
The workbook includes 7 worksheets: Home, Dashboard, KPI Trend, Actual Numbers Input, Target, Previous Year Number, and KPI Definition. Once the input sheets are updated, users can select the month on the Dashboard sheet and review Actual, Target, Previous Year, Target vs Actual, and PY vs Actual in one view.
If you are new to structured Excel reporting, Microsoft’s guide to creating and working with Excel workbooks is a useful starting reference.
Key Features of Transportation KPI Dashboard in Excel
- 7-sheet workbook flow: navigation, dashboard reporting, trend review, input sheets, and KPI definitions are separated clearly.
- Month-based dashboard control: select the month from the dropdown on the Dashboard sheet and the visible KPI numbers update for that period.
- MTD and YTD tracking: review both short-term monthly progress and cumulative year-to-date performance.
- Actual, Target, and Previous Year values: compare current results against planned targets and historical performance.
- Conditional formatting arrows: quickly identify positive or negative movement in Target vs Actual and PY vs Actual comparisons.
- KPI Trend page: select one KPI and review its group, unit, type, formula, definition, and trend charts.
- Editable KPI Definition sheet: document KPI formulas and business meaning so everyone uses the same metric logic.
Dashboard Pages Explanation
1 – Home Sheet
The Home sheet works as the workbook index. It includes six navigation buttons so users can jump to the main Dashboard, KPI Trend page, Actual Numbers Input, Target sheet, Previous Year sheet, or KPI Definition sheet without scrolling through tabs manually.
2 – Dashboard Sheet
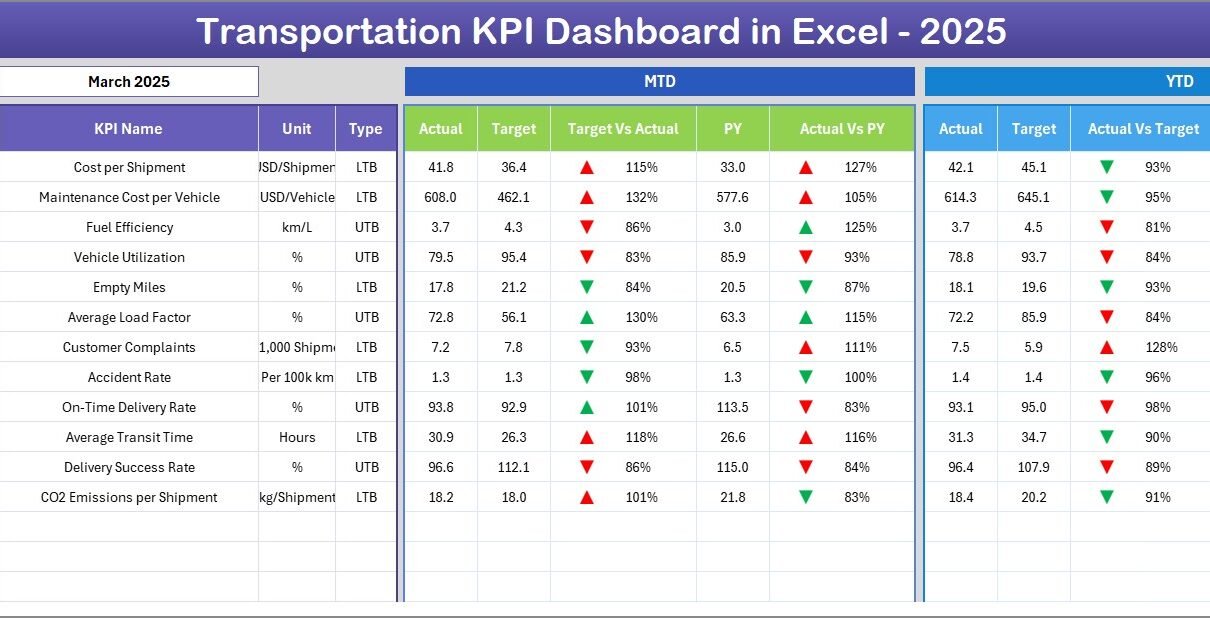
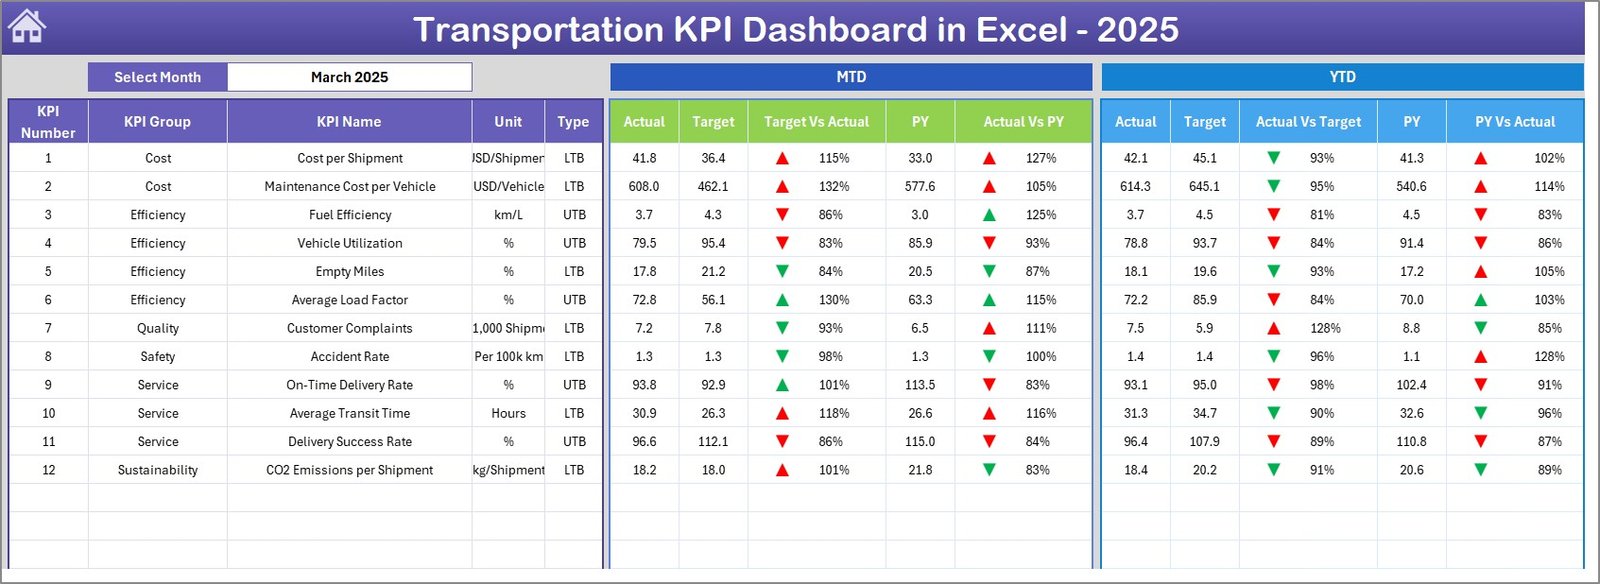
The Dashboard sheet is the main KPI review page. Cell D3 contains the month dropdown. When the month changes, the dashboard displays MTD Actual, Target, Previous Year, Target vs Actual, and PY vs Actual. It also displays YTD Actual, Target, Previous Year, Target vs Actual, and PY vs Actual. The arrow formatting is useful in monthly review meetings because managers can see which KPIs need attention before reading every number.
3 – KPI Trend Sheet
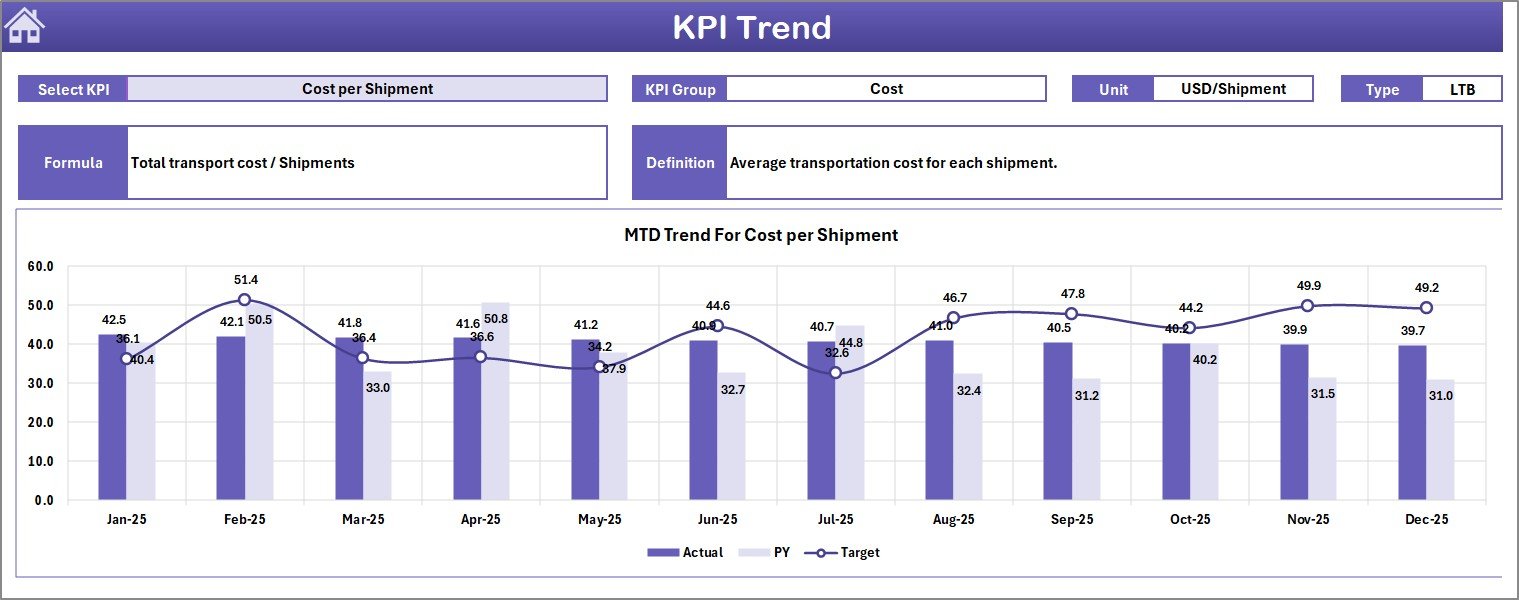
The KPI Trend sheet is built for deeper review of one selected KPI. Use the dropdown in cell C3 to choose the KPI name. The sheet then shows the KPI group, unit, KPI type, formula, and definition. It also includes MTD and YTD trend charts for Actual, Target, and Previous Year numbers, which helps users understand whether a KPI is improving, worsening, or moving seasonally.
4 – Actual Numbers Input Sheet
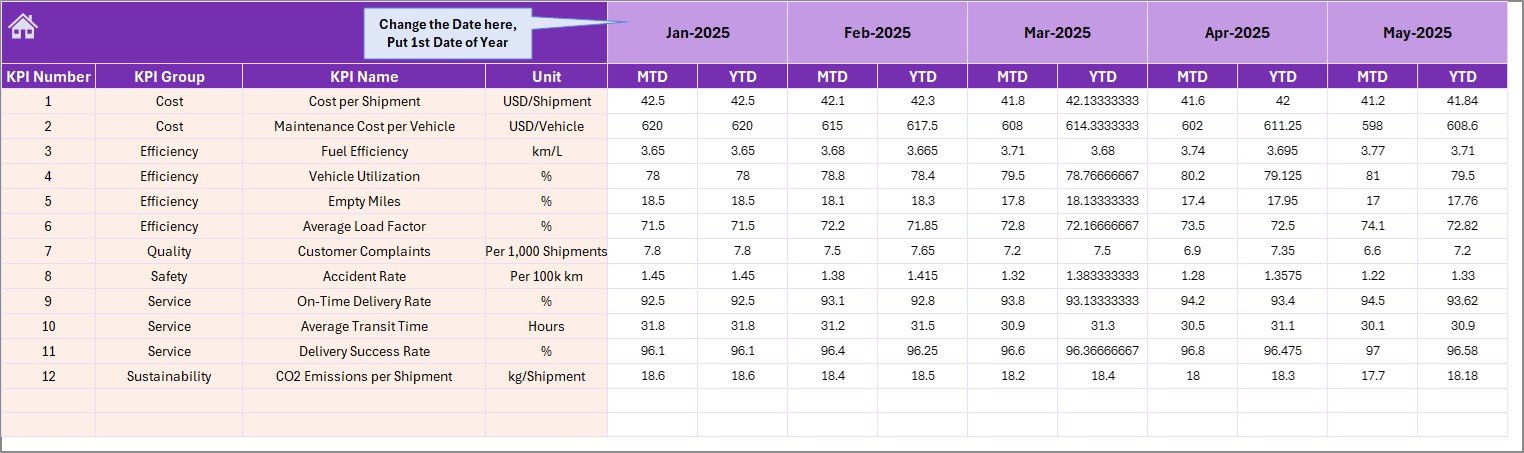
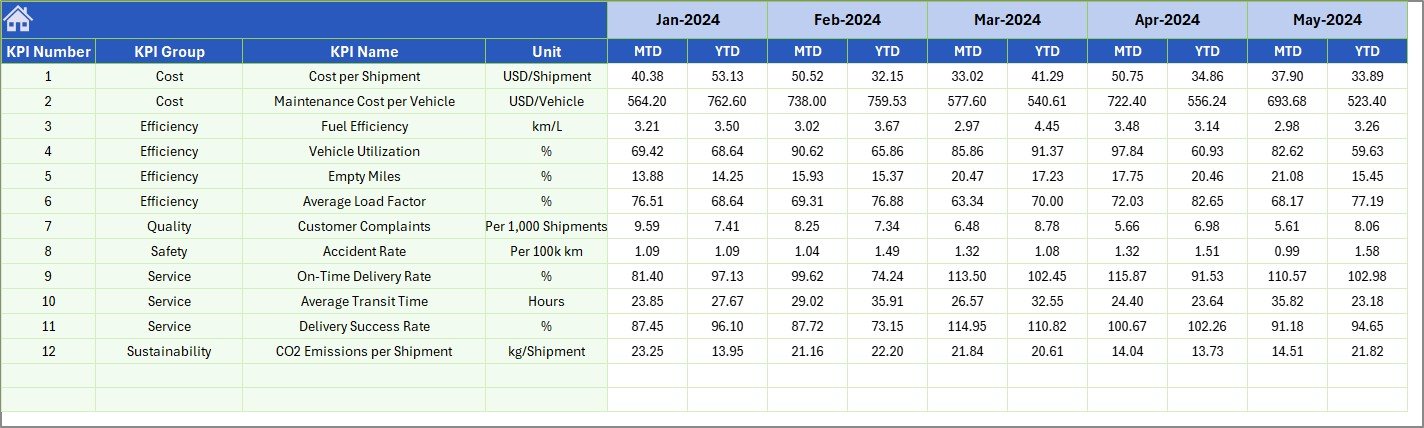
The Actual Numbers Input sheet is where users enter actual transportation KPI values for MTD and YTD. Cell E1 controls the first month of the year, making the workbook adaptable to different reporting years. This sheet keeps actual performance data separate from targets and definitions, which reduces confusion when several people maintain the file.
5 – Target Sheet
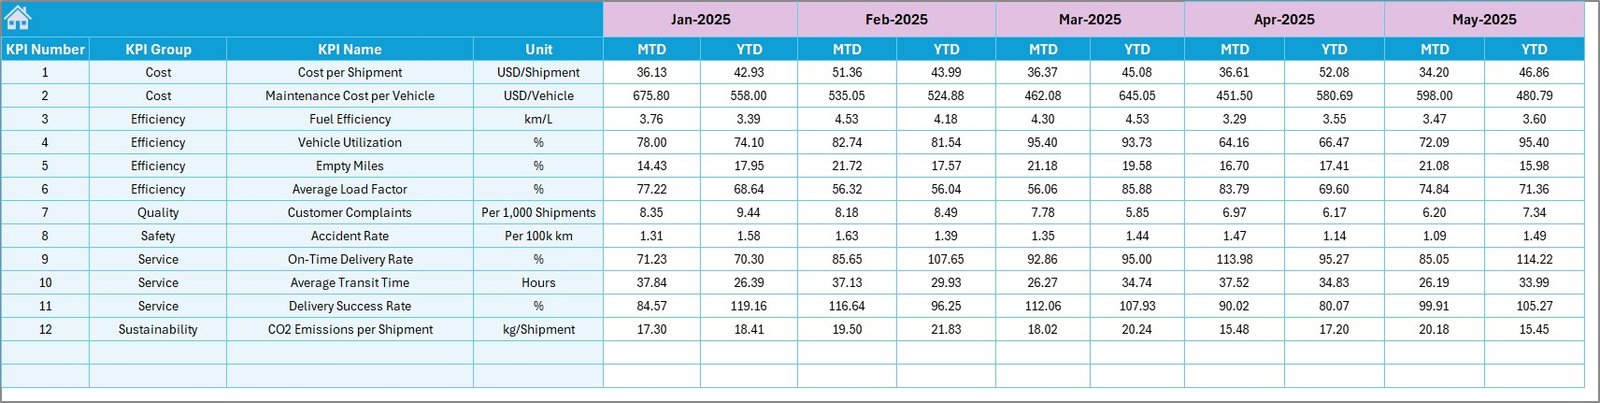
The Target sheet stores the expected KPI values for every month. Users can enter both MTD and YTD targets. These values feed the dashboard variance comparisons, so transport managers can review performance against plan rather than only against last month.
6 – Previous Year Number Sheet
The Previous Year Number sheet stores the same KPI structure for last year’s performance. This is important for transportation teams because many metrics are seasonal. Comparing current numbers with previous-year values can reveal whether performance is genuinely improving or simply following normal monthly patterns.
7 – KPI Definition Sheet
The KPI Definition sheet is the governance tab. It stores KPI Name, KPI Group, Unit, Formula, Definition, and KPI type. KPI type is especially useful because some metrics are better when higher, while others are better when lower. For example, on-time delivery percentage is usually higher-the-better, while cost per mile or delay rate may be lower-the-better.

Transportation KPI Dashboard in Excel vs. Google Sheets vs. Paid Transport SaaS – Feature Comparison
| Feature | This Excel dashboard | Google Sheets alternative | Paid transport SaaS |
|---|---|---|---|
| Cost | $14.99 sale price | Template or manual build cost | Recurring subscription |
| Platform | Microsoft Excel | Browser-based Google Sheets | Vendor-hosted app |
| Setup time | Enter KPI values and select month | Similar if prebuilt | Onboarding and configuration required |
| MTD and YTD reporting | Included | Depends on template | Depends on module |
| Previous-year comparison | Included | Depends on template | Often plan-dependent |
| Custom KPI definitions | Editable sheet | Editable sheet | Limited by vendor fields |
| Year-1 cost at 5 users | One-time template cost before Microsoft licensing | Template plus Workspace if applicable | Often hundreds or thousands |
| Live GPS or dispatch | Not included | Not included | Often included in specialist tools |
Who Should Use This Template
This template is useful for transportation managers, logistics coordinators, fleet analysts, supply chain reporting teams, operations managers, and small businesses that already track KPI values in Excel. It is also useful for consultants and students who need a clean KPI dashboard structure for transportation reporting.
It is not designed to replace live GPS tracking, dispatch software, route optimization, electronic logging devices, accounting systems, or transport compliance platforms. It is a reporting workbook for KPI review.
Real-World Use Cases
Anita, transportation operations manager: updates actual numbers before the weekly review and uses the Dashboard sheet to identify KPIs that missed target.
Marcus, fleet analyst: selects one KPI on the Trend sheet and compares MTD and YTD movement against previous-year performance.
Priya, supply chain reporting lead: maintains KPI formulas and definitions so different regions report cost, service, and efficiency metrics consistently.
Advantages of Transportation KPI Dashboard in Excel
- It keeps KPI definitions, targets, actuals, and previous-year data separate.
- It gives managers both MTD and YTD views instead of forcing one reporting window.
- It supports better KPI governance because formulas and definitions are documented in the file.
- It is editable, so teams can adjust KPI names and targets to match their operation.
- It works as a one-time template rather than a recurring dashboard subscription.
Opportunities for Improvement
Advanced teams can extend the workbook by adding Power Query imports, more KPI groups, a separate data validation sheet, automated monthly locking, or additional charts for fleet, route, cost, safety, or service-level KPIs. Larger organizations may also connect the workbook to a database or Power BI model once their KPI process matures.
Best Practices
- Keep KPI names consistent between the Definition, Actual, Target, and Previous Year sheets.
- Define whether each KPI is higher-the-better or lower-the-better before interpreting arrows.
- Update actuals and targets on a fixed reporting schedule.
- Review previous-year numbers for seasonality before judging performance.
- Keep a backup copy before making structural changes to formulas or sheets.
Explore Relevant Templates
- Transportation KPI Dashboard in Excel
- Transportation Services KPI Dashboard in Excel
- Logistics and Transportation Hub
- School Transportation Services Dashboard in Excel
Frequently Asked Questions
What does the Transportation KPI Dashboard in Excel include?
It includes 7 sheets: Home, Dashboard, KPI Trend, Actual Numbers Input, Target, Previous Year Number, and KPI Definition.
Can I select a month on the dashboard?
Yes. The Dashboard sheet has a month dropdown in cell D3, and the dashboard numbers change for the selected month.
Does it support both MTD and YTD?
Yes. It supports MTD and YTD Actual, Target, Previous Year, Target vs Actual, and PY vs Actual views.
Can I define my own KPIs?
Yes. The KPI Definition sheet lets you enter KPI name, group, unit, formula, definition, and KPI type.
Does this template include live fleet tracking?
No. It is an Excel KPI dashboard for reporting. It does not provide GPS, dispatch, telematics, or route optimization features.
Is it a subscription?
No. It is a one-time downloadable Excel template.
About the Author
Built by PK – Microsoft Certified Professional with 15+ years of Excel, Google Sheets, and Power BI experience. Founder of NextGenTemplates, reaching 300K+ subscribers across YouTube channels. Every template is hand-built and tested before release.
Conclusion
The Transportation KPI Dashboard in Excel is a practical workbook for teams that need structured transport KPI reporting without building a new dashboard every month. It brings together MTD and YTD actuals, targets, previous-year values, variance arrows, KPI trends, and metric definitions in one editable Excel file.
Click here to purchase Transportation KPI Dashboard in Excel
Visit youtube.com/@PKAnExcelExpert for step-by-step Excel tutorials.