Managing treasury operations has become more complex than ever. Organizations handle cash flows, liquidity, debt, investments, and financial risks on a daily basis. Therefore, treasury teams need clear visibility, timely insights, and accurate performance tracking to support strategic decisions. However, when treasury data remains scattered across spreadsheets and reports, performance monitoring becomes slow and unreliable.
That is exactly where a Treasury Operations KPI Dashboard in Power BI becomes an essential and powerful solution.
In this detailed, SEO-friendly article, you will learn what a Treasury Operations KPI Dashboard in Power BI is, why it is important, how it works, its page-wise structure, key features, advantages, opportunities for improvement, best practices, and frequently asked questions. Moreover, this article uses simple language, active voice, and practical explanations so that finance professionals can easily understand and implement it.
Click to Purchases Treasury Operations KPI Dashboard in Power BI
What Is a Treasury Operations KPI Dashboard in Power BI?
A Treasury Operations KPI Dashboard in Power BI is a centralized reporting and analytics tool designed to track, monitor, and analyze key treasury-related performance indicators in a single interactive dashboard.
Instead of reviewing multiple spreadsheets and manual reports, this dashboard brings actuals, targets, and historical data together in one visual interface. As a result, treasury managers and leadership teams gain instant clarity on operational performance, target achievement, and year-over-year trends.
Moreover, this dashboard uses Power BI for visualization and Excel as the data source, which makes it both powerful and easy to maintain.
Why Do Organizations Need a Treasury Operations KPI Dashboard?
Treasury operations directly impact an organization’s financial stability. Therefore, teams must track performance continuously rather than react after issues arise.
Without a structured dashboard:
-
Cash and liquidity KPIs remain unclear
-
Target deviations stay unnoticed
-
Month-end reporting consumes too much time
-
Decisions rely on assumptions instead of data
However, with a Treasury Operations KPI Dashboard in Power BI, organizations can:
-
Monitor MTD and YTD treasury performance
-
Compare actuals against targets and previous years
-
Identify inefficiencies early
-
Improve financial discipline and control
As a result, treasury teams move from reactive reporting to proactive management.
Click to Purchases Treasury Operations KPI Dashboard in Power BI
How Does a Treasury Operations KPI Dashboard in Power BI Work?
This dashboard follows a simple and efficient data flow.
First, users enter treasury KPI data into structured Excel sheets. Then, Power BI connects to the Excel file and transforms the data into interactive visuals.
The working process looks like this:
-
Enter Actual KPI values in Excel
-
Enter Target KPI values in Excel
-
Define KPIs and formulas in the KPI Definition sheet
-
Refresh the Power BI dashboard
-
Analyze insights using slicers, tables, and charts
Because of this approach, users do not need advanced technical skills to operate the dashboard.
What Is the Data Source for This Treasury Dashboard?
The primary data source for this dashboard is an Excel file. This design keeps the system flexible, transparent, and user-friendly.
The Excel file contains three structured worksheets.
1) Input_Actual Sheet – How Do You Capture Actual Performance?
In the Input_Actual sheet, users enter:
-
KPI Name
-
Month (use the first date of the month)
-
Actual CY MTD value
-
Actual CY YTD value
This sheet represents the real performance of treasury operations.
2) Input_Target Sheet – How Do You Define Targets?
In the Input_Target sheet, users enter:
-
KPI Name
-
Month (first date of the month)
-
Target CY MTD value
-
Target CY YTD value
This sheet defines expected performance benchmarks.
3) KPI Definition Sheet – How Do You Maintain KPI Clarity?
The KPI Definition sheet provides structure and meaning to the data. Here, users enter:
-
KPI Number
-
KPI Group
-
KPI Name
-
Unit of Measurement
-
Formula
-
KPI Definition
-
KPI Type (LTB or UTB)
Because of this sheet, every stakeholder clearly understands what each KPI measures and how it works.
What Pages Are Included in the Treasury Operations KPI Dashboard in Power BI?
This dashboard includes three well-designed pages, each serving a specific analytical purpose.
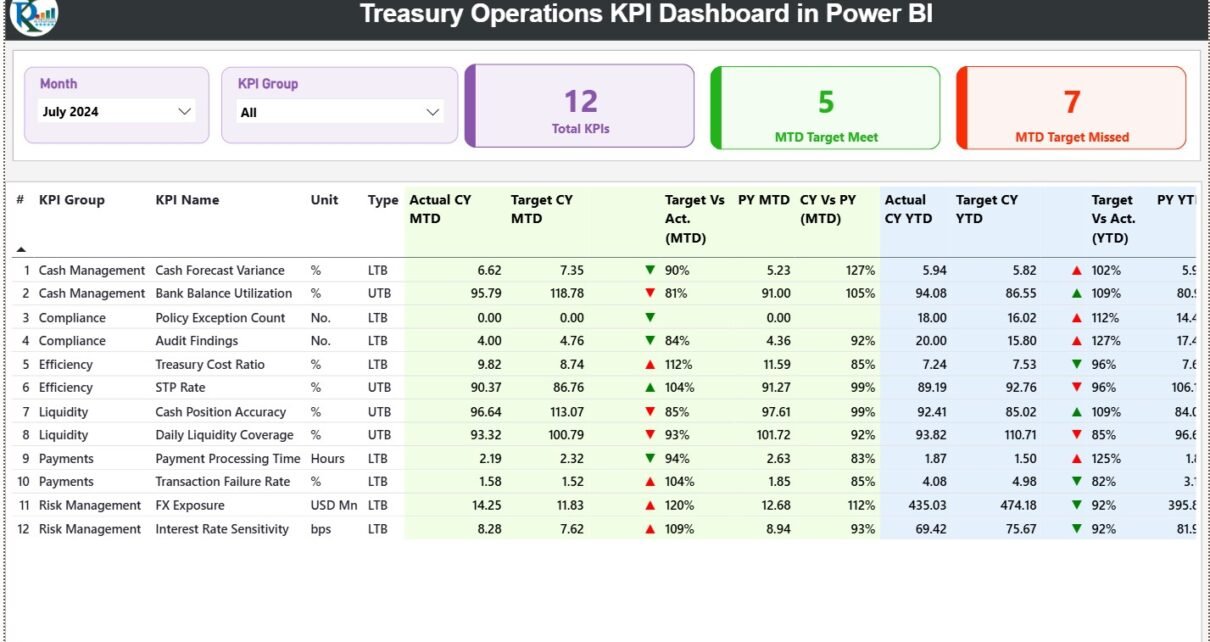
1) Summary Page – How Do You Get a Complete Performance Snapshot?
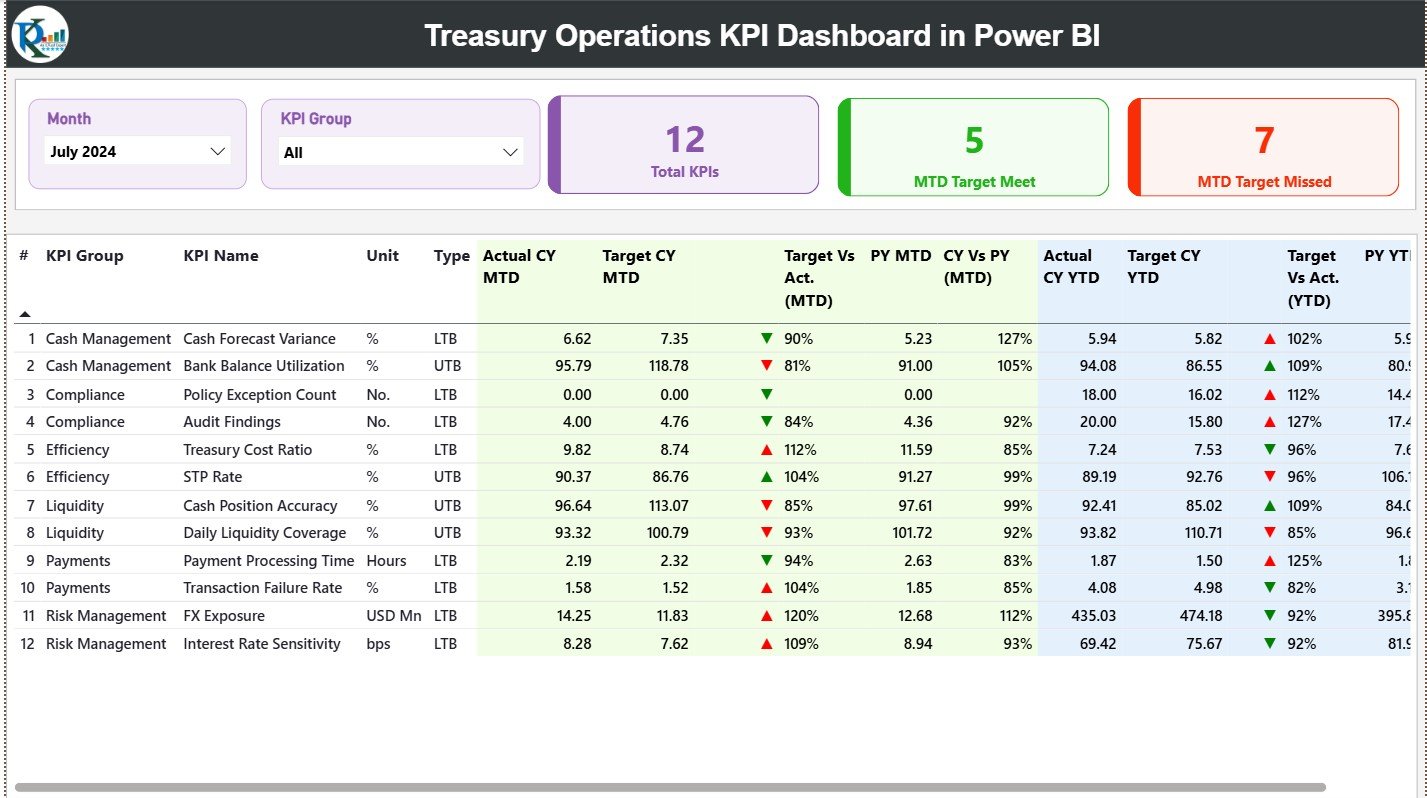
The Summary Page acts as the central overview of treasury performance.
Slicers Available on the Summary Page
At the top of the dashboard, users can filter data using:
-
Month slicer
-
KPI Group slicer
Once users adjust these slicers, the entire dashboard updates instantly.
KPI Cards on the Summary Page
The dashboard displays three high-level KPI cards:
-
Total KPIs Count
-
MTD Target Met Count
-
MTD Target Missed Count
These cards provide an immediate understanding of treasury performance health.
Detailed Treasury KPI Performance Table
Below the KPI cards, a detailed table shows comprehensive KPI-level data.
General KPI Information
-
KPI Number – Sequential identifier
-
KPI Group – Category of the KPI
-
KPI Name – Name of the KPI
-
Unit – Unit of measurement
-
Type – LTB (Lower the Better) or UTB (Upper the Better)
MTD Performance Columns
-
Actual CY MTD
-
Target CY MTD
-
MTD Status Icon (▲ / ▼) with green and red indicators
-
Target vs Actual (MTD)
-
Formula:
Actual MTD / Target MTD
-
-
PY MTD
-
CY vs PY (MTD)
-
Formula:
CY MTD / PY MTD
-
YTD Performance Columns
-
Actual CY YTD
-
Target CY YTD
-
YTD Status Icon (▲ / ▼) with visual indicators
-
Target vs Actual (YTD)
-
Formula:
Actual YTD / Target YTD
-
-
PY YTD
-
CY vs PY (YTD)
-
Formula:
CY YTD / PY YTD
-
Because of this layout, users can analyze short-term and long-term treasury performance together.
Click to Purchases Treasury Operations KPI Dashboard in Power BI
2) KPI Trend Page – How Can You Track Treasury Trends Over Time?
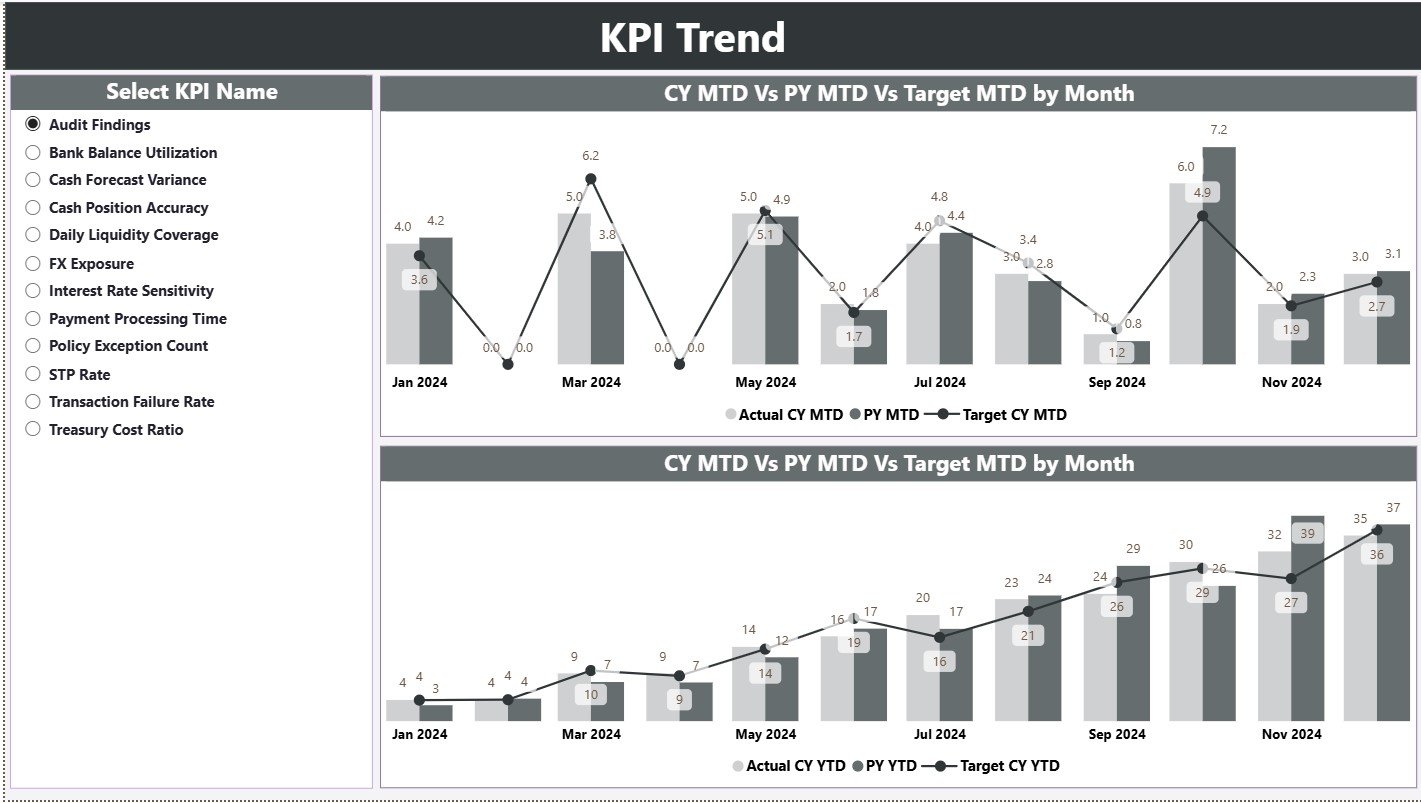
The KPI Trend Page focuses on trend analysis and performance movement.
What Does This Page Show?
This page displays two combo charts:
-
MTD Trend Chart – Actual CY, PY, and Target
-
YTD Trend Chart – Actual CY, PY, and Target
These charts clearly highlight performance direction and consistency.
KPI Selection Slicer
A slicer on the left allows users to select a specific KPI name.
Once selected:
-
Both charts update instantly
-
Users can identify seasonality
-
Teams can compare current trends with historical performance
3) KPI Definition Page – Where Can Users See KPI Logic?

The KPI Definition Page works as a drill-through page.
Key Characteristics
-
The page remains hidden from the main navigation
-
Users can drill through from the Summary Page
-
The page shows KPI Formula and Definition
A Back button on the top-left corner allows smooth navigation back to the Summary Page.
Click to Purchases Treasury Operations KPI Dashboard in Power BI
What Makes the Treasury Operations KPI Dashboard in Power BI Effective?
This dashboard combines:
-
Structured treasury KPI logic
-
Target vs Actual performance analysis
-
MTD and YTD tracking
-
Previous Year comparisons
-
Excel-based data input
-
Interactive Power BI visuals
As a result, it delivers both operational control and strategic insight.
Advantages of Treasury Operations KPI Dashboard in Power BI
Implementing this dashboard provides several tangible benefits.
✅ Advantages
-
Centralized treasury performance monitoring
-
Clear visibility into MTD and YTD results
-
Early identification of target deviations
-
Improved liquidity and cash management control
-
Reduced manual reporting effort
-
Better coordination between finance and treasury teams
-
Consistent KPI definitions across the organization
-
Faster and more confident decision-making
Opportunities for Improvement in Treasury Operations KPI Dashboard
Click to Purchases Treasury Operations KPI Dashboard in Power BI
Although this dashboard offers strong functionality, organizations can enhance it further.
🔹 Opportunities for Improvement
-
Add cash flow forecasting KPIs
-
Include liquidity risk indicators
-
Introduce currency exposure analysis
-
Add daily or weekly granularity
-
Enable automated alerts for threshold breaches
-
Integrate bank statement or ERP data
These enhancements can provide deeper insights into treasury risk and efficiency.
Best Practices for the Treasury Operations KPI Dashboard in Power BI
Following best practices ensures long-term success and accuracy.
⭐ Best Practices
-
Define KPIs clearly and avoid ambiguity
-
Maintain clean and validated Excel data
-
Update Actual and Target data on a regular schedule
-
Use LTB and UTB logic consistently
-
Review KPI relevance periodically
-
Limit KPIs to what truly matters
-
Train users on slicers and drill-through features
-
Perform monthly dashboard reviews
When teams follow these practices, dashboard adoption and value increase significantly.
Click to Purchases Treasury Operations KPI Dashboard in Power BI
Who Should Use a Treasury Operations KPI Dashboard in Power BI?
This dashboard supports multiple roles within an organization.
Ideal Users
-
Treasury Managers
-
Finance Controllers
-
Cash Management Teams
-
Risk Management Professionals
-
CFOs and Finance Leaders
-
Business Analysts
Because of its flexible design, both mid-sized companies and large enterprises can use it effectively.
How Does This Dashboard Improve Treasury Decision-Making?
This dashboard improves decisions by:
-
Providing real-time performance visibility
-
Highlighting risks before they escalate
-
Supporting data-driven treasury strategies
-
Improving accountability across KPI owners
As a result, treasury operations become more controlled, transparent, and efficient.
Conclusion
A Treasury Operations KPI Dashboard in Power BI transforms complex treasury data into clear, actionable insights. By combining structured Excel data with interactive Power BI visuals, this dashboard enables organizations to track MTD and YTD performance, compare actuals against targets, and analyze year-over-year trends.
Moreover, it reduces manual reporting, improves governance, and supports smarter financial decisions. Whether you manage daily treasury operations or oversee enterprise-level financial performance, this dashboard serves as a reliable control panel for treasury success.
Click to Purchases Treasury Operations KPI Dashboard in Power BI
Frequently Asked Questions (FAQs)
1) What is the purpose of a Treasury Operations KPI Dashboard in Power BI?
It helps organizations monitor, analyze, and control treasury KPIs in a centralized and visual format.
2) Do I need Power BI expertise to use this dashboard?
No. You only need to update the Excel data and refresh the dashboard.
3) Can I track both MTD and YTD treasury performance?
Yes. The dashboard supports both MTD and YTD analysis.
4) Does the dashboard support previous year comparison?
Yes. It includes CY vs PY comparisons for MTD and YTD.
5) Can I customize KPIs and KPI groups?
Absolutely. You can edit them directly in the KPI Definition sheet.
6) Is this dashboard suitable for enterprise-level treasury teams?
Yes. The design scales easily with more KPIs and data.
7) Can this dashboard integrate with other data sources?
Currently, it uses Excel. However, you can extend it to ERP or banking systems.
Click to Purchases Treasury Operations KPI Dashboard in Power BI
Visit our YouTube channel to learn step-by-step video tutorials