Urban infrastructure plays a major role in the growth, safety, and comfort of any city. Roads, water supply, waste management, public transport, power distribution, and community services must work smoothly to support citizens every day. However, many city teams still track their performance using scattered spreadsheets, manual reports, or outdated tools. Because of this, they face delays, errors, and poor decision-making.
To solve this, an Urban Infrastructure KPI Dashboard in Excel gives you a smart, organized, and real-time way to monitor all infrastructure activities. You get one place to view key metrics, understand trends, compare performance, and act faster. This article explains everything about this dashboard—what it includes, how it works, why it matters, and how city teams can use it to improve performance.
Let us explore this powerful Excel-based tool in detail.
Click to Purchases Urban Infrastructure KPI Dashboard in Excel
What Is an Urban Infrastructure KPI Dashboard in Excel?
An Urban Infrastructure KPI Dashboard in Excel is a ready-to-use template that helps city organizations track key performance indicators (KPIs) related to urban services. It brings all important data—monthly targets, actual numbers, year-to-date values, past performance, and trends—into one easy-to-understand dashboard.
You can select any month from the dropdown, and the entire dashboard updates immediately. This dynamic design helps city planners, municipal corporations, and infrastructure managers make faster and more confident decisions.
Because it runs in Excel, the dashboard remains simple, flexible, and cost-friendly. You don’t need any advanced software or coding. You only enter your numbers and the dashboard takes care of the rest.
Click to Purchases Urban Infrastructure KPI Dashboard in Excel
Key Features of the Urban Infrastructure KPI Dashboard
This Urban Infrastructure KPI Dashboard includes 7 powerful worksheets, each designed to make data entry, analysis, and visualization simple and efficient. Here is a detailed overview:
1. Home Sheet: Easy Navigation for All Users

The Home sheet works like an index page.
Here, six well-designed buttons allow you to switch quickly to different sheets.
New users always find it easy to navigate because the Home sheet keeps everything organized.
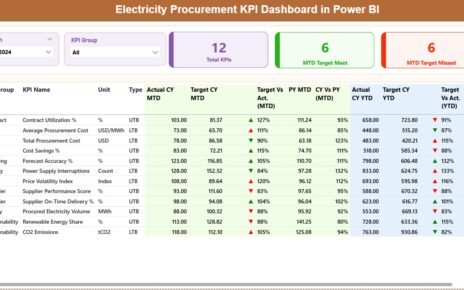
2. Dashboard Sheet: The Main Control Center

The Dashboard sheet is the heart of the entire file.
You can select the month using a dropdown available in cell D3, and all KPI visuals update instantly.
The dashboard shows:
MTD (Month-to-Date) Section
-
MTD Actual
-
MTD Target
-
MTD Previous Year
-
Target vs Actual comparison
-
Previous Year vs Actual comparison
-
Automatic conditional formatting with up/down arrows
YTD (Year-to-Date) Section
-
YTD Actual
-
YTD Target
-
YTD Previous Year
-
YTD Target vs Actual
-
YTD Previous Year vs Actual
-
Up/down arrow visualization for deeper insights
This view helps you understand if your current month and yearly progress are moving in the right direction.
Click to Purchases Urban Infrastructure KPI Dashboard in Excel
3. KPI Trend Sheet: Full Visibility on Individual KPIs

The KPI Trend sheet offers a deeper look into each KPI.
You select a KPI name from the dropdown at cell C3, and the sheet displays:
-
KPI Group
-
KPI Unit
-
KPI Type (Upper the Better or Lower the Better)
-
KPI Formula
-
KPI Definition
Below this information, you will find two trend charts:
-
MTD Trend Chart
-
YTD Trend Chart
These charts show Actual, Target, and Previous Year values.
This helps you spot performance patterns and long-term improvements.
Click to Purchases Urban Infrastructure KPI Dashboard in Excel
4. Actual Numbers Input Sheet: Enter Monthly Performance Easily

This sheet is for entering monthly actual numbers.
You only need to enter the first month of the year in cell E1, and the sheet adjusts automatically.
This makes the process simple, fast, and reliable.
5. Target Sheet: Input Targets for MTD and YTD

In this sheet, you enter monthly targets for every KPI.
You can update MTD and YTD target values for better planning and forecasting.
6. Previous Year Numbers Sheet: Compare with the Past

Enter actual values for the previous year, similar to current year.
This data helps you compare performance with last year’s numbers and see improvements.
Click to Purchases Urban Infrastructure KPI Dashboard in Excel
7. KPI Definition Sheet: Clear Understanding of Every KPI

This sheet stores all important information about each KPI:
-
KPI Name
-
KPI Group
-
KPI Unit
-
KPI Formula
-
KPI Definition
This ensures clarity and makes the dashboard more valuable for training, presentations, and reviews.
Click to Purchases Urban Infrastructure KPI Dashboard in Excel
Why Do Cities Need an Urban Infrastructure KPI Dashboard?
Urban infrastructure grows complex every year.
City managers must deal with increasing population, traffic, pollution, waste generation, water demand, and more.
Without a structured monitoring system, teams face many problems, such as:
-
Delayed decision-making
-
Poor resource allocation
-
Difficulty tracking progress
-
Inability to detect issues early
-
Lack of clarity during reviews
A KPI dashboard brings all this information together in a simple and visual format.
What KPIs Can You Track Using This Dashboard?
Urban infrastructure involves many departments.
This dashboard can track KPIs such as:
Transportation
-
Road maintenance completion rate
-
Streetlight uptime
-
Bus availability
-
Traffic congestion hours
Water Supply
-
Daily water production
-
Leakage percentage
-
Water quality score
Waste Management
-
Solid waste collected
-
Waste segregation percentage
-
Recycling efficiency
Public Health & Safety
-
Emergency response time
-
Public complaints resolved
-
Street cleanliness rating
Energy and Utilities
-
Power outage duration
-
Power distribution efficiency
Environment
-
Air quality index
-
Green cover maintenance
Because the dashboard is fully customizable, you can add or modify any KPI as required.
Click to Purchases Urban Infrastructure KPI Dashboard in Excel
Advantages of an Urban Infrastructure KPI Dashboard in Excel
Using this dashboard offers many practical benefits. Here are the major advantages:
1. Faster and Better Decision-Making
You get real-time visibility on monthly and yearly performance.
This helps leaders take quick action when something goes wrong.
2. Simple and Cost-Effective
The dashboard runs in Excel, so no advanced software is required.
3. Easy to Customize
You can add new KPIs, change formulas, update visuals, or modify sheet names.
4. Professional and Clean Design
Users find it easy to understand performance at a glance because of the clear layout.
5. Historical Comparison
You can compare current numbers with previous year data.
This helps identify improvements or gaps.
6. Better Team Collaboration
Different departments can update their numbers regularly, keeping everyone aligned.
7. Clear Trend Analysis
Trend charts for both MTD and YTD show performance direction clearly.
8. Helps with Planning and Forecasting
Target vs actual analysis supports better planning for city operations.
Click to Purchases Urban Infrastructure KPI Dashboard in Excel
How Does the Urban Infrastructure KPI Dashboard Improve Performance?
This dashboard improves performance in many ways:
1. It shows deviations quickly
If actual numbers fall below target, the dashboard highlights the issue.
2. It supports quality reviews
Monthly review meetings become easier with accurate visual insights.
3. It builds transparency
Leaders get a clear picture of how each department performs.
4. It increases accountability
Every department knows what to monitor and improve.
How to Use the Urban Infrastructure KPI Dashboard in Excel?
Here is a simple step-by-step process to use this dashboard:
Step 1: Update KPI Definitions
Go to the KPI Definition sheet and enter the details for all KPIs.
Step 2: Enter Target Values
Input monthly and yearly targets in the Target Sheet.
Step 3: Enter Previous Year Numbers
Copy last year’s performance data into the Previous Year sheet.
Step 4: Enter Current Year Actuals
Update actual numbers each month in the Actual Numbers Input sheet.
Step 5: Select the Month
Go to the Dashboard sheet and select any month from the dropdown.
Step 6: Analyze Performance
Study the MTD and YTD visuals to understand improvements or issues.
Step 7: Review KPI Trends
Use the KPI Trend sheet to understand long-term patterns.
Click to Purchases Urban Infrastructure KPI Dashboard in Excel
Best Practices for Using the Urban Infrastructure KPI Dashboard
To get maximum value, follow these best practices:
1. Keep KPI List Clear and Meaningful
Choose KPIs that connect directly with your city goals.
2. Update Actual Numbers Regularly
Enter accurate MTD and YTD values on time.
3. Review Trends Each Month
Use trend charts to fix problems early.
4. Compare with Previous Year
This helps measure real growth.
5. Train All Team Members
Every department should understand how to use the dashboard.
6. Avoid Overloading the Dashboard
Keep it clean and simple for better readability.
7. Use Conditional Formatting Wisely
Visual cues such as arrows and colors improve clarity.
8. Perform Monthly Review Meetings
Discuss results and plan action steps.
Conclusion
Urban infrastructure plays a critical role in every city’s progress. When teams manage activities without proper tracking tools, they face delays, errors, and poor planning. An Urban Infrastructure KPI Dashboard in Excel solves these challenges by offering a clear, structured, and real-time view of all key metrics.
This dashboard helps you track monthly and yearly performance, compare with targets, study trends, and make smarter decisions. Because it is simple, cost-effective, and easy to customize, it becomes a perfect solution for city planners, engineers, municipal teams, and consultants. When used consistently, this dashboard improves efficiency, transparency, and accountability across all infrastructure services.
Click to Purchases Urban Infrastructure KPI Dashboard in Excel
Frequently Asked Questions (FAQs)
1. What is an Urban Infrastructure KPI Dashboard?
It is an Excel-based tool that tracks key performance indicators related to city infrastructure such as water, waste, roads, power, and transportation.
2. Who can use this dashboard?
Municipal corporations, public works departments, smart city teams, consultants, and urban planners can use it.
3. Do I need advanced Excel skills to use this dashboard?
No. The dashboard works smoothly with basic Excel knowledge.
4. Can I add my own KPIs?
Yes. You can easily add or modify KPIs in the KPI Definition sheet.
5. How often should I update data?
You should update MTD numbers every month and YTD numbers regularly.
6. Can I use this dashboard for presentations?
Yes. The clean layout and charts make it ideal for meetings and reviews.
7. Does it include trend analysis?
Yes. The KPI Trend sheet shows MTD and YTD trends for Actual, Target, and Previous Year.
Click to Purchases Urban Infrastructure KPI Dashboard in Excel
Visit our YouTube channel to learn step-by-step video tutorials