Managing vacation rentals in today’s competitive travel market requires more than just welcoming guests and maintaining properties. Success depends on tracking performance, monitoring KPIs, and making data-driven decisions. That’s where a Vacation Rental KPI Dashboard in Power BI becomes a game-changer.
This article will walk you through everything you need to know about this dashboard—its features, benefits, best practices, and real-world use cases. We will also answer some of the most common questions at the end.
Click to Purchases Vacation Rental KPI Dashboard in Power BI
What Is a Vacation Rental KPI Dashboard in Power BI?
A Vacation Rental KPI Dashboard in Power BI is a ready-to-use reporting solution designed to help property managers, vacation rental companies, and hosts monitor their business performance with ease.
The dashboard is powered by Excel input data and visualized in Power BI, offering an interactive experience. It consolidates all the critical KPIs—like occupancy rates, revenue per property, guest satisfaction, and booking trends—into one place.
Unlike traditional spreadsheets or manual reports, this dashboard automates data visualization and provides real-time insights, helping you identify strengths and areas for improvement instantly.
Key Features of the Vacation Rental KPI Dashboard
The dashboard comes with three powerful pages in the Power BI Desktop application:
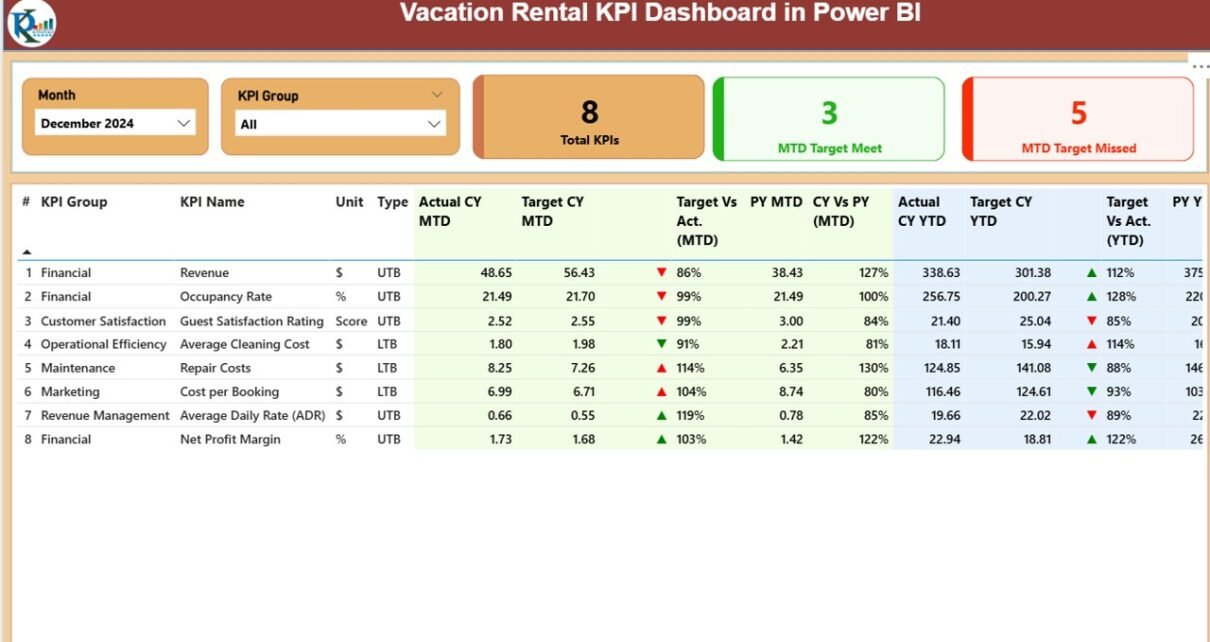
Summary Page
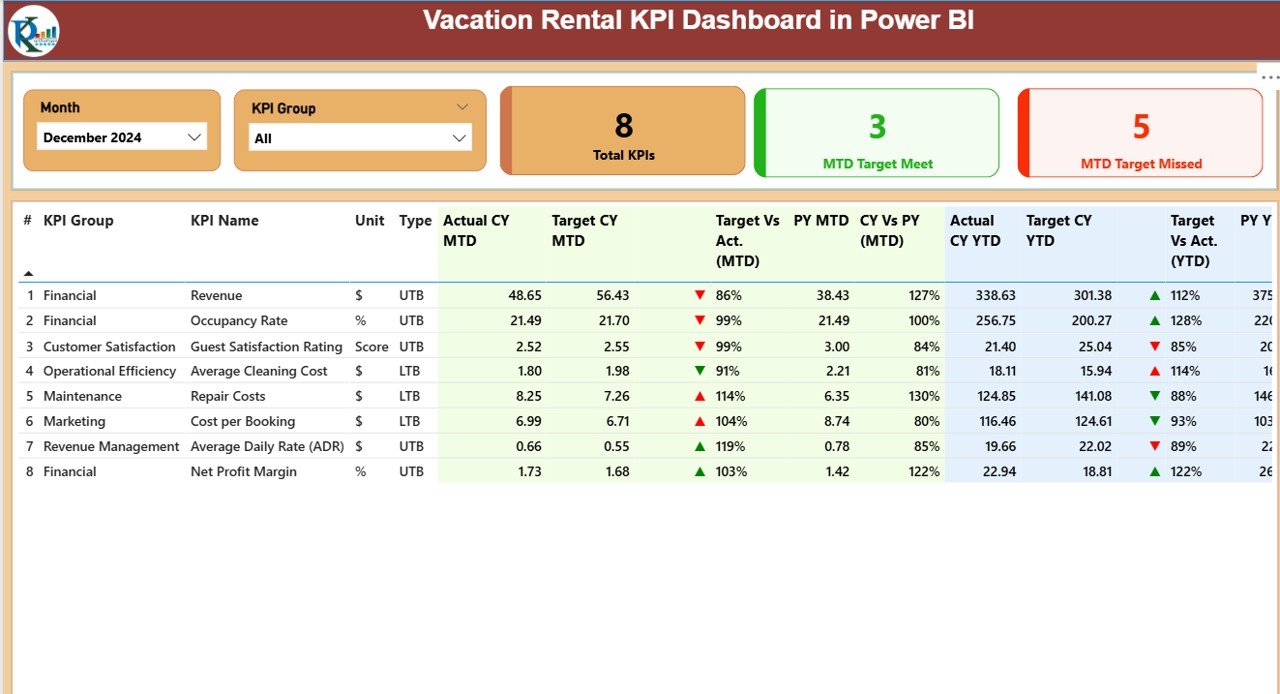
The Summary Page acts as the control center of the dashboard.
-
At the top, you’ll find Month and KPI Group slicers, which allow you to filter data quickly.
Three highlight cards summarize key metrics:
- Total KPIs Count
- MTD (Month-to-Date) Target Met
- MTD Target Missed
Below this, a detailed KPI table displays:
-
KPI Number, Group, and Name
-
Unit of Measurement
-
Type (LTB = Lower the Better, UTB = Upper the Better)
-
Current Year MTD vs Target MTD with color-coded ▲ ▼ icons
-
Previous Year comparisons (MTD and YTD)
-
Target vs Actual performance %
This allows managers to instantly evaluate business health across properties.
KPI Trend Page
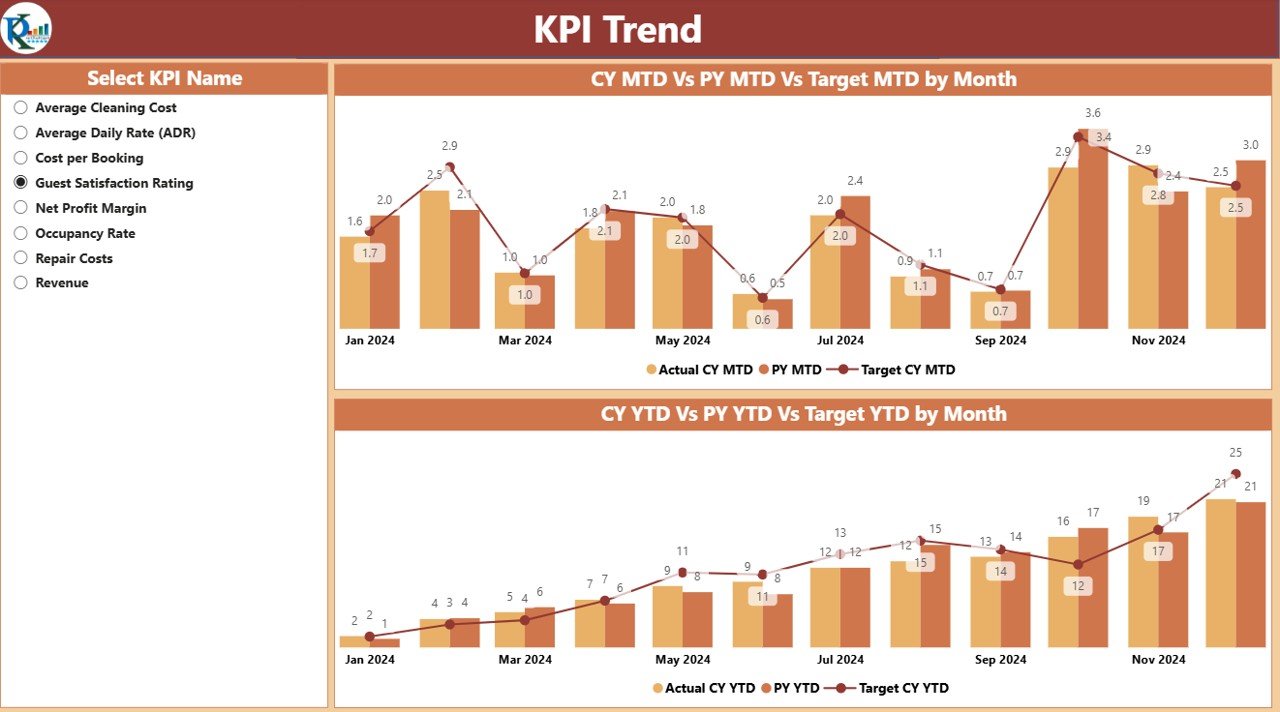
Trends are crucial for decision-making. The KPI Trend page includes:
-
Two combo charts displaying Current Year, Previous Year, and Target values.
-
Separate tracking for both MTD and YTD numbers.
-
A KPI slicer on the left, allowing users to drill down to specific performance indicators.
With this, you can spot seasonal patterns, compare performance across months, and plan ahead.
Click to Purchases Vacation Rental KPI Dashboard in Power BI
KPI Definition Page
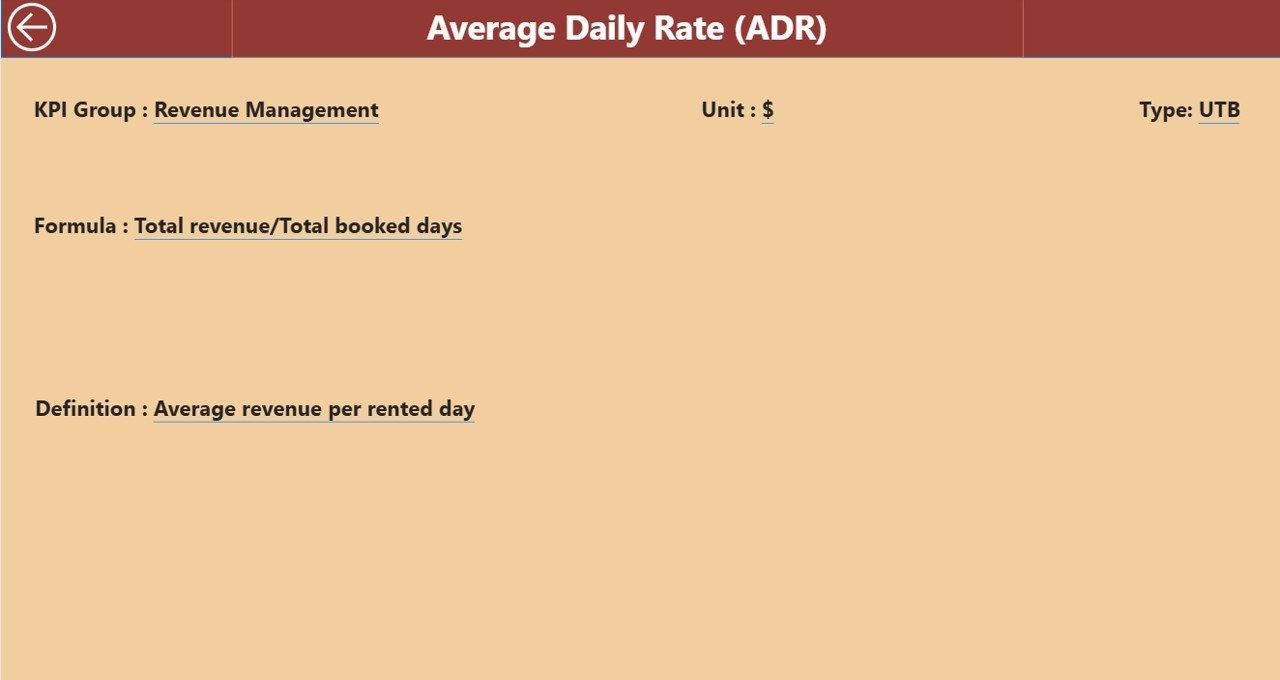
Transparency is important in performance tracking. The hidden KPI Definition Page ensures that:
-
Each KPI includes a clear formula and definition.
-
Users can drill through from the Summary Page to see KPI details.
-
A back button allows easy navigation back to the main dashboard.
This ensures consistency in KPI understanding across the team.
Excel Data Source Structure
The dashboard is powered by a structured Excel file with three worksheets:
-
Input_Actual – Enter Actual values of KPIs by Month, MTD, and YTD.
-
Input_Target – Enter Target values for each KPI by Month, MTD, and YTD.
-
KPI Definition – Define each KPI with fields like KPI Number, Group, Unit, Formula, Definition, and Type (LTB or UTB).
This structured approach ensures easy updates and accurate reporting.
Why Do Vacation Rentals Need a KPI Dashboard?
Running a vacation rental business involves multiple moving parts—guest bookings, property upkeep, seasonal demand, pricing strategies, and guest satisfaction. Without proper tracking, it’s easy to lose sight of what’s working and what’s not.
A KPI Dashboard in Power BI brings clarity and control by:
-
Consolidating all data in one place
-
Automating performance reporting
-
Providing visual comparisons across time
-
Allowing real-time analysis and quick decision-making
Advantages of the Vacation Rental KPI Dashboard in Power BI
✅ Centralized Insights – No more juggling multiple spreadsheets. Everything is consolidated.
✅ Better Decision Making – Visual KPIs highlight problem areas instantly.
✅ Time-Saving – Automated calculations eliminate manual reporting.
✅ Trend Analysis – Identify seasonal highs and lows to adjust pricing strategies.
✅ Guest Satisfaction Monitoring – Track service KPIs to improve customer experience.
✅ Scalability – Works whether you manage 5 rentals or 500.
Key KPIs to Track in Vacation Rentals
The dashboard can be customized to track various KPIs. Here are the most important ones:
-
Occupancy Rate (%) – Total booked nights ÷ total available nights.
-
Revenue per Property – Monthly revenue ÷ number of properties.
-
Average Daily Rate (ADR) – Total revenue ÷ number of nights sold.
-
Booking Conversion Rate – Confirmed bookings ÷ total inquiries.
-
Guest Satisfaction Score – Ratings collected from guest surveys.
-
Maintenance Cost per Property – Total maintenance expenses ÷ number of properties.
-
Cancellations Rate – Number of canceled bookings ÷ total bookings.
-
Repeat Guest % – Percentage of guests returning for multiple stays.
These KPIs help strike the right balance between profitability, occupancy, and service quality.
Best Practices for Using the Vacation Rental KPI Dashboard
To get the most value from the dashboard, follow these practices:
-
Update Data Regularly – Ensure actual and target values are updated monthly.
-
Use Consistent KPI Definitions – Maintain clarity by sticking to standard definitions.
-
Review MTD and YTD Together – Spot short-term issues and long-term trends.
-
Set Realistic Targets – Compare with past performance before setting new goals.
-
Leverage Visual Icons – Pay attention to green ▲ and red ▼ indicators for quick assessments.
-
Drill Through to KPI Definitions – Train your team to use definitions for deeper understanding.
-
Integrate with Other Data Sources – Expand insights by combining with CRM, booking platforms, or financial systems.
Opportunities for Improvement with the Dashboard
While the dashboard is powerful, there’s always room for improvement:
-
Adding property-level drilldowns for individual unit performance.
-
Including geographical maps to analyze location-wise bookings.
-
Tracking marketing campaign ROI alongside rental KPIs.
-
Automating real-time data refresh from booking platforms instead of Excel input.
-
Expanding KPI definitions to include sustainability and energy usage metrics.
Who Can Benefit from This Dashboard?
This dashboard isn’t limited to large vacation rental companies. It can benefit:
-
Individual Hosts managing a few properties.
-
Property Management Companies handling multiple clients.
-
Vacation Rental Agencies offering Airbnb, Vrbo, or Booking.com listings.
-
Resort Managers tracking performance across multiple units.
-
Corporate Housing Providers monitoring occupancy and revenue.
Conclusion
The Vacation Rental KPI Dashboard in Power BI is more than just a reporting tool—it’s a strategic partner for growing your rental business. By tracking performance indicators like occupancy rates, revenue, cancellations, and guest satisfaction, property managers can make smarter decisions, enhance profitability, and deliver better guest experiences.
With its simple Excel input, automated visuals, and interactive Power BI design, this dashboard is perfect for both beginners and advanced users.
If you want to move beyond guesswork and start making data-driven rental decisions, this dashboard is the right solution.
Frequently Asked Questions (FAQs)
1. What is a KPI in vacation rentals?
A KPI (Key Performance Indicator) is a measurable value that shows how effectively your rental business is performing. Examples include Occupancy Rate, ADR, and Guest Satisfaction.
2. Why should I use Power BI for vacation rentals?
Power BI offers interactive dashboards, real-time updates, and easy integration with Excel and other data sources, making it perfect for vacation rental analysis.
3. Can I customize the KPIs in this dashboard?
Yes. You can add, remove, or modify KPIs in the Excel input file, and the changes will reflect in the Power BI dashboard.
4. Do I need advanced Power BI skills to use this dashboard?
No. The template is ready-to-use. You only need to update data in Excel, and the dashboard updates automatically.
5. How often should I update the data?
At least monthly, but you can update weekly or even daily if you want more real-time tracking.
6. Can I connect this dashboard directly with booking platforms?
Yes, with Power BI’s integration features, you can connect to APIs from platforms like Airbnb, Vrbo, or Booking.com for live updates.
7. What makes this dashboard better than spreadsheets?
Spreadsheets show raw data, while Power BI transforms numbers into insights using visuals, trends, and automated comparisons.
Visit our YouTube channel to learn step-by-step video tutorials