Virtual Reality (VR) studios continue to transform entertainment, gaming, education, healthcare, and enterprise training. However, as VR projects grow in complexity, studios must track performance, costs, productivity, and outcomes more carefully. Therefore, relying on scattered Excel files or manual reports no longer works.
That is exactly why a Virtual Reality Studios KPI Dashboard in Excel becomes an essential management and analytics tool.
In this detailed article, you will learn what a Virtual Reality Studios KPI Dashboard in Excel is, how it works, its worksheet-wise structure, advantages, best practices, and frequently asked questions. By the end, you will clearly understand how this dashboard helps VR studios make smarter, data-driven decisions.
Click to Purchases Virtual Reality Studios KPI Dashboard in Excel
What Is a Virtual Reality Studios KPI Dashboard in Excel?
A Virtual Reality Studios KPI Dashboard in Excel is a centralized performance tracking and reporting tool designed specifically for VR production studios. It allows studios to monitor key performance indicators such as productivity, costs, efficiency, quality, and delivery timelines in one place.
Instead of reviewing multiple spreadsheets, teams can analyze Month-to-Date (MTD) and Year-to-Date (YTD) performance through structured tables, trends, and visual indicators.
Moreover, because this dashboard runs entirely in Excel, it remains easy to use, flexible, and cost-effective.
Why Do Virtual Reality Studios Need a KPI Dashboard?
Virtual reality studios handle multiple moving parts. For example, they manage creative teams, hardware resources, development timelines, budgets, and client expectations. Therefore, tracking performance manually often leads to errors and delays.
A Virtual Reality Studios KPI Dashboard in Excel helps because it:
-
Centralizes all KPIs in one dashboard
-
Reduces manual reporting effort
-
Improves visibility into MTD and YTD performance
-
Highlights underperforming KPIs instantly
-
Supports data-driven decision-making
As a result, studio managers gain control and clarity across operations.
What Makes This VR KPI Dashboard Ready to Use?
This dashboard comes as a ready-to-use Excel template. You only need to enter data in input sheets, and the dashboard updates automatically.
Additionally, the dashboard includes:
-
Drop-down selections
-
Conditional formatting indicators
-
KPI trend analysis
-
Structured KPI definitions
Therefore, even non-technical users can use it confidently.
Click to Purchases Virtual Reality Studios KPI Dashboard in Excel
Overview of Worksheets in the Virtual Reality Studios KPI Dashboard
This KPI dashboard includes seven structured worksheets, each designed for a specific purpose.
Let us explore each worksheet in detail.
What Is the Home Sheet in the VR KPI Dashboard?
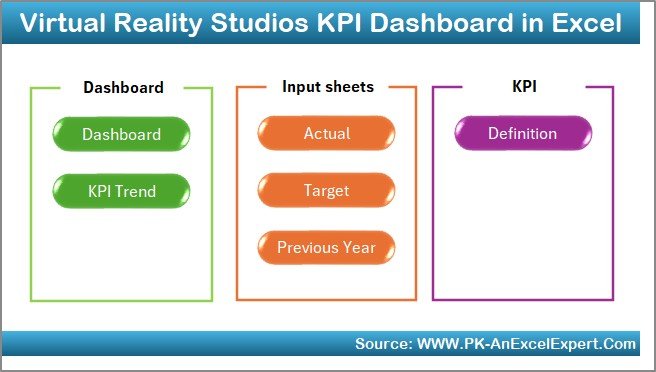
The Home Sheet acts as the index or navigation page.
Key Features of the Home Sheet
-
Serves as the entry point of the dashboard
-
Includes six navigation buttons
-
Allows users to jump to specific worksheets instantly
Because of this design, users can navigate the dashboard quickly without scrolling through tabs.
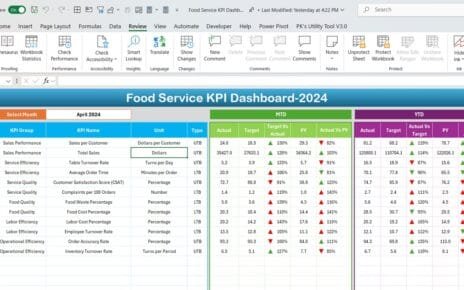
What Does the Dashboard Sheet Show?
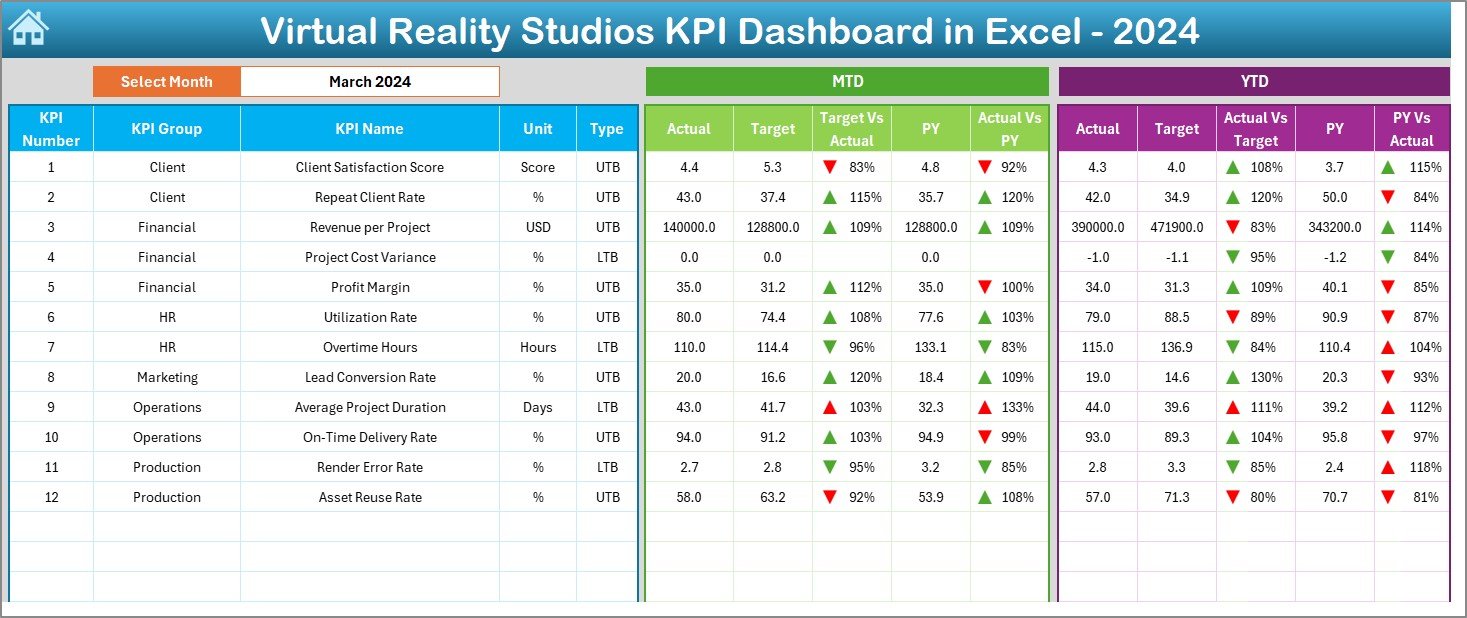
The Dashboard Sheet serves as the main analytical page of the file.
Month Selection Feature
On cell D3, you can select the Month from a drop-down list. Once you select a month, the entire dashboard updates automatically.
As a result, you can analyze performance month by month with ease.
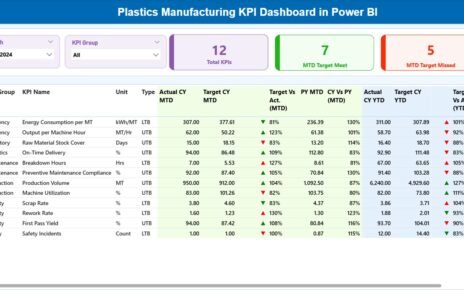
KPI Metrics Displayed on the Dashboard Sheet
This sheet displays both MTD and YTD performance metrics, including:
MTD Section
-
MTD Actual
-
MTD Target
-
MTD Previous Year
-
Target vs Actual (MTD %)
-
Previous Year vs Actual (MTD %)
YTD Section
-
YTD Actual
-
YTD Target
-
YTD Previous Year
-
Target vs Actual (YTD %)
-
Previous Year vs Actual (YTD %)
Each comparison uses conditional formatting with up and down arrows:
-
▲ Green arrow indicates positive performance
-
▼ Red arrow indicates negative performance
Therefore, users can identify performance status instantly.
Click to Purchases Virtual Reality Studios KPI Dashboard in Excel
How Does the KPI Trend Sheet Help?
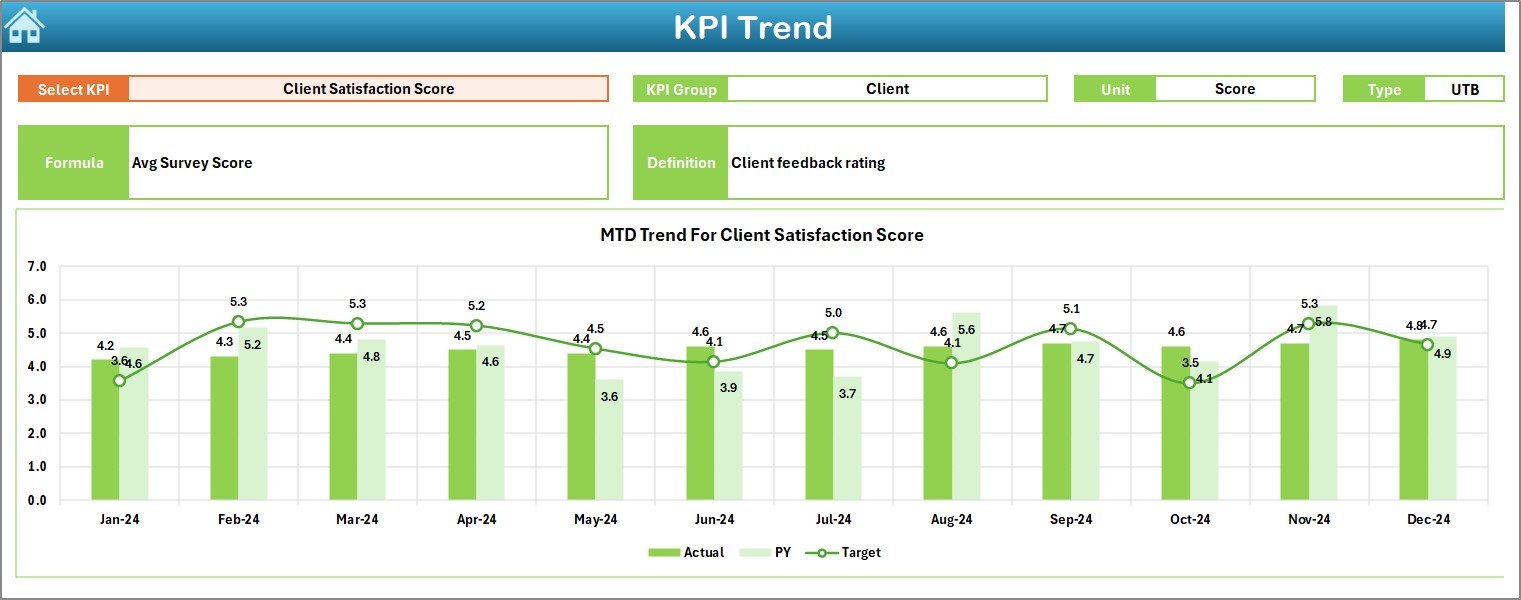
The KPI Trend Sheet focuses on detailed KPI-level analysis.
KPI Selection
On cell C3, you can select a KPI Name from a drop-down list. Once selected, all related information updates automatically.
KPI Information Displayed
This sheet displays:
-
KPI Group
-
KPI Unit
-
KPI Type (Lower the Better or Upper the Better)
-
KPI Formula
-
KPI Definition
Because of this, users always understand what each KPI measures.
Trend Charts on the KPI Trend Sheet
The sheet also includes:
-
MTD Trend Chart (Actual, Target, Previous Year)
-
YTD Trend Chart (Actual, Target, Previous Year)
These charts help users analyze performance trends over time.
What Is the Actual Numbers Input Sheet?
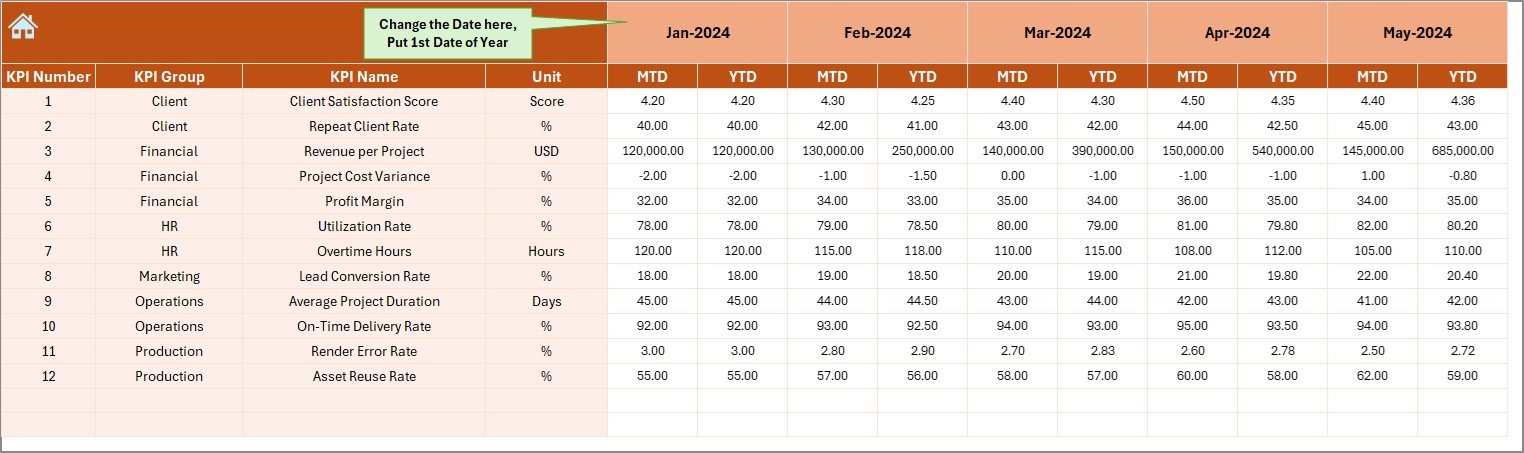
The Actual Numbers Input Sheet allows users to enter real performance data.
How to Use This Sheet
-
Enter the first month of the year in cell E1
-
Select the month
-
Input:
-
MTD Actual values
-
YTD Actual values
-
This sheet captures real operational performance.
Click to Purchases Virtual Reality Studios KPI Dashboard in Excel
What Is the Target Sheet Used For?
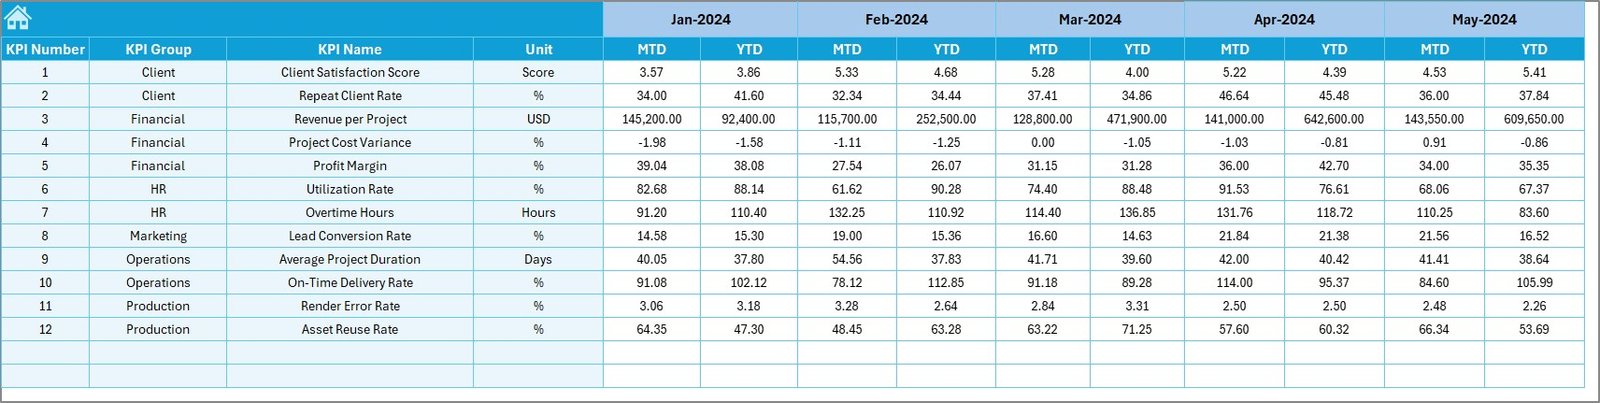
The Target Sheet stores planned or expected KPI values.
Data Entered in the Target Sheet
-
KPI Name
-
Month
-
MTD Target
-
YTD Target
Because targets drive performance evaluation, this sheet plays a critical role in analysis.
What Is the Previous Year Number Sheet?

The Previous Year Number Sheet stores historical data.
Purpose of This Sheet
-
Capture previous year MTD values
-
Capture previous year YTD values
-
Enable year-over-year comparison
As a result, users can evaluate growth and improvement accurately.
Click to Purchases Virtual Reality Studios KPI Dashboard in Excel
What Is the KPI Definition Sheet?
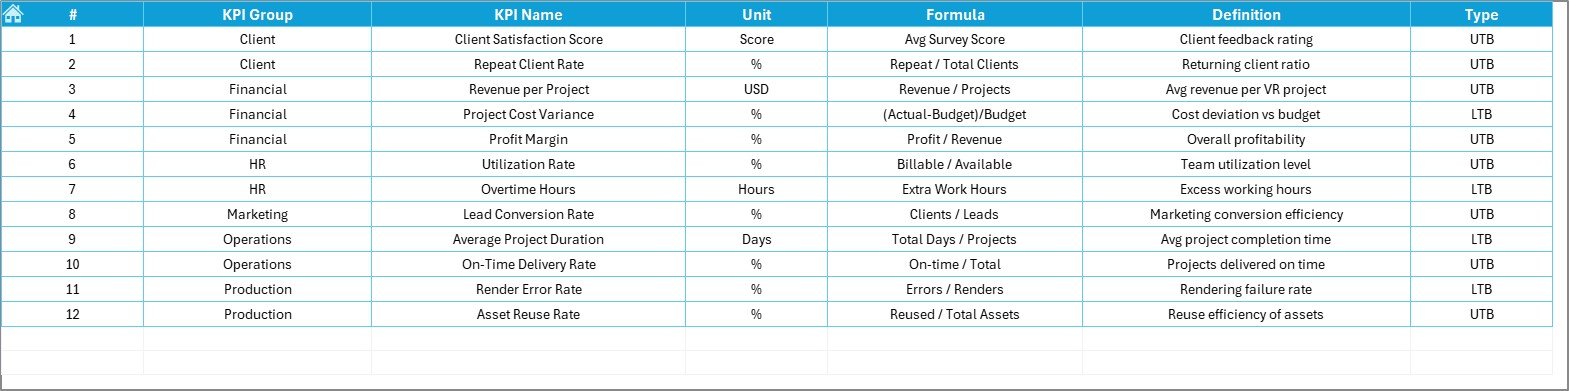
The KPI Definition Sheet acts as the documentation layer of the dashboard.
Information Stored
-
KPI Name
-
KPI Group
-
Unit
-
Formula
-
KPI Definition
Because this sheet provides clarity, new users can understand KPIs without confusion.
Advantages of a Virtual Reality Studios KPI Dashboard in Excel
Using a Virtual Reality Studios KPI Dashboard in Excel offers multiple benefits.
1. Centralized Performance Tracking
All KPIs remain available in one place. Therefore, teams avoid fragmented reporting.
2. Faster Decision-Making
Visual indicators and trends support quicker decisions.
3. Clear MTD and YTD Visibility
Studios can track both short-term and long-term performance.
4. Easy Customization
Because the dashboard uses Excel, you can modify KPIs easily.
5. Cost-Effective Solution
No expensive software subscriptions are required.
6. Improved Accountability
Teams can track responsibility across KPI groups.
Click to Purchases Virtual Reality Studios KPI Dashboard in Excel
Best Practices for the Virtual Reality Studios KPI Dashboard in Excel
Following best practices ensures accurate insights.
1. Define Relevant KPIs
Always align KPIs with studio goals such as productivity, quality, and profitability.
2. Maintain Data Consistency
Use consistent units and naming conventions across sheets.
3. Update Data Regularly
Update actual, target, and previous year data monthly.
4. Validate KPI Formulas
Ensure formulas remain correct and relevant.
5. Review Trends Periodically
Analyze trends monthly and quarterly to identify issues early.
6. Train Team Members
Ensure users understand how to read and interpret KPIs.
Click to Purchases Virtual Reality Studios KPI Dashboard in Excel
Opportunities for Improvement in VR KPI Dashboards
Although this dashboard is powerful, studios can enhance it further.
-
Add project-level analysis
-
Include resource utilization metrics
-
Add cost vs revenue KPIs
-
Integrate client satisfaction scores
-
Automate data input using Power Query
These improvements can increase strategic value over time.
Who Should Use a Virtual Reality Studios KPI Dashboard?
This dashboard works best for:
-
VR content studios
-
Gaming development teams
-
Simulation and training studios
-
Media production houses
-
Creative technology startups
-
XR and metaverse-focused companies
Because the structure remains flexible, it adapts easily to different VR business models.
Conclusion
A Virtual Reality Studios KPI Dashboard in Excel provides a structured, visual, and practical way to monitor studio performance. Instead of relying on scattered reports, teams gain a centralized view of MTD and YTD KPIs, trends, and comparisons.
With features such as month selection, KPI trends, conditional formatting, and clear definitions, this dashboard empowers studios to make confident, data-driven decisions.
If you want better control, transparency, and performance tracking in your VR studio, this dashboard offers a reliable and ready-to-use solution.
Frequently Asked Questions (FAQs)
What is a Virtual Reality Studios KPI Dashboard in Excel?
It is an Excel-based tool that tracks and analyzes KPIs for VR studios using MTD and YTD data.
Can beginners use this dashboard?
Yes, because data entry happens through simple Excel sheets.
How often should data be updated?
You should update data monthly for accurate analysis.
Can I add new KPIs?
Yes, you can add new KPIs by updating the KPI Definition and input sheets.
Does the dashboard support year-over-year comparison?
Yes, it includes Previous Year comparisons for both MTD and YTD.
Is this dashboard customizable?
Yes, you can customize KPIs, formulas, and visuals easily in Excel.
Click to Purchases Virtual Reality Studios KPI Dashboard in Excel
Visit our YouTube channel to learn step-by-step video tutorials