Planning a wedding involves dozens of activities happening at the same time. From managing budgets and vendors to tracking timelines, guest counts, and service quality, wedding planners handle a huge amount of data. However, when this data stays scattered across notebooks, emails, or multiple Excel files, planning becomes stressful and error-prone.
That is exactly why a Wedding Planning KPI Dashboard in Excel becomes an essential tool for modern wedding planners and event management teams.
In this detailed article, you will learn what a Wedding Planning KPI Dashboard in Excel is, how it works, its worksheet-wise structure, advantages, best practices, and frequently asked questions. By the end, you will clearly understand how this ready-to-use dashboard helps you manage weddings more efficiently and professionally.
Click to Purchases Wedding Planning KPI Dashboard in Excel
What Is a Wedding Planning KPI Dashboard in Excel?
A Wedding Planning KPI Dashboard in Excel is a centralized performance tracking and reporting tool designed to monitor key wedding planning metrics using Key Performance Indicators (KPIs).
Instead of managing separate sheets for budget, vendors, schedules, and performance, this dashboard brings everything together in one structured Excel file. As a result, wedding planners can track Month-to-Date (MTD) and Year-to-Date (YTD) performance clearly.
Moreover, because the dashboard works entirely in Excel, it remains easy to use, flexible, and cost-effective for both solo planners and large event agencies.
Why Do Wedding Planners Need a KPI Dashboard?
Wedding planning includes many moving parts. Therefore, even small mistakes can lead to cost overruns or unhappy clients. A KPI dashboard helps planners stay in control.
A Wedding Planning KPI Dashboard in Excel helps because it:
-
Centralizes all planning KPIs in one place
-
Tracks actual vs target performance
-
Highlights issues early using visual indicators
-
Saves time spent on manual reporting
-
Improves planning accuracy and accountability
As a result, planners can focus more on creativity and client experience instead of manual tracking.
What Makes This Wedding Planning KPI Dashboard Ready to Use?
This dashboard comes as a ready-to-use Excel template. You only need to enter data in the input sheets, and all calculations and visuals update automatically.
Additionally, the dashboard includes:
-
Drop-down month selection
-
Conditional formatting with up and down arrows
-
MTD and YTD performance comparison
-
KPI trend analysis
-
Clear KPI definitions
Therefore, even users with basic Excel knowledge can use it confidently.
Click to Purchases Wedding Planning KPI Dashboard in Excel
Overview of Worksheets in the Wedding Planning KPI Dashboard
The Wedding Planning KPI Dashboard in Excel includes seven well-structured worksheets, each designed for a specific purpose.
Let us explore each worksheet in detail.
What Is the Home Sheet in the Wedding Planning Dashboard?

The Home Sheet works as the index or navigation page of the dashboard.
Key Features of the Home Sheet
-
Acts as the starting point of the file
-
Includes six navigation buttons
-
Allows instant navigation to different worksheets
Because of this layout, users can move through the dashboard smoothly without searching through tabs.
What Does the Dashboard Sheet Show?
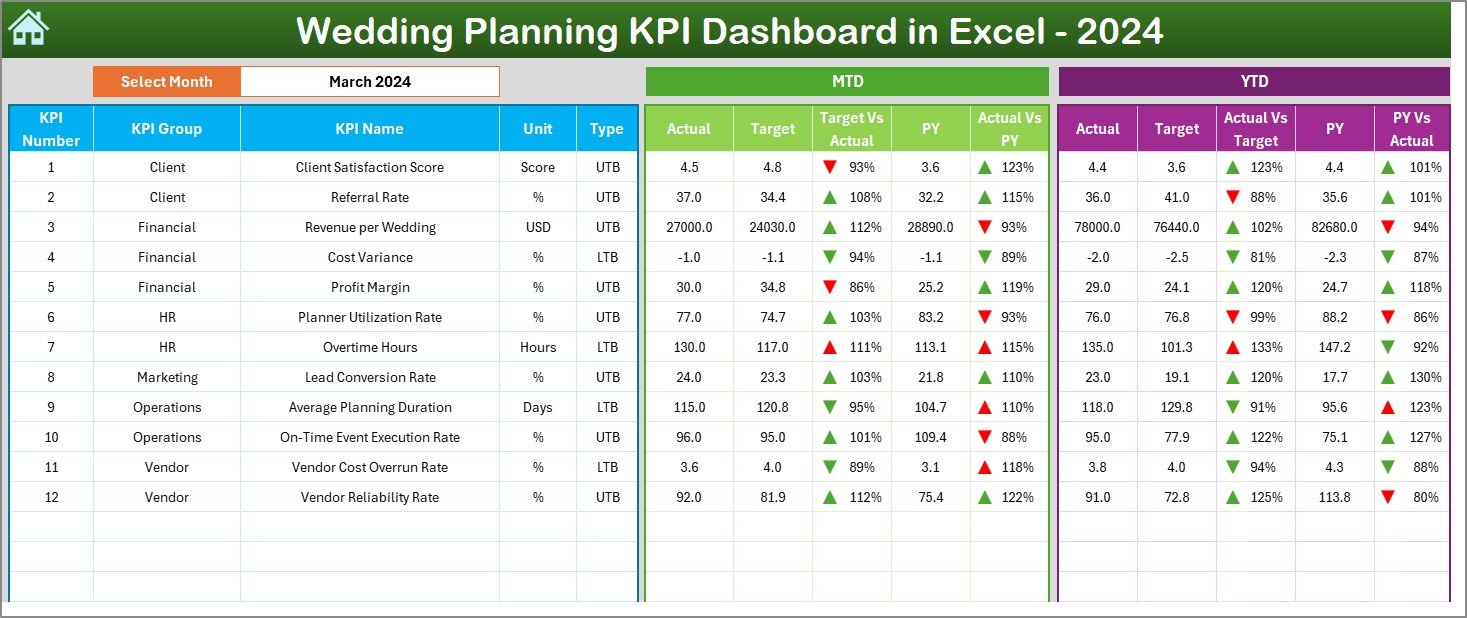
The Dashboard Sheet is the main analytical page of the Wedding Planning KPI Dashboard.
Month Selection Feature
On cell D3, you can select the Month from a drop-down list. Once you select a month, all KPI values on the dashboard update automatically.
Therefore, you can analyze performance for any specific month instantly.
KPIs Displayed on the Dashboard Sheet
This sheet displays both MTD and YTD performance metrics for wedding planning KPIs.
MTD Metrics
-
MTD Actual
-
MTD Target
-
MTD Previous Year
-
Target vs Actual (MTD %)
-
Previous Year vs Actual (MTD %)
YTD Metrics
-
YTD Actual
-
YTD Target
-
YTD Previous Year
-
Target vs Actual (YTD %)
-
Previous Year vs Actual (YTD %)
Each comparison uses conditional formatting with arrows:
-
▲ Green arrow shows positive performance
-
▼ Red arrow shows negative performance
As a result, planners can identify performance gaps immediately.
Click to Purchases Wedding Planning KPI Dashboard in Excel
How Does the KPI Trend Sheet Support Analysis?
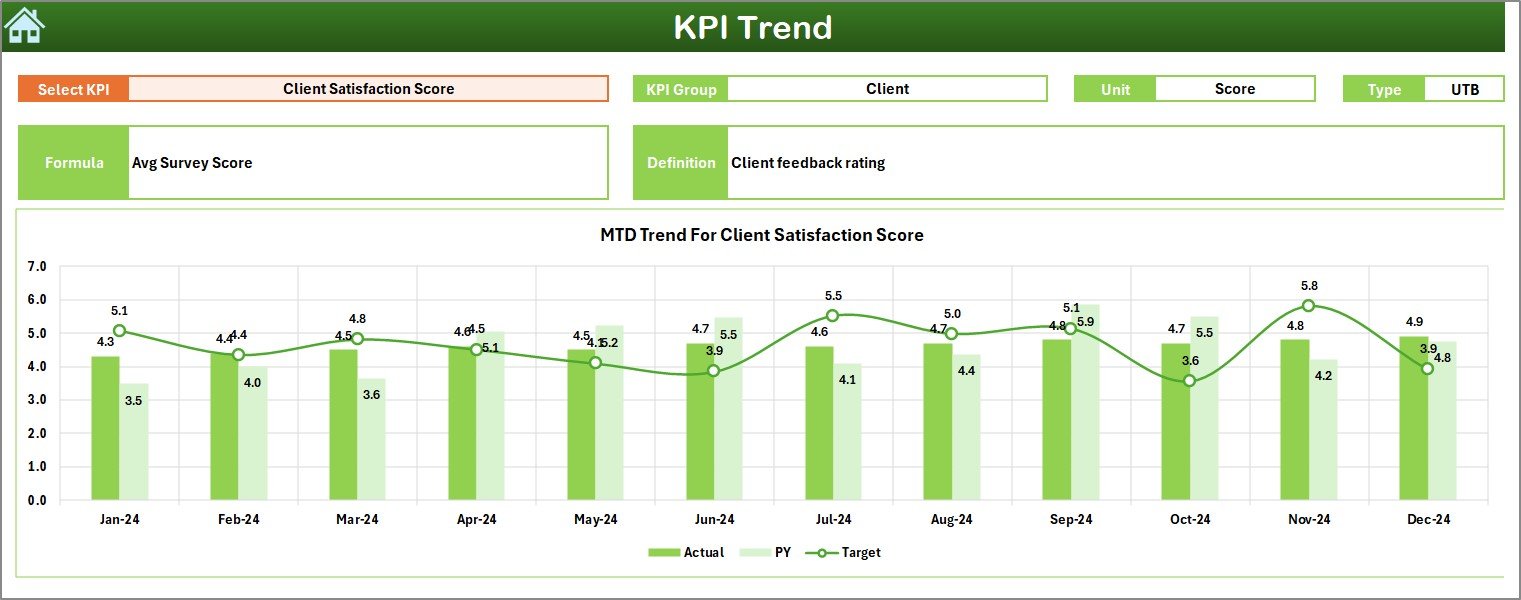
The KPI Trend Sheet helps planners analyze individual KPIs in depth.
KPI Selection
On cell C3, you can select a KPI Name from a drop-down list. Once selected, the sheet updates automatically with relevant details.
KPI Details Displayed
This sheet shows:
-
KPI Group
-
Unit of KPI
-
KPI Type (Lower the Better or Upper the Better)
-
KPI Formula
-
KPI Definition
Because of this information, users always understand what each KPI measures and how it is calculated.
Trend Charts on the KPI Trend Sheet
The sheet includes:
-
MTD Trend Chart for Actual, Target, and Previous Year
-
YTD Trend Chart for Actual, Target, and Previous Year
These charts help planners identify trends, seasonal patterns, and performance changes over time.
What Is the Actual Numbers Input Sheet?
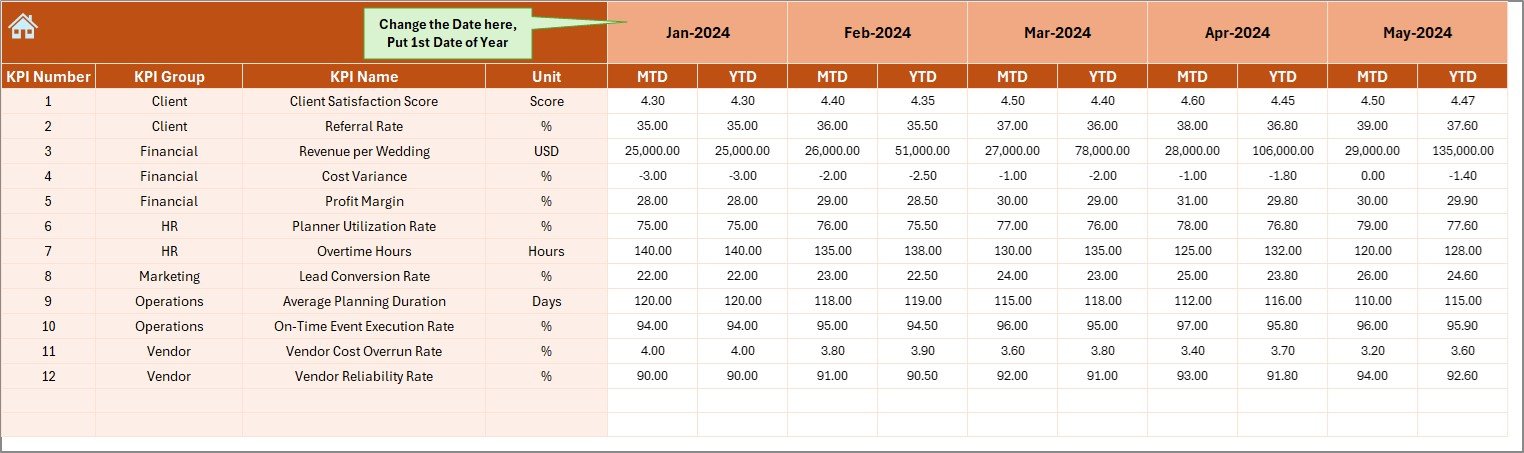
The Actual Numbers Input Sheet stores real performance data.
How to Use This Sheet
-
Enter the first month of the year in cell E1
-
Select the month
-
Enter:
-
MTD Actual values
-
YTD Actual values
-
This sheet captures actual planning results such as costs, timelines, or service completion.
What Is the Target Sheet Used For?

The Target Sheet stores planned or expected KPI values.
Data Entered in the Target Sheet
-
KPI Name
-
Month
-
MTD Target values
-
YTD Target values
Because targets define success benchmarks, this sheet plays a crucial role in performance evaluation.
What Is the Previous Year Number Sheet?
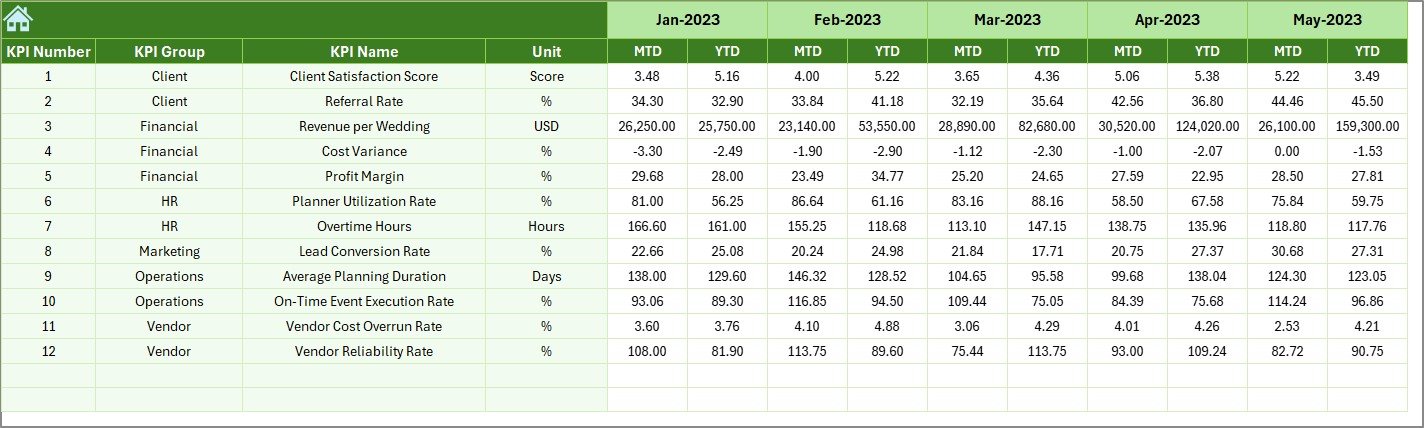
The Previous Year Number Sheet stores historical KPI values.
Purpose of This Sheet
-
Capture previous year MTD values
-
Capture previous year YTD values
-
Enable year-over-year comparison
As a result, planners can evaluate growth, improvement, and efficiency over time.
What Is the KPI Definition Sheet?

The KPI Definition Sheet documents all KPIs used in the dashboard.
Information Stored
-
KPI Name
-
KPI Group
-
Unit
-
Formula
-
KPI Definition
Because of this sheet, new team members can understand KPIs quickly without additional explanations.
Click to Purchases Wedding Planning KPI Dashboard in Excel
Advantages of a Wedding Planning KPI Dashboard in Excel
Using a Wedding Planning KPI Dashboard in Excel offers several advantages.
1. Centralized Wedding Performance Tracking
All KPIs remain in one dashboard, which reduces confusion and duplication.
2. Better Budget and Timeline Control
MTD and YTD tracking helps planners manage costs and schedules effectively.
3. Faster Decision-Making
Visual indicators allow planners to act quickly when issues arise.
4. Easy Customization
You can modify KPIs, formulas, and targets based on event requirements.
5. Cost-Effective Solution
Because it runs in Excel, no additional software investment is required.
6. Professional Reporting
The dashboard improves client reporting and internal reviews.
Best Practices for the Wedding Planning KPI Dashboard in Excel
Following best practices ensures accurate insights and smooth usage.
1. Define Clear Wedding KPIs
Always select KPIs that align with wedding success, such as budget adherence, vendor performance, and timeline completion.
2. Maintain Consistent Data Entry
Use consistent units, formats, and naming conventions across all sheets.
3. Update Data Regularly
Update actual, target, and previous year data monthly.
4. Review Trends Periodically
Analyze KPI trends to identify risks early.
5. Validate KPI Formulas
Ensure formulas remain correct and relevant.
6. Train Team Members
Make sure everyone understands how to read and interpret KPIs.
Click to Purchases Wedding Planning KPI Dashboard in Excel
Opportunities for Improvement in Wedding Planning Dashboards
Although this dashboard is powerful, planners can enhance it further.
-
Add vendor-wise analysis
-
Include guest satisfaction scores
-
Add milestone tracking KPIs
-
Include cost category breakdowns
-
Automate data input using advanced Excel features
These enhancements can increase planning accuracy and strategic value.
Who Should Use a Wedding Planning KPI Dashboard?
This dashboard is ideal for:
-
Wedding planners
-
Event management agencies
-
Destination wedding planners
-
Freelance coordinators
-
Hospitality and event teams
Because the structure is flexible, it adapts easily to different wedding sizes and styles.
Conclusion
A Wedding Planning KPI Dashboard in Excel transforms complex wedding data into clear, actionable insights. Instead of relying on scattered spreadsheets, planners gain a centralized view of MTD and YTD performance, trends, and comparisons.
With features such as month selection, KPI trends, conditional formatting, and structured definitions, this dashboard helps planners stay organized, reduce risks, and deliver exceptional wedding experiences.
If you want better control, transparency, and professionalism in wedding planning, this ready-to-use KPI dashboard is a practical and powerful solution.
Frequently Asked Questions (FAQs)
What is a Wedding Planning KPI Dashboard in Excel?
It is an Excel-based tool that tracks and analyzes wedding planning KPIs using MTD and YTD metrics.
Can beginners use this dashboard?
Yes, because data entry happens through simple Excel sheets.
How often should data be updated?
You should update data monthly for accurate analysis.
Can I customize KPIs?
Yes, you can easily modify KPIs, formulas, and targets.
Does the dashboard support year-over-year comparison?
Yes, it includes Previous Year comparisons for both MTD and YTD.
Is this dashboard suitable for event agencies?
Yes, it works well for both individual planners and agencies.
Click to Purchases Wedding Planning KPI Dashboard in Excel
Visit our YouTube channel to learn step-by-step video tutorials