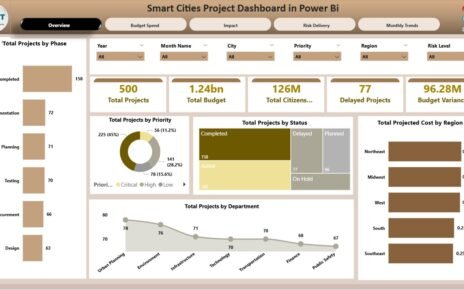
Cities around the world continue to evolve with the help of technology, data analytics, and sustainable infrastructure. Governments now invest
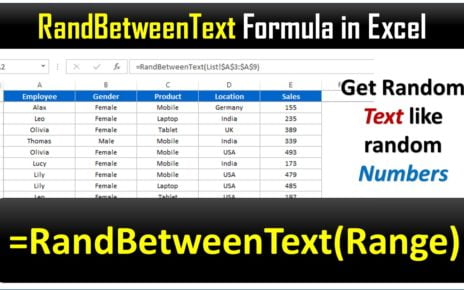
In this article, we have created a user defined function RandBetweenText Formula in Excel. This function returns random text from
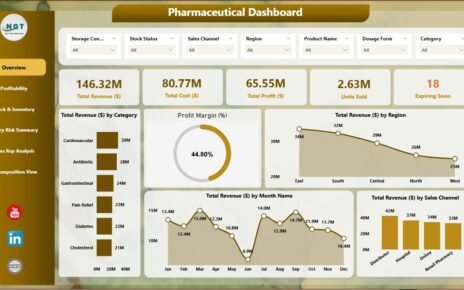
Effective tracking and analysis of pharmaceutical sales, profit margins, inventory, and other key performance indicators (KPIs) is essential for any