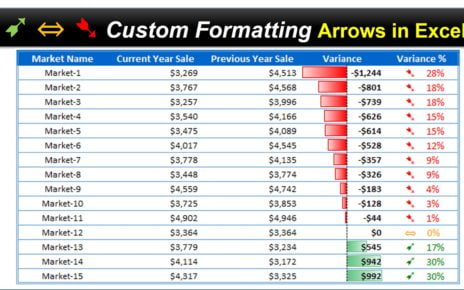
3D Charts for Weekly Sale – 1
26
Sep 2021
80Comments Off on 3D Charts for Weekly Sale – 1
PK
Meet PK, the founder of PK-AnExcelExpert.com! With over 15 years of experience in Data Visualization, Excel Automation, and dashboard creation. PK is a Microsoft Certified Professional who has a passion for all things in Excel. PK loves to explore new and innovative ways to use Excel and is always eager to share his knowledge with others. With an eye for detail and a commitment to excellence, PK has become a go-to expert in the world of Excel. Whether you're looking to create stunning visualizations or streamline your workflow with automation, PK has the skills and expertise to help you succeed. Join the many satisfied clients who have benefited from PK's services and see how he can take your Excel skills to the next level!
https://www.pk-anexcelexpert.com
Related Articles
Common Errors in Excel formulas and how to fix them
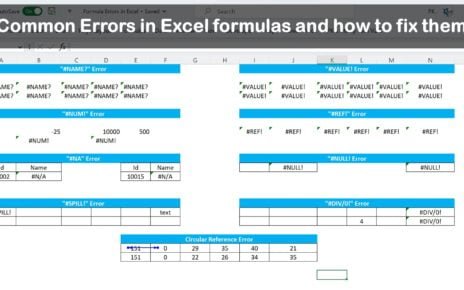
Excel is a magnificent tool for managing and analyzing vast amounts of data, with formulas being a critical aspect of
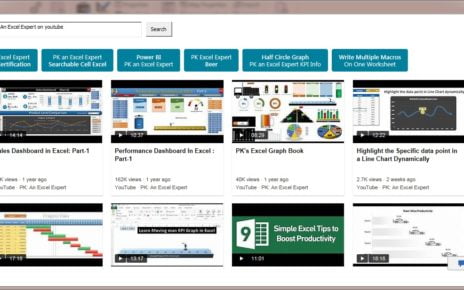
Dynamic Pivot Table with Multiple Tables using Power Query
In this article, we have created a dynamic Pivot Table report from multiple tables. We have taken 4 different yearly Sales
Informative KPI Indicator Chart Version-2
This is the 2nd version of Informative KPI Indicator Chart. In this chart I have used a RAG color pallet