In today's data-driven world, visualization of data is an essential aspect of decision-making. Excel is a powerful tool which can
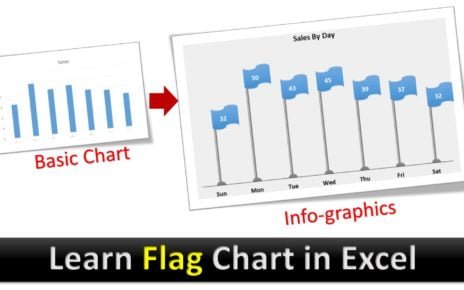
If you have a small data set and you want to create an attractive chart then Flag chart is very
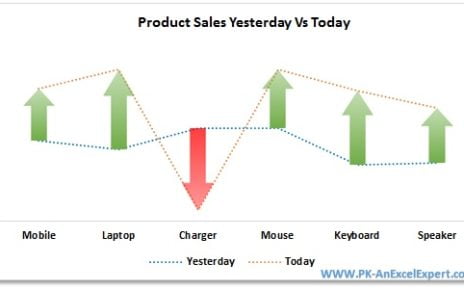
In this article you will learn how to create Yesterday Vs Today Sales Chart in Excel. In this chart we