4D Printing Dashboard in Excel is a professionally designed, ready-to-use analytics template that empowers manufacturing professionals to track, analyze, and optimize their 4D printing operations directly in Microsoft Excel. Unlike standard manufacturing dashboards, this template is purpose-built for the unique demands of 4D printing — where materials transform shape after production using stimuli like heat, moisture, or light. With 5 interactive dashboard pages, 15+ dynamic charts, and 5 high-level KPI cards, this Excel template delivers a complete performance management system for additive manufacturing teams, R&D labs, and production facilities.
Whether you need to evaluate printing technology efficiency, compare material quality across suppliers, or present production profitability to stakeholders, the 4D Printing Dashboard in Excel gives you everything in one place. Simply replace the sample data with your own records, click Refresh All, and the entire dashboard updates automatically — no macros, no VBA, and no advanced Excel skills required.
📌 Click here to Purchase 4D Printing Dashboard in Excel
Key Features of 4D Printing Dashboard in Excel
The 4D Printing Dashboard in Excel includes a comprehensive set of features designed specifically for additive manufacturing analytics. This template includes 5 interactive dashboard pages that cover every dimension of your 4D printing workflow: Overview, Material Analysis, Technology Insights, Client & Region, and Quality & Production.
- 5 KPI Cards on Overview Page – Total Records, Total Material Cost, Net Profit, Average Quality Score, and Transform Success % provide instant high-level visibility into operations.
- 15+ Dynamic Charts – From Profit Margin % by Month to Total Revenue by Printing Technology, every chart delivers actionable insights without manual calculations.
- Interactive Slicers – Multiple slicer controls on the Overview page allow you to filter the entire dashboard by Region, Priority, Client Type, Status, and more in one click.
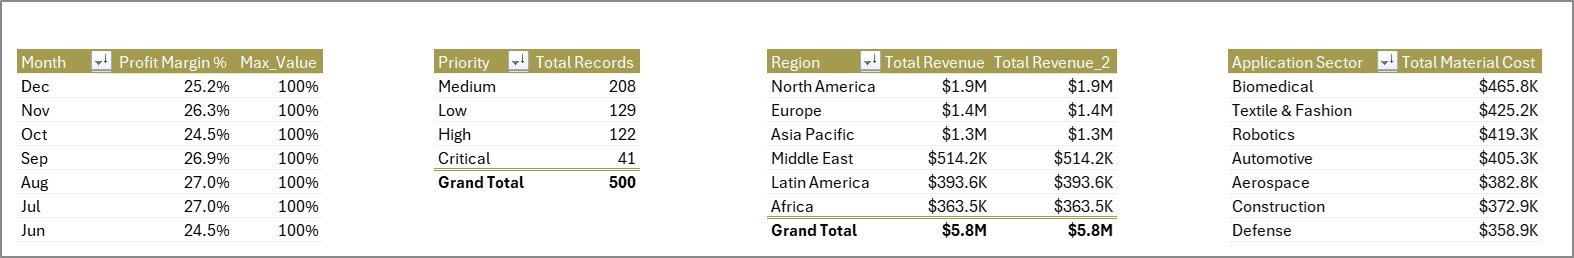
- Auto-Refresh Pivot Tables – A hidden Support sheet contains all pivot tables powering the dashboard. Simply go to Data → Refresh All after updating data.
- 4D Printing-Specific Metrics – Unique KPIs like Shape Memory Trigger analysis, Complexity Level tracking, and Printer Model performance make this template ideal for advanced manufacturing environments.
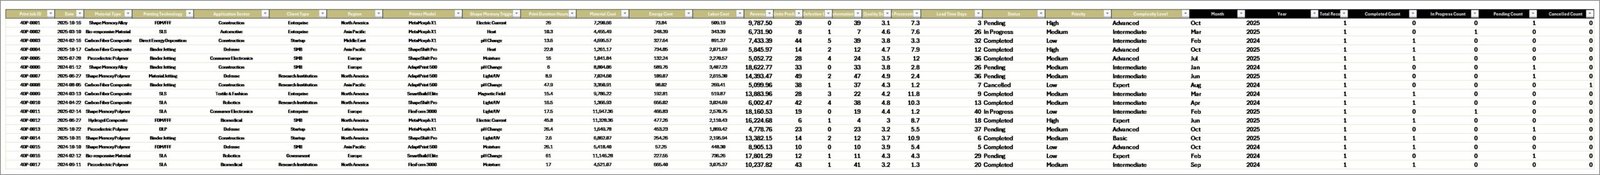
- Structured Data Sheet – A clean, organized data sheet where you enter your production records. All charts and KPIs feed from this single source.
Dashboard Pages Explained
1. Overview Page
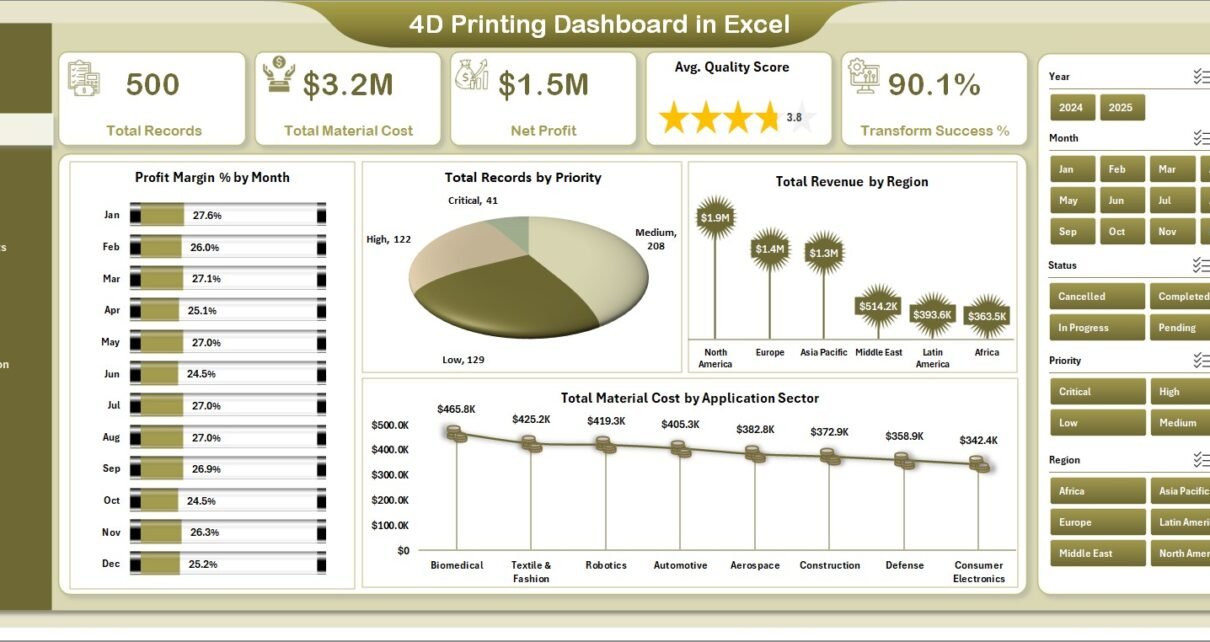
The Overview page serves as the command center of your 4D printing analytics. At the top, you will find 5 KPI cards displaying Total Records, Total Material Cost, Net Profit, Average Quality Score, and Transform Success Percentage. These cards give you an immediate snapshot of your entire operation.
Below the KPI cards, the page features 4 key charts: Profit Margin % by Month tracks your profitability trend over time. Total Records by Priority helps you understand workload distribution. Total Revenue by Region shows geographic performance breakdowns. Total Material Cost by Application Sector reveals where your material spend is concentrated. Multiple slicers sit alongside the charts, letting you filter the entire dashboard in real time.
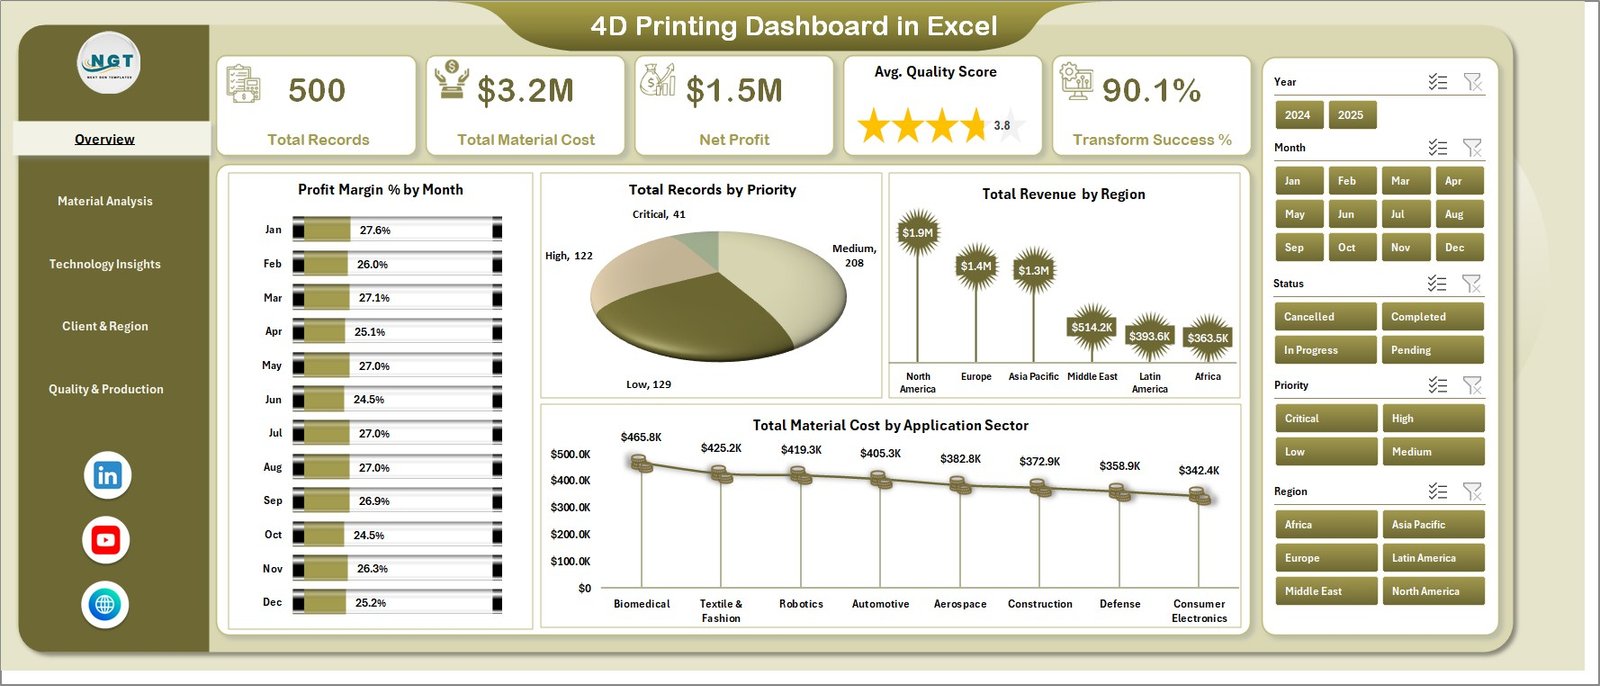
4D Printing Dashboard in Excel
2. Material Analysis
The Material Analysis page dives deep into the performance of materials and equipment used in your 4D printing processes. This page provides 4 analytical charts: Total Revenue by Printer Model shows which machines are generating the most value. Total Units Produced by Complexity Level helps evaluate production capacity across different job complexities. Average Quality Score by Material Type identifies which materials consistently deliver superior results. Total Successful Transforms by Shape Memory Trigger reveals how effectively different trigger mechanisms are performing — a metric unique to 4D printing operations.
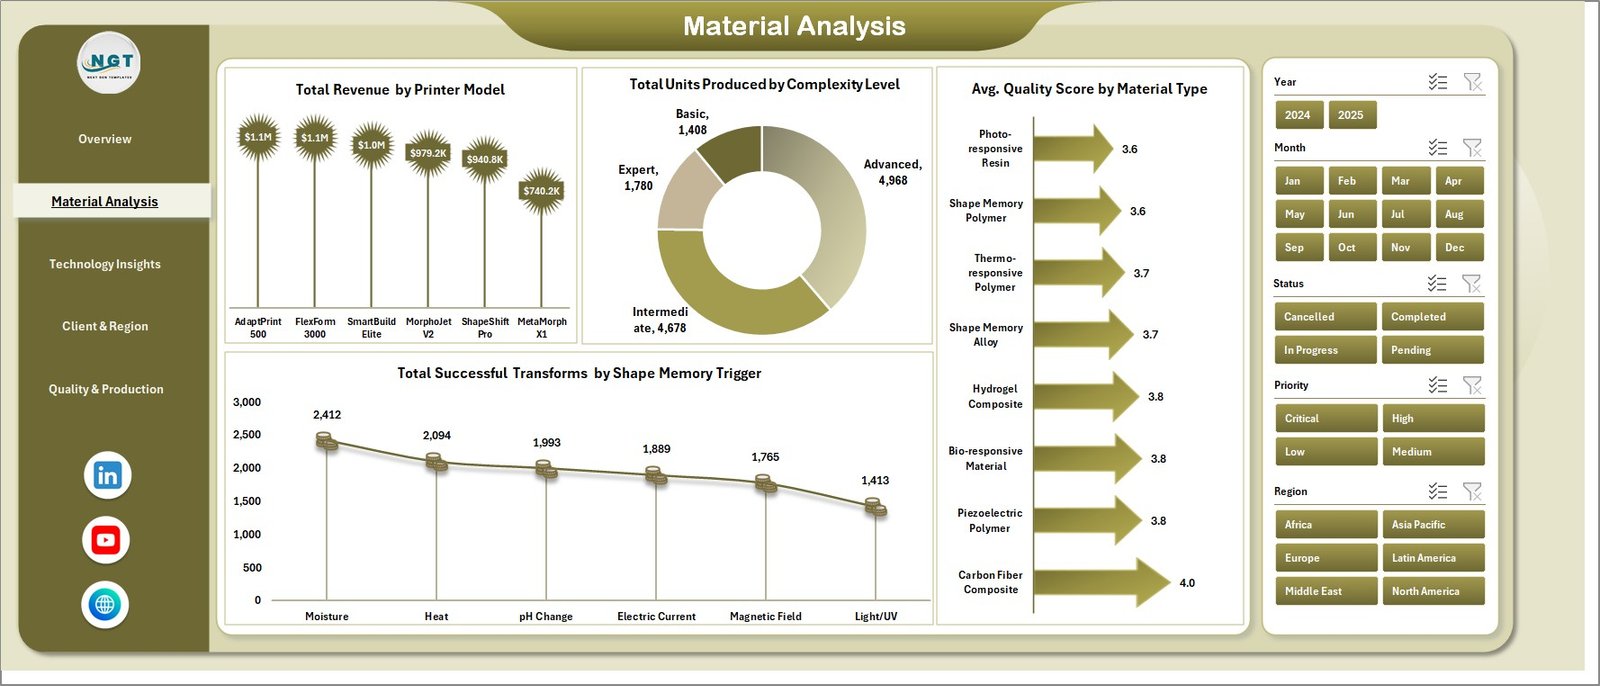
Material Analysis
3. Technology Insights
The Technology Insights page focuses on comparing printing technologies and their impact on production efficiency and revenue. This page visualizes 4 important metrics: Total Revenue by Printing Technology identifies which printing methods yield the highest returns. Average Print Duration by Printing Technology shows time efficiency across different methods. Total Revenue by Complexity Level helps correlate job complexity with revenue generation. Total Units Produced by Printer Model rounds out the analysis by connecting output volume to specific machines.
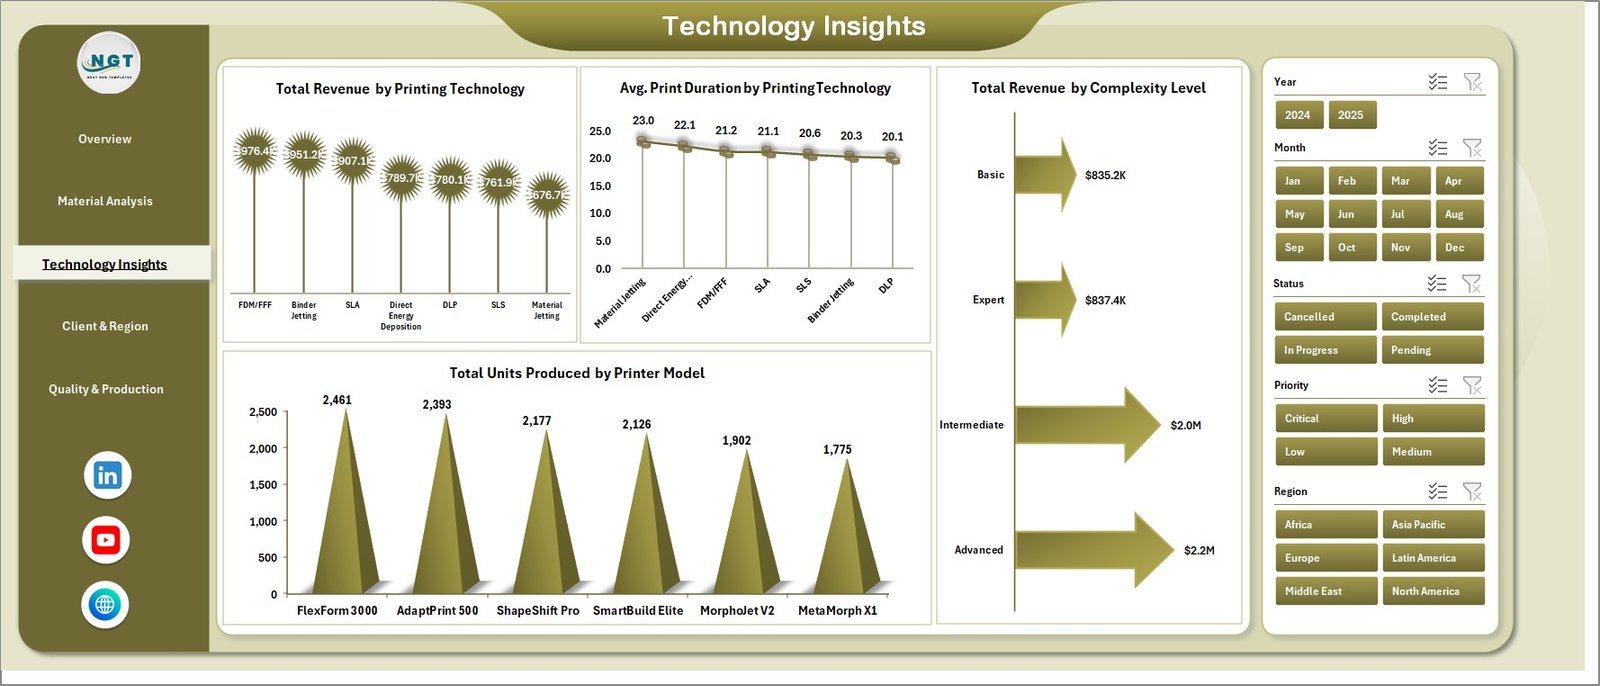
Technology Insights
4. Client & Region
The Client & Region page provides a geographic and client-based breakdown of your 4D printing business performance. It features 4 charts: Total Revenue by Client Type segments your income by customer category. Total Material Cost by Region highlights where your spending is highest geographically. Profit Margin % by Client Type reveals which client segments are the most profitable. Average Quality Score by Region helps identify regional quality patterns and potential improvement areas.
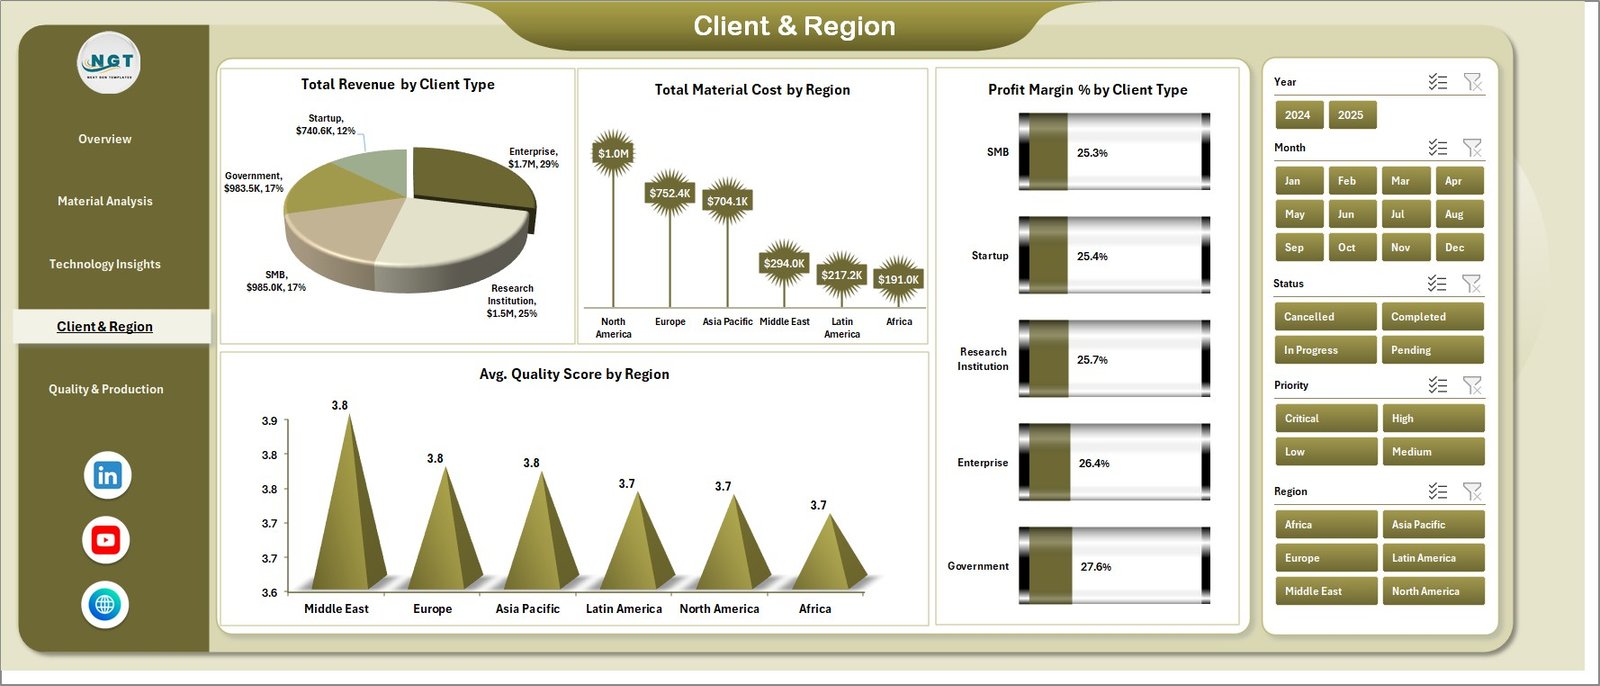
Client & Region
5. Quality & Production
The Quality & Production page helps you monitor overall production health and cost management. It presents 3 analytical views: Total Records by Status gives you a clear picture of how many jobs are completed, in-progress, or pending. Total Revenue by Month tracks your monthly income trend. Total Material Cost by Priority breaks down where your high-priority versus standard jobs are consuming resources.
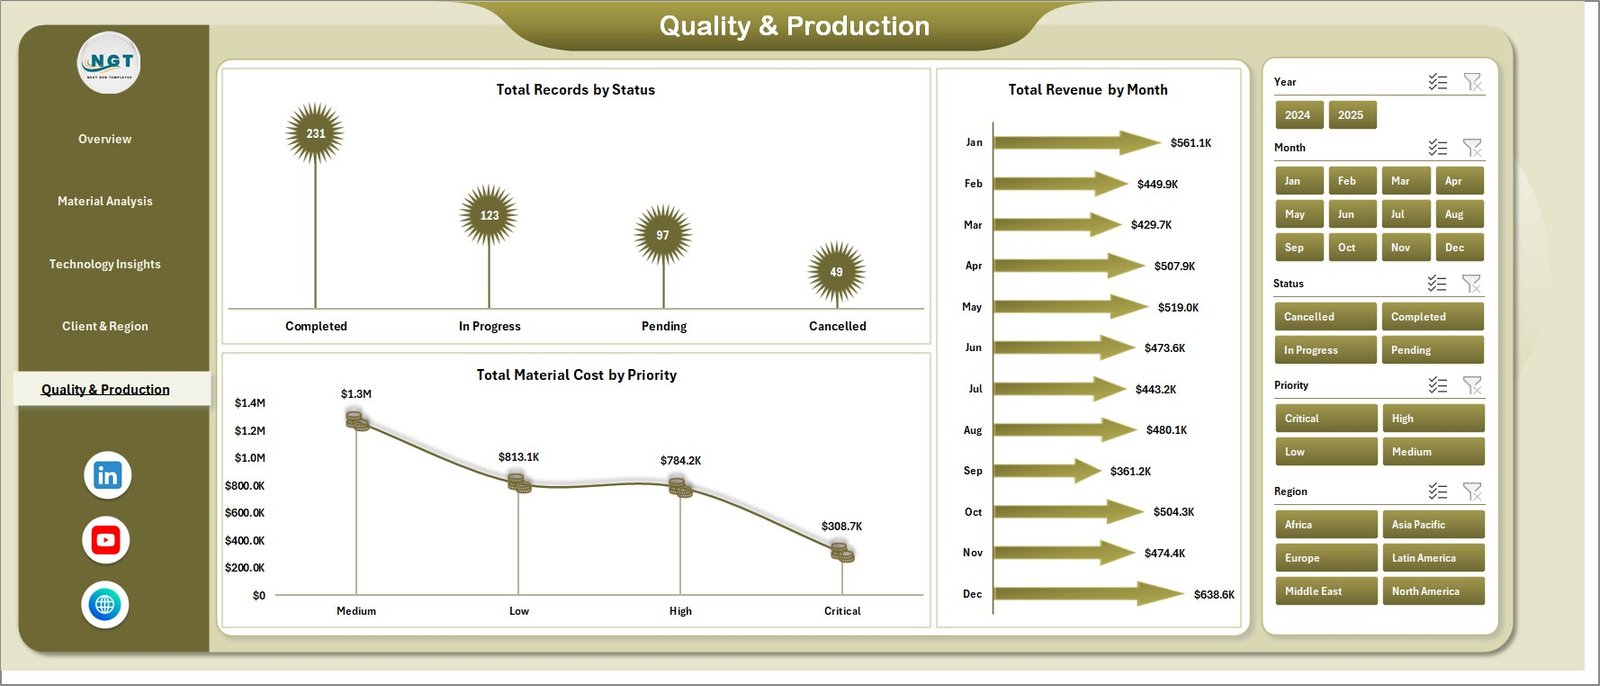
Quality & Production
6. Data Sheet Tab
The Data Sheet is where all your production records live. This structured tab contains sample data in the exact format needed by the dashboard. To use the template, simply replace the sample rows with your own 4D printing production data — including fields for material type, printer model, client information, region, revenue, cost, quality scores, and more. All pivot tables and charts feed directly from this single sheet.
Data Sheet Tab
7. Support Sheet
The Support sheet is the engine behind the entire dashboard. It contains multiple pivot tables that aggregate and process data from the Data Sheet to populate all charts and KPI cards across the 5 dashboard pages. After updating your data, simply navigate to the Data tab in the Excel Ribbon and click Refresh All — every pivot table refreshes and every chart updates automatically. You can keep this sheet hidden for a cleaner presentation experience.
Support Sheet Tab
Advantages of 4D Printing Dashboard in Excel
- Zero Learning Curve – No VBA, macros, or complex formulas. Just replace data and refresh.
- Complete Manufacturing Visibility – 5 specialized pages cover every dimension of 4D printing operations from material quality to client profitability.
- Unique 4D Printing KPIs – Shape Memory Trigger, Transform Success %, and Complexity Level metrics are not available in generic manufacturing dashboards.
- Time Savings – Eliminates hours of manual report building by automating data aggregation through pivot tables.
- Presentation Ready – Professional design with color-coded charts suitable for board meetings and stakeholder presentations.
- Works Offline – Entirely Excel-based, no internet connection required once downloaded.
Opportunities for Improvement
- Users with very large datasets (10,000+ records) may want to optimize pivot table refresh performance by limiting date ranges or using Excel’s Power Query for data transformation.
- Adding conditional formatting rules to the Data Sheet could help identify outlier values before refreshing the dashboard.
- Organizations using multiple printing facilities could benefit from adding a Facility or Plant filter to the slicer panel for site-level analysis.
- Integration with live data sources through Power Query could enable real-time dashboard updates for high-volume production environments.
Best Practices
- Keep data consistent – Ensure all column headers match the original format when adding new records to the Data Sheet.
- Refresh after every update – Always go to Data → Refresh All after entering new data to update all pivot tables and charts.
- Use slicers strategically – Start with the broadest view on the Overview page, then drill down using slicers for specific regions, priorities, or time periods.
- Hide the Support sheet – Right-click the Support sheet tab and select Hide for a cleaner presentation when sharing with stakeholders.
- Back up regularly – Save a copy of your working file periodically, especially before making bulk data changes.
- Combine with related dashboards – For comprehensive manufacturing analytics, pair this with the 3D Printing Manufacturing Dashboard in Excel or explore the Manufacturing Excellence Bundle for complete coverage.
Explore Relevant Templates
- 3D Printing Manufacturing Dashboard in Excel – Track standard 3D printing production metrics including output, quality, and cost analysis.
- 3D Printing Manufacturing Dashboard in Power BI – Advanced Power BI version with interactive visuals and drill-through capabilities.
- Ceramic Manufacturing Dashboard in Excel – Monitor ceramic production performance, material costs, and quality scores.
- Battery Manufacturing Dashboard in Excel – Track battery production output, defect rates, and operational efficiency.
- Manufacturing Excellence Bundle – 8 premium Excel + Power BI manufacturing templates at 44% savings.
Frequently Asked Questions
What is a 4D Printing Dashboard in Excel used for?
A 4D Printing Dashboard in Excel is used to track, analyze, and visualize key production metrics specific to 4D printing operations. It monitors KPIs like Total Material Cost, Net Profit, Transform Success %, Quality Scores, and Revenue across multiple dimensions including region, client type, printing technology, and material type.
How many dashboard pages does this template include?
The 4D Printing Dashboard in Excel includes 5 interactive dashboard pages: Overview, Material Analysis, Technology Insights, Client & Region, and Quality & Production. It also includes a structured Data Sheet and a hidden Support Sheet containing the pivot tables that power the entire dashboard.
What is the best Excel template for tracking 4D printing production?
The 4D Printing Dashboard in Excel from NextGenTemplates is one of the best options available. It features 5 KPI cards, 15+ dynamic charts, interactive slicers, and auto-refresh pivot tables designed specifically for 4D printing workflows including Shape Memory Trigger tracking and Complexity Level analysis.
Do I need VBA or macros to use this dashboard?
No. This dashboard is built entirely with standard Excel features including pivot tables, charts, and slicers. You simply replace the sample data in the Data Sheet and click Refresh All. No VBA, macros, or advanced programming skills are needed.
Can I customize this dashboard for my specific 4D printing operation?
Yes. You can modify chart types, add new columns to the Data Sheet, create additional pivot tables in the Support sheet, or adjust slicer filters to match your specific manufacturing workflow. The template is fully editable in Microsoft Excel.
What is the difference between a 3D Printing and 4D Printing Dashboard?
A 3D Printing Dashboard tracks standard additive manufacturing metrics like print volume and defect rates. The 4D Printing Dashboard in Excel adds specialized metrics unique to 4D printing including Shape Memory Trigger success rates, Transform Success %, and Complexity Level analysis that track how printed materials respond to stimuli after production.
Conclusion
The 4D Printing Dashboard in Excel is a powerful, ready-to-use analytics tool that brings clarity to your 4D printing production data. With 5 interactive pages, 15+ dynamic charts, KPI cards, and interactive slicers, it provides the comprehensive visibility needed to optimize material usage, improve quality scores, and maximize profitability across your manufacturing operations.
Whether you are a manufacturing engineer, operations manager, R&D professional, or business analyst, this template transforms raw production data into actionable insights in minutes. Download it today and start making data-driven decisions for your 4D printing operations.
📌 Click here to Purchase 4D Printing Dashboard in Excel
🎥 Visit our YouTube channel for step-by-step video tutorials: Youtube.com/@PK-AnExcelExpert