Internal audits play a huge role in strengthening controls, improving processes, and reducing organizational risk. Every department depends on accurate audit insights to identify gaps before they turn into bigger issues. However, audit data usually sits in scattered Excel files, emails, shared folders, or manual reports. Because of this, leaders struggle to track audit progress, severity of findings, and risk levels in real time.
An Internal Audit Dashboard in Excel solves this problem. It combines all audit information into one organized, visual, and interactive dashboard. You can track audit scores, severity ratings, open issues, audit costs, and monthly performance trends without wasting hours on manual reporting. Since the entire dashboard runs in Excel, you can start using it immediately without learning any complex tools.
In this detailed guide, you will learn everything about the Internal Audit Dashboard in Excel, including how it works, its features, benefits, best practices, and answers to common questions. You will also explore each dashboard page to understand how it supports better audit oversight.
Click to Purchases Internal Audit Dashboard in Excel
What Is an Internal Audit Dashboard in Excel?
An Internal Audit Dashboard in Excel is a ready-to-use performance monitoring tool that helps audit teams track all key audit metrics in one place. It visualizes audit scores, risk ratings, findings, cost, severity distribution, regional performance, and progress status for every audit.
Because the dashboard runs on Excel, you can update the data anytime, and the visuals refresh instantly. You do not need advanced training, coding, or BI tools. Instead, you get an easy, interactive, and professional-looking audit management solution built using standard Excel features such as pivot tables, slicers, conditional formatting, and charts.
Why Do Organizations Need an Internal Audit Dashboard?
Most companies audit dozens of departments, regions, and processes every year. Although this creates huge amounts of data, teams rarely get real-time insights. As a result, problems stay invisible for too long.
An Internal Audit Dashboard helps because it:
-
Shows real-time audit performance
-
Gives leaders quick visibility on risks
-
Highlights severity of issues
-
Tracks progress on audit findings
-
Shows cost trends for better budgeting
-
Compares performance across departments, auditors, and regions
When teams use a structured dashboard, they track issues early, monitor follow-up actions, and reduce organizational risk.
Key Features of the Internal Audit Dashboard in Excel
This dashboard includes several powerful features that make audit monitoring fast, simple, and effective.
✔ Page Navigator
The left-side page navigator helps you move easily between different analytical pages. You do not need to scroll, search, or open multiple Excel sheets.
✔ Five Analytical Pages
The dashboard includes five detailed analysis pages:
-
Overview Page
-
Department Analysis
-
Auditor Analysis
-
Region Analysis
-
Month Analysis
Each page includes slicers, cards, and charts designed to show critical audit insights instantly.
✔ Support Sheet
This sheet stores lookup values, dropdown lists, and formulas that help the dashboard function smoothly.
✔ Data Sheet
This is where you store audit details such as audit score, risk score, severity rating, department, auditor name, region, and cost. You only update this sheet, and all dashboard visuals refresh automatically.
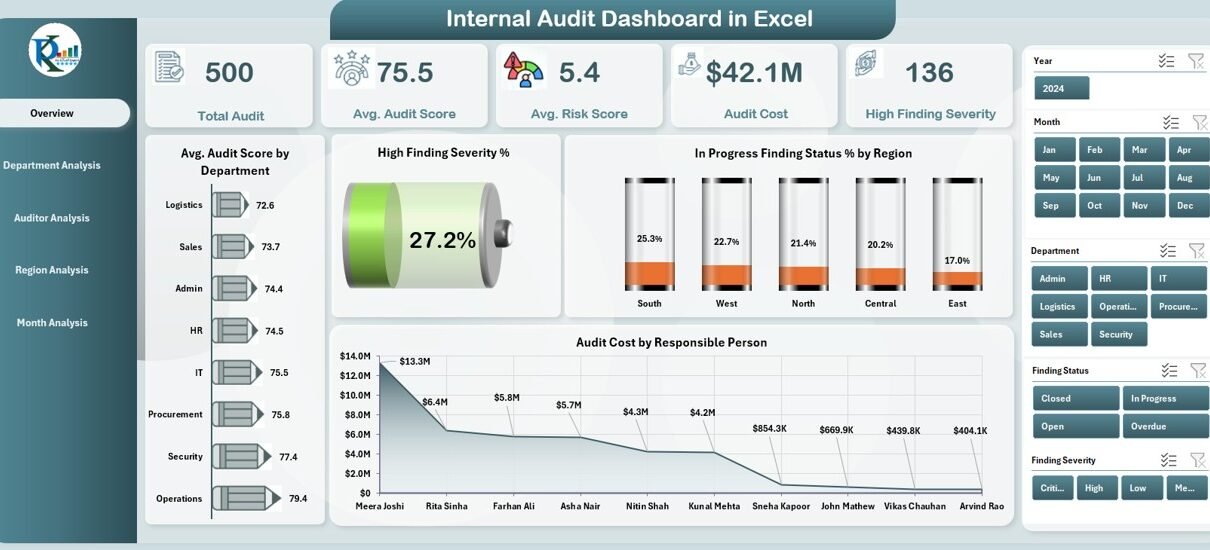
Overview Page: What Does It Show?

The Overview Page acts as the main performance summary for the entire audit program. It gives a quick snapshot of all key metrics so leaders understand the overall audit health immediately.
This page includes:
📌 KPI Cards
You get five KPI cards that show:
-
Total Audits
-
Average Audit Score
-
Average Risk Score
-
Total Audit Cost
-
Total Open Findings
These cards help you understand the overall audit situation at a glance.
📌 Four Major Charts
This page includes four high-impact charts:
-
Avg. Audit Score by Department – Helps compare audit performance across departments.
-
High Finding Severity % – Shows the percentage of high-severity issues.
-
In-Progress Finding Status % by Region – Tracks follow-up progress.
-
Audit Cost by Responsible Person – Shows cost distribution across team members.
This page acts as the command center for audit decisions.
Department Analysis: How Does It Help?

Department-level audit performance plays a huge role in risk management. Some departments may perform well, while others carry higher risks. Because the dashboard shows everything visually, you can compare departments within seconds.
📌 What You See on This Page
The Department Analysis page includes four essential charts:
-
Avg. Risk Score by Department – Helps identify high-risk areas.
-
Critical Finding Severity % by Department – Shows severity of issues.
-
Audit Cost by Department – Helps manage audit budgets.
-
Issue Count by Department – Tracks how many issues each department generates.
This information supports targeted improvement and departmental risk mitigation.
Auditor Analysis: Why Does It Matter?

Every auditor has a unique working style, cost impact, and performance pattern. The Auditor Analysis page helps evaluate auditors clearly and fairly.
📌 Charts on This Page
This page includes:
-
Avg. Audit Score by Auditor – Helps evaluate audit quality.
-
Avg. Risk Score by Audit Name – Shows how risky each audit is.
-
Total Audits by Audit Name – Highlights workload distribution.
-
High Finding Severity % by Auditor Name – Shows severity pattern across auditors.
These insights support fair evaluation, upskilling, workload planning, and performance reviews.
Click to Purchases Internal Audit Dashboard in Excel
Region Analysis: Tracking Performance Across Locations
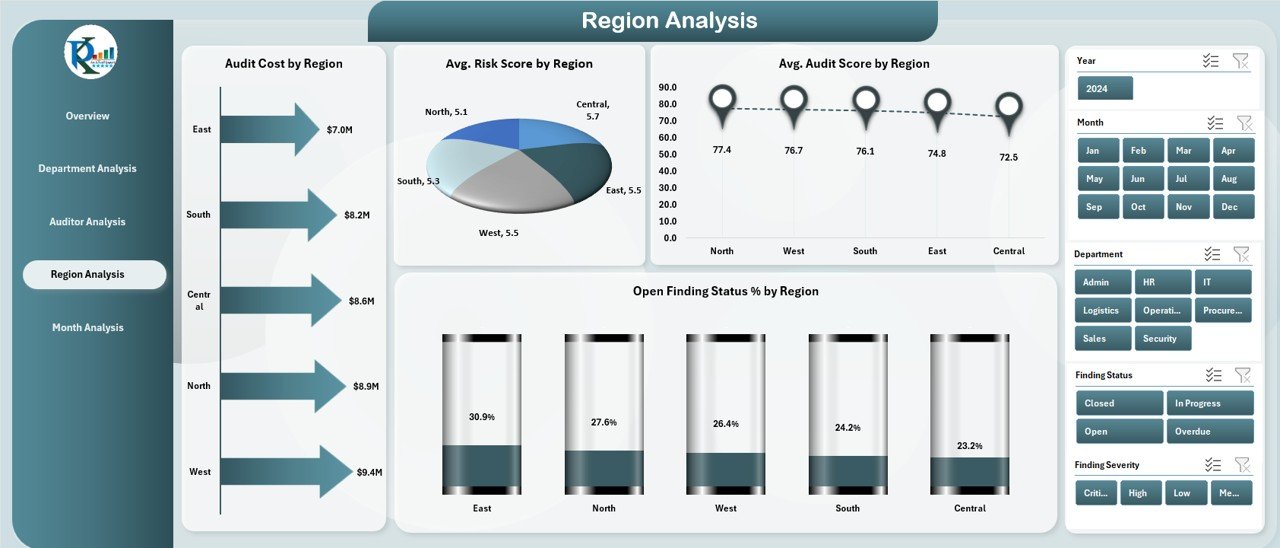
Organizations operating across multiple regions must track audit performance geographically. Some regions may consistently perform better, while others need more support.
📌 Charts Included
The Region Analysis page shows:
-
Audit Cost by Region – Tracks regional audit expenses.
-
Avg. Risk Score by Region – Shows risk patterns across locations.
-
Avg. Audit Score by Region – Evaluates performance region-wise.
-
Open Finding Status % by Region – Tracks follow-up status and backlog.
This page helps leaders identify regional risk factors and prioritize improvement.
Month Analysis: Understanding Monthly Audit Trends
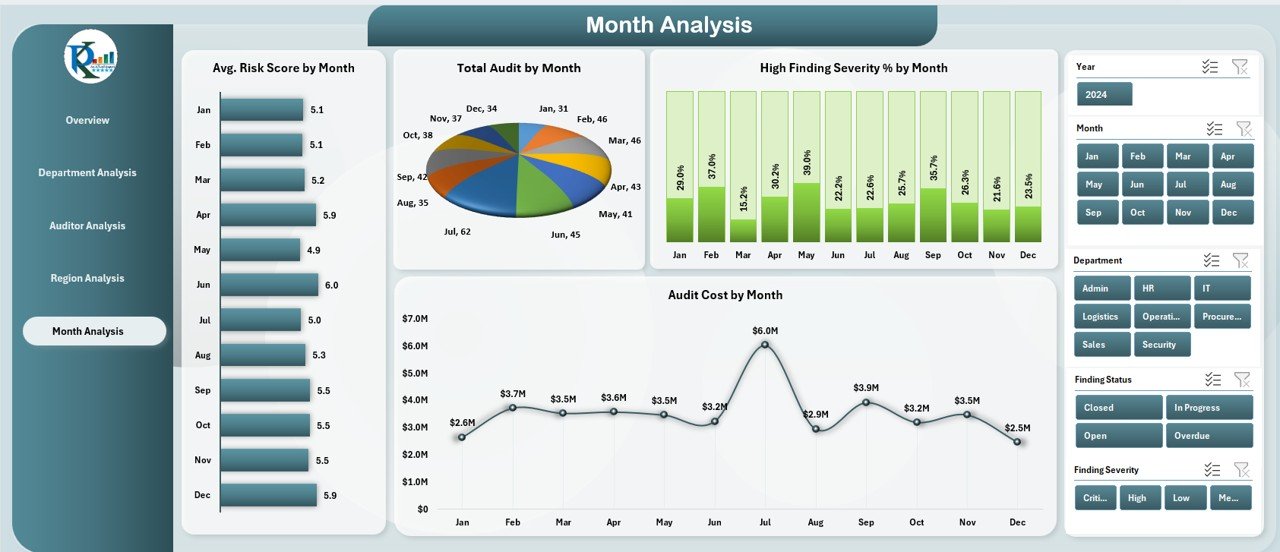
Audit performance changes every month as new audits take place and findings get resolved. The Month Analysis page helps track monthly variations to understand patterns and trends.
📌 Charts on This Page
-
Avg. Risk Score by Month – Shows monthly risk fluctuations.
-
Total Audits by Month – Tracks workload trends.
-
High Finding Severity % by Month – Shows severity distribution.
-
Audit Cost by Month – Tracks how audit expenses change over the year.
This helps teams plan resources, budgets, and audit frequency more effectively.
Advantages of an Internal Audit Dashboard in Excel
Using an Internal Audit Dashboard delivers several important advantages. These benefits help organizations stay compliant, reduce risks, and improve performance.
✔ 1. Faster Decision-Making
Excel dashboards help leaders make quicker decisions because they see all audit metrics on one screen.
✔ 2. Better Risk Visibility
Teams track high-risk areas, rising severity, and unresolved issues easily.
✔ 3. Immediate Insights
Charts and KPI cards show real-time insights instead of static reports.
✔ 4. Zero Learning Curve
Since the dashboard runs on Excel, teams do not need special skills.
✔ 5. Improved Accountability
The dashboard shows performance by department, region, and auditor, which strengthens responsibility and follow-up.
✔ 6. Data Accuracy
Because the dashboard pulls all calculations from the data sheet, you reduce manual errors.
✔ 7. Time Savings
Teams save hours every month because they do not create reports manually.
✔ 8. Scalability
You can add more KPIs, departments, or auditors anytime without redesigning the dashboard.
Best Practices for the Internal Audit Dashboard in Excel
To get the best results from your audit dashboard, follow these practical best practices:
✔ 1. Keep the Data Sheet Clean
Always store consistent and structured data in the data sheet. Clean data gives correct results.
✔ 2. Use Meaningful KPI Names
Choose simple KPI names so everyone understands the dashboard.
✔ 3. Refresh Data Regularly
Update audit data weekly or monthly to keep the insights relevant.
✔ 4. Use Slicers for Easy Filtering
Slicers help you switch between months, departments, regions, and auditors instantly.
✔ 5. Avoid Overloading the Dashboard
Use only the most important KPIs and charts. Simple dashboards work better than cluttered ones.
✔ 6. Use Conditional Formatting
Highlight high-severity issues, overdue findings, or risk hotspots using color coding.
✔ 7. Maintain One Support Sheet
Store lookup values, lists, and formulas in one support sheet to keep the dashboard organized.
✔ 8. Test the Dashboard Before Sharing
Check slicers, dropdowns, formulas, and charts to avoid any reporting errors.
Conclusion
An Internal Audit Dashboard in Excel transforms the way organizations track audit performance. It brings all relevant metrics into one clean, interactive, and intelligent view. When leaders see results instantly, they respond faster, plan better, and reduce risks effectively.
Because this dashboard uses Excel, teams of all sizes can use it without technical training. You only update the data sheet, and the entire dashboard refreshes automatically. With pages for departments, auditors, regions, and months, you gain complete visibility across the audit landscape.
This dashboard is not only a reporting tool but also a strategic decision-making partner. When teams use it regularly, they build stronger controls, improve compliance, and strengthen organizational performance.
Frequently Asked Questions (FAQs)
Click to Purchases Internal Audit Dashboard in Excel
1. What is an Internal Audit Dashboard in Excel?
It is a visual reporting tool that shows audit performance, findings, risk scores, and severity status using charts and KPI cards.
2. Who can use this dashboard?
Internal auditors, risk managers, compliance teams, department heads, and leadership teams can use this dashboard.
3. Do I need advanced Excel skills?
No. You only update the data sheet, and the dashboard updates automatically.
4. Can I add more KPIs to the dashboard?
Yes. You can add more KPIs, columns, or charts at any time because the dashboard uses pivots and slicers.
5. How often should I update the dashboard?
You should update it weekly or monthly based on your audit cycle.
6. Can I customize the dashboard design?
Yes. You can change chart colors, add new pages, modify KPI cards, or update slicers based on your needs.
7. Does this dashboard support monthly and yearly views?
Yes. The Month Analysis page helps you view trends across months.
Visit our YouTube channel to learn step-by-step video tutorials