Accounting firms handle many daily tasks. They track client projects, billing hours, revenue, compliance, audits, cash flow, productivity, and many other financial KPIs. When this information sits in multiple Excel files or separate systems, teams struggle to understand the real performance. Therefore, decision-making slows down, productivity drops, and firms lose growth opportunities.
A Accounting Firms KPI Dashboard in Power BI solves this problem. It brings all accounting KPIs into one clear and interactive dashboard. You track Monthly Trends, MTD vs YTD comparison, Target vs Actual performance, and Previous Year vs Current Year numbers in seconds. Power BI also gives automation, strong visuals, and fast reporting.
This article explains everything about the dashboard. You will learn its pages, features, advantages, best practices, and answers to common questions.
Click to Purchases Test Accounting Firms KPI Dashboard in Power BI
What Is an Accounting Firms KPI Dashboard in Power BI?
An Accounting Firms KPI Dashboard in Power BI is a ready-to-use reporting tool built for accounting firms, CA offices, tax consultants, auditing teams, corporate finance departments, and outsourced accounting service providers. It provides a fully structured way to track:
-
Financial performance
-
Client billing
-
Audit progress
-
Staff productivity
-
Compliance
-
Engagement performance
-
Cash flow insights
-
Monthly and yearly targets
Because everything appears in one dashboard, accounting teams make faster decisions and reduce manual reporting effort.
Click to Purchases Test Accounting Firms KPI Dashboard in Power BI
Why Do Accounting Firms Need a KPI Dashboard?
Accounting firms work with many numbers. Without a structured dashboard:
-
You lose clarity on revenue and billing.
-
You fail to measure staff utilization.
-
You spend time searching for data.
-
You miss financial trends.
-
You struggle to meet monthly targets.
-
You work with outdated information.
A dashboard brings accuracy, speed, and control to your reporting process.
Key Features of the Accounting Firms KPI Dashboard in Power BI
This dashboard has three main analytical pages. Each page gives a clear view of KPIs and supports quick decision-making.
1. Summary Page – Your Main Financial Overview
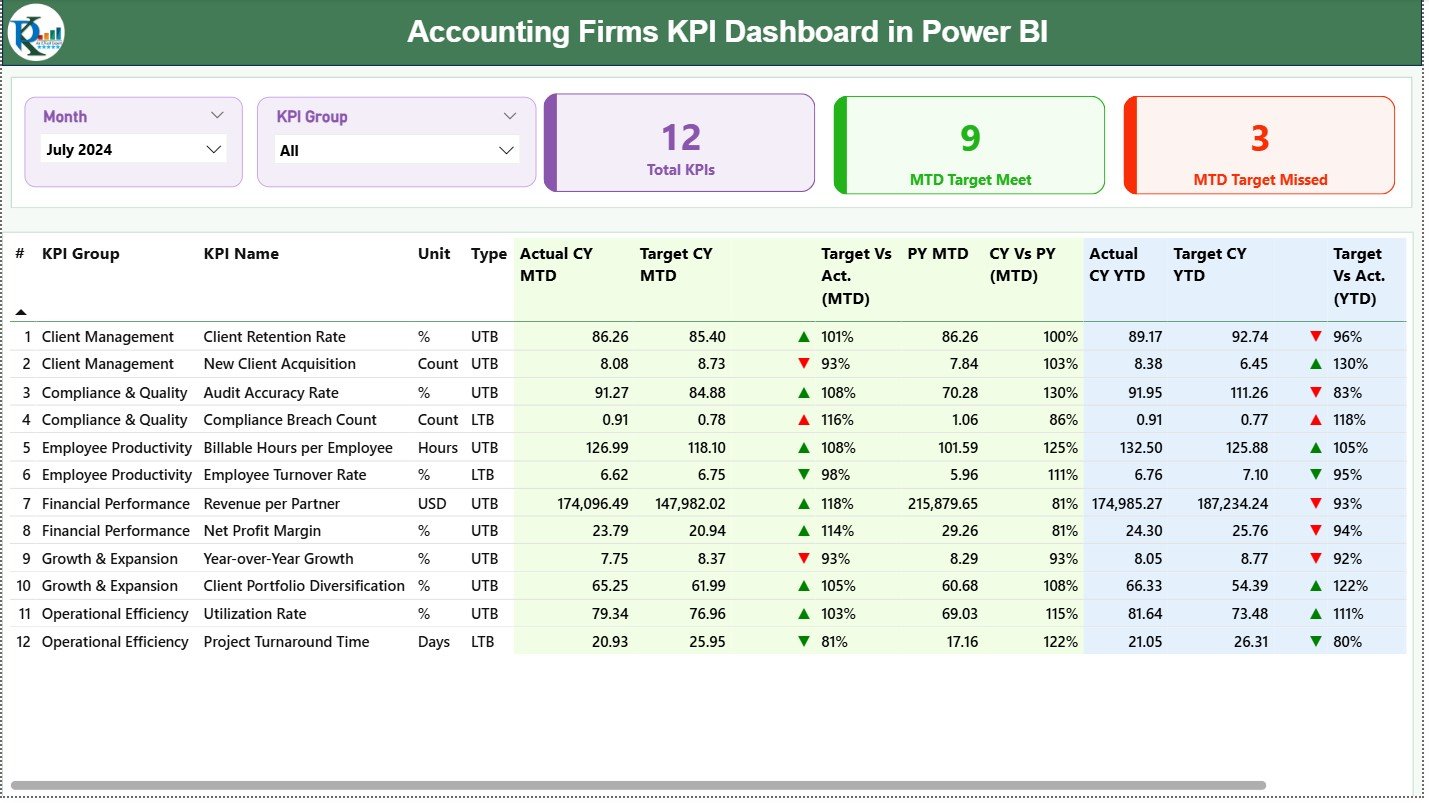
The Summary Page works as the main control panel of the dashboard. It shows the entire performance of KPIs for the selected month.
Key Elements of the Summary Page
✔ Month Slicer
Choose the month you want to review.
✔ KPI Group Slicer
Filter KPIs by categories such as Revenue KPIs, Billing KPIs, Audit KPIs, Employee Productivity KPIs, Project KPIs, etc.
✔ Three Performance Cards
These cards give a high-level view:
-
Total KPIs Count
-
MTD Target Met Count
-
MTD Target Missed Count
You instantly understand if the firm performs well this month.
Detailed KPI Table on Summary Page
This table shows all KPI details in one place. It includes:
-
KPI Number – Unique ID for each KPI
-
KPI Group – Category
-
KPI Name – Name of the KPI
-
Unit – Measurement unit
-
Type (LTB/UTB) – Lower The Better or Upper The Better
-
Actual CY MTD – Current Year Month-to-Date
-
Target CY MTD – Target MTD
-
MTD Icon – ▲ green or ▼ red
-
Target vs Actual (MTD) – Actual / Target
-
PY MTD – Previous Year MTD
-
CY vs PY (MTD) – Current MTD / Previous MTD
-
Actual CY YTD – Current Year YTD
-
Target CY YTD – Target YTD
-
YTD Icon – ▲ green or ▼ red
-
Target vs Actual (YTD) – Actual / Target
-
PY YTD – Previous Year YTD
-
CY vs PY (YTD) – Current / Previous
Because everything appears in a structured layout, accounting teams save time and make accurate decisions.
Click to Purchases Test Accounting Firms KPI Dashboard in Power BI
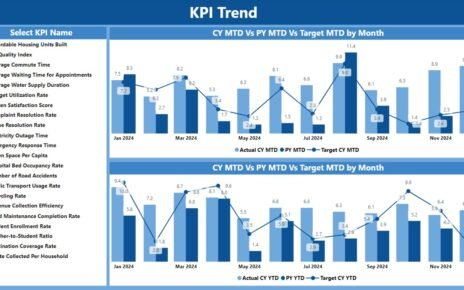
2. KPI Trend Page – Study Monthly and Yearly Movement
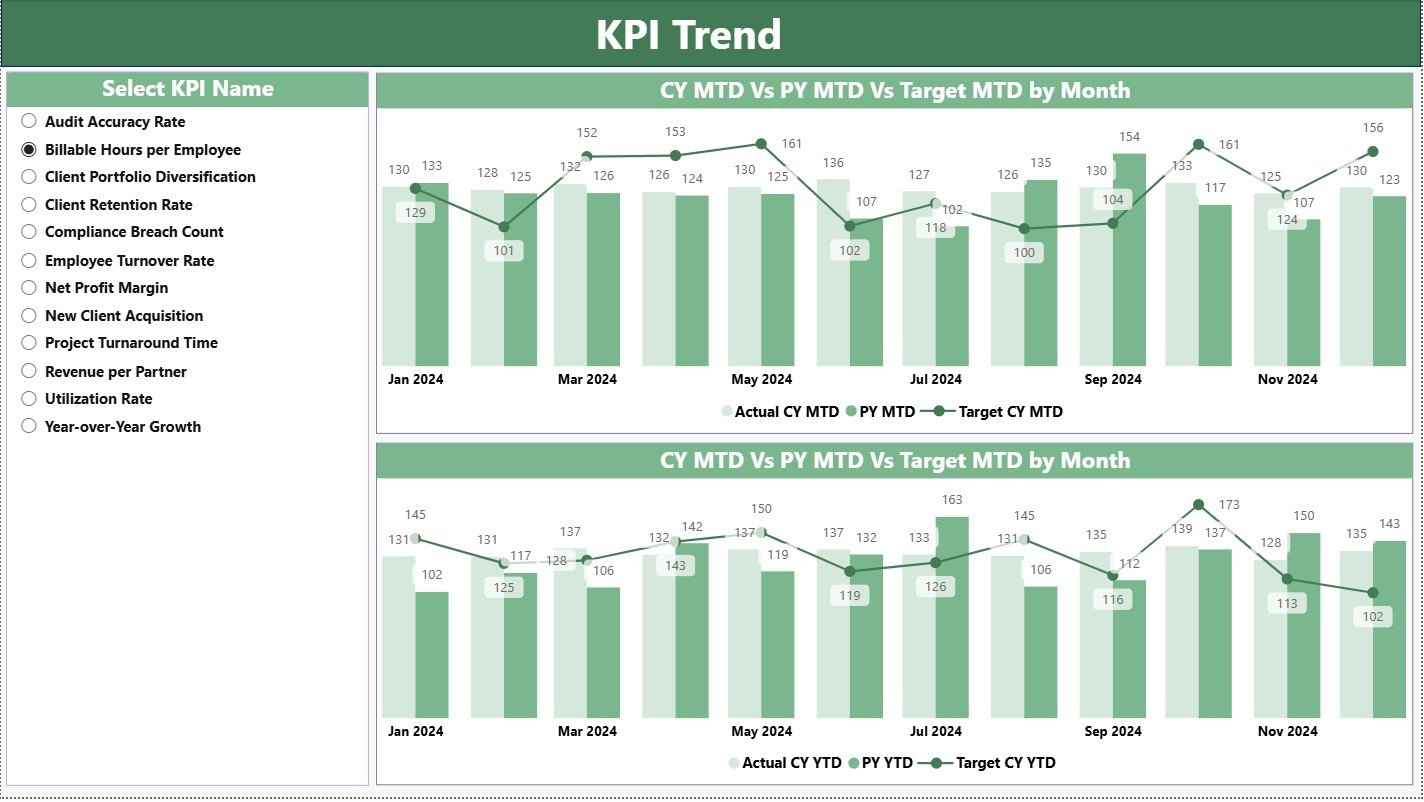
The KPI Trend Page helps you understand how KPIs move across months. Firms use it for long-term planning.
You See:
✔ A Slicer to Select KPI Name
✔ Two Combo Charts:
-
MTD Trend Chart: CY vs PY vs Target
-
YTD Trend Chart: CY vs PY vs Target
These visuals help you understand patterns and identify improvement areas.
3. KPI Definition Page – Drill-Through for Full Clarity
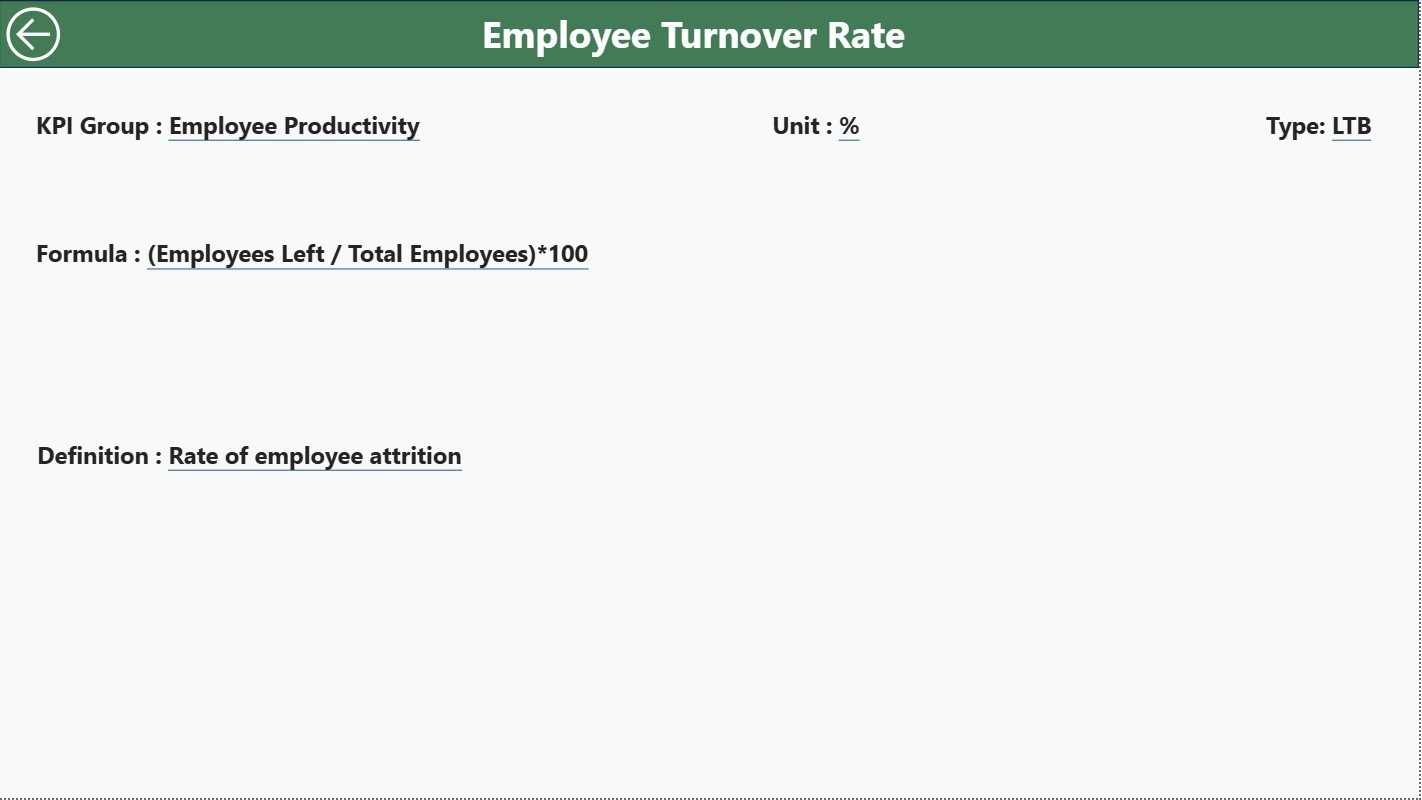
The KPI Definition Page gives complete information about each KPI. It stays hidden and opens only when you drill through from the Summary Page.
It Shows:
-
KPI Number
-
KPI Group
-
KPI Name
-
Unit
-
Type (LTB/UTB)
-
Formula
-
KPI Definition
A Back Button on the top left sends you back to the Summary Page.
How the Excel Data Source Works
The dashboard connects to an Excel file with three sheets. You only update these sheets and the dashboard updates instantly.
1. Input_Actual Sheet
Fill in:
-
KPI Name
-
Month (starting date of the month)
-
MTD Values
-
YTD Values
This sheet captures all actual performance numbers.
2. Input_Target Sheet
Fill in:
-
KPI Name
-
Month
-
Target MTD
-
Target YTD
This sheet handles the target values.
3. KPI Definition Sheet
Fill in:
-
KPI Number
-
KPI Group
-
KPI Name
-
Unit
-
Formula
-
KPI Definition
-
Type (LTB or UTB)
This defines the logic for each KPI.
Click to Purchases Test Accounting Firms KPI Dashboard in Power BI
Advantages of the Accounting Firms KPI Dashboard in Power BI
This dashboard brings powerful advantages for accounting firms. It improves reporting, enhances productivity, and supports smarter decisions.
1. One Dashboard for All Financial KPIs
You get one place to view all financial and operational KPIs. As a result, you stay organised.
2. Fast Decision-Making
You compare MTD, YTD, and PY numbers in seconds. This helps you act quickly.
3. Better Accuracy and Less Manual Work
You update only the Excel file. Power BI handles calculations and visuals.
4. Strong Client Performance Insights
You track billable hours, revenue contribution, and engagement success more clearly.
5. Improved Team Utilization
You see staff productivity KPIs and manage workload better.
6. Strong Forecasting
Trend charts help you predict performance and plan improvement steps.
7. Clear Target Achievement Tracking
The green and red icons make it easy to see which KPIs need attention.
8. Year-on-Year Comparison
CY vs PY metrics show the actual growth of the firm.
Click to Purchases Test Accounting Firms KPI Dashboard in Power BI
Best Practices for Using the Accounting Firms KPI Dashboard
Follow these best practices to get full value from the dashboard.
1. Update Excel Sheets Every Month
Accurate data gives accurate insights.
2. Use Clear KPI Definitions
Proper definitions reduce confusion and ensure consistent reporting.
3. Compare Targets Weekly
Do not wait until the end of the month.
4. Keep KPI Names Unique
Unique KPI names avoid data mapping issues.
5. Use Trend Charts for Long-Term Planning
These charts help you study performance movement over multiple periods.
6. Train Staff to Use Power BI
Staff training improves adoption and reporting accuracy.
7. Use LTB and UTB Correctly
-
UTB (Upper The Better): Revenue, billable hours, project completion
-
LTB (Lower The Better): Errors, pending audits, overdue payments
8. Review CY vs PY Numbers Regularly
Yearly comparison gives a clear performance picture.
Conclusion
The Accounting Firms KPI Dashboard in Power BI brings structure, speed, and clarity to financial reporting. It helps accounting firms track performance without manual effort. With its Summary Page, KPI Trend Page, and KPI Definition Page, you get a complete reporting system that supports better planning and smart decision-making.
When used regularly, this dashboard improves productivity, enhances accuracy, and strengthens overall firm performance.
Frequently Asked Questions (FAQs)
1. Who can use the Accounting Firms KPI Dashboard in Power BI?
Accounting firms, CA offices, auditing teams, tax consultants, and finance departments can use this dashboard.
2. Do I need technical skills to use this dashboard?
No. Just update the Excel sheets. Power BI updates everything automatically.
3. Can I add new KPIs to the dashboard?
Yes. You can add them in the KPI Definition sheet and update target and actual values.
4. Does this dashboard show yearly comparison?
Yes. It shows CY vs PY for both MTD and YTD.
5. Can I export visuals from Power BI?
Yes. Power BI allows exporting visuals, tables, and reports.
6. Can this dashboard work for multi-branch accounting firms?
Yes. You can add KPI Groups or filters for branches.
7. How often should I update the data?
Update monthly for accurate reporting.
8. Does the dashboard support drill-through analysis?
Yes. You can drill through to see detailed KPI definitions and formulas.
Click to Purchases Test Accounting Firms KPI Dashboard in Power BI
Visit our YouTube channel to learn step-by-step video tutorials