Organizations rely on test laboratories to certify products, materials, equipment, and processes. These certifications build trust, ensure safety, and support compliance with global standards. However, tracking test results, monitoring performance, and managing certification data often takes time when teams depend on scattered spreadsheets. Because of this, leaders fail to monitor the approval rate, test cost, rejection patterns, satisfaction ratings, and turnaround time.
A Test Lab Certifications Dashboard in Power BI solves all these problems. It brings all certification data into a single interactive dashboard. You understand trends quickly. You monitor approval rates instantly. You identify which lab performs well and where improvement is needed. You also improve the decision-making process because the entire team gets a clear view of the performance.
In this article, you will learn everything about the Test Lab Certifications Dashboard in Power BI. You will explore its structure, its pages, how it works, and why every business that depends on lab testing needs it. You will also find the advantages, best practices, and frequently asked questions so you can use this dashboard confidently.
Click to Purchases Test Lab Certifications Dashboard in Power BI
What Is a Test Lab Certifications Dashboard in Power BI?
A Test Lab Certifications Dashboard in Power BI is a ready-to-use reporting solution that displays key certification metrics related to testing activities. It connects to an Excel data source and converts your certification information into interactive visuals. You see approval rates, test costs, satisfaction scores, rejection reasons, turnaround days, and performance by industry, test type, and lab name.
This dashboard supports manufacturing companies, R&D teams, quality departments, testing laboratories, and compliance managers. It helps everyone monitor the complete certification cycle from request to completion.
Because the dashboard runs in Power BI, you view all insights in real time and make decisions without delay.
Why Do Companies Need a Test Lab Certifications Dashboard?
Most organizations deal with hundreds of certifications every month. Manual tracking slows them down. Besides that, it creates several challenges:
-
Teams miss important trends.
-
Rejected tests don’t get proper root-cause analysis.
-
Test costs increase with no visibility.
-
Stakeholders don’t receive timely updates.
-
Satisfaction scores remain unclear.
-
Industries and clients don’t get consistent information.
A Test Lab Certifications Dashboard solves these issues because it presents all critical KPIs in one place. You can navigate through pages and explore every angle of your certification process.
How Does the Test Lab Certifications Dashboard Work?
The dashboard uses Excel as the backend data source. Power BI imports this data and creates visualizations. You get slicers on every page to filter the data by month, industry, test type, or lab name.
You can switch between five pages:
-
Overview
-
Industry Analysis
-
Test Type Analysis
-
Lab Name Analysis
-
Monthly Trends
Each page highlights a unique part of certification analytics. Let’s explore each one in detail.
Click to Purchases Test Lab Certifications Dashboard in Power BI
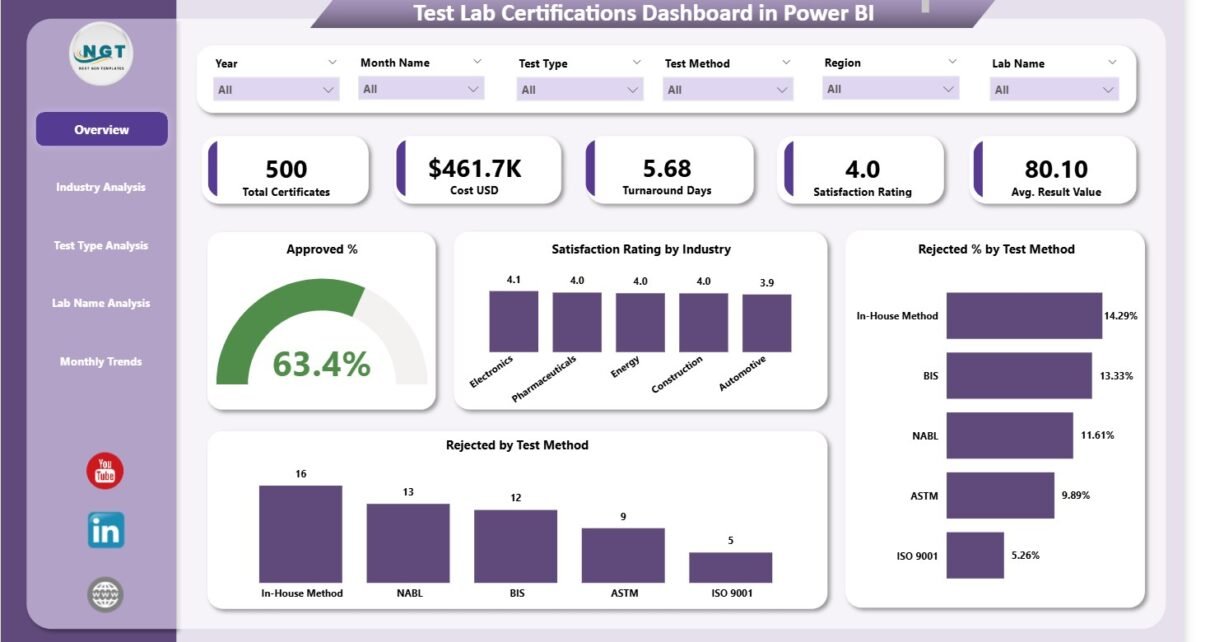
1. Overview Page
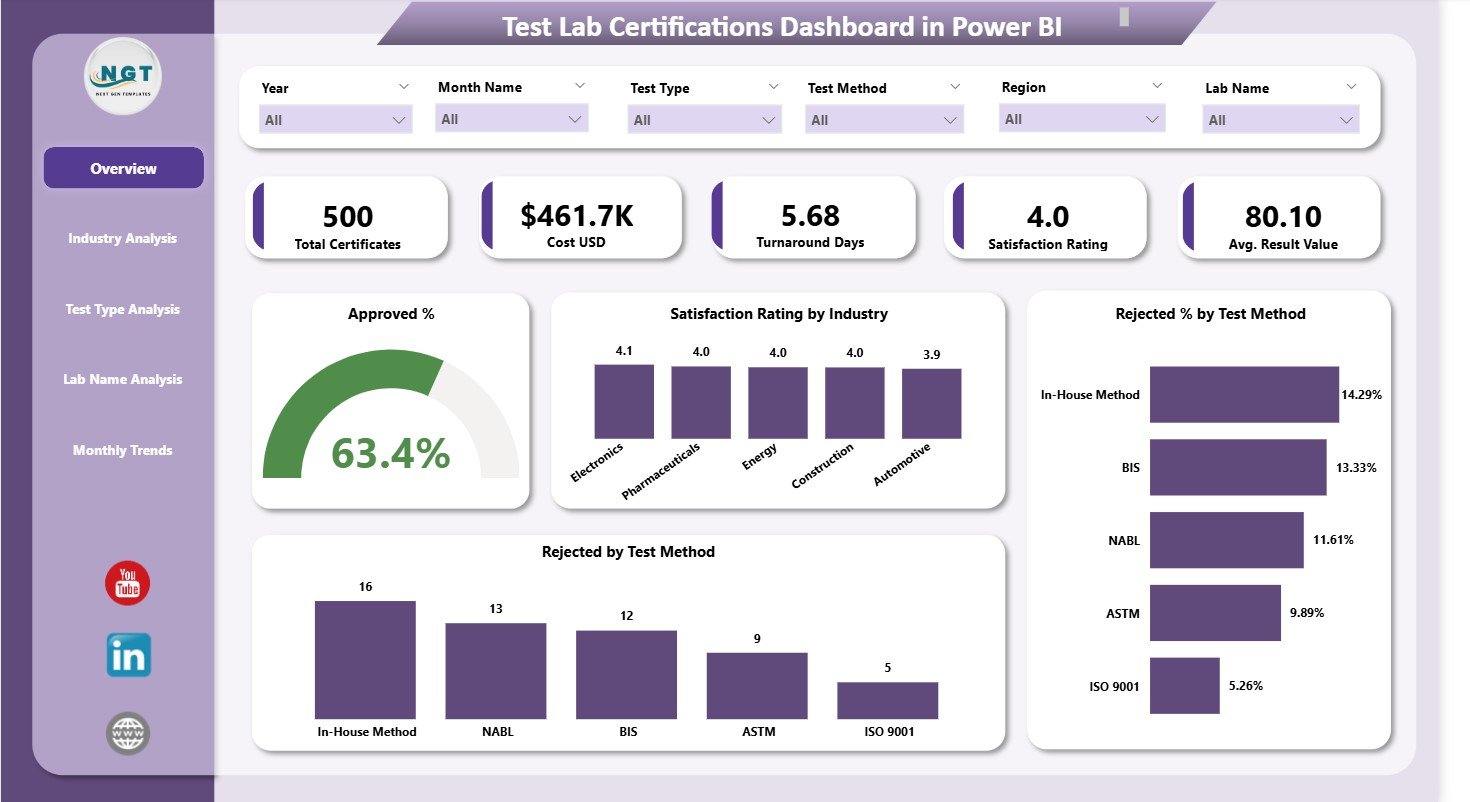
The Overview Page is the main page of the Test Lab Certifications Dashboard. It gives a high-level view of your entire certification process. You understand your test performance within seconds because the page brings all KPIs together.
Key Elements on the Overview Page
The page contains:
✔ Slicers
The slicers help you filter the data based on your selection. You can switch between months, industries, methods, labs, or test types. Because of this, you analyze data quickly.
✔ Six KPI Cards
The dashboard includes six cards that show your most important certification metrics, such as:
-
Total Certificates
-
Approved Certificates
-
Rejected Certificates
-
Approval Percentage
-
Satisfaction Rating
-
Average Turnaround Days
These cards help you monitor key performance indicators instantly.
✔ Four Insightful Charts
The Overview Page includes four powerful charts:
-
Approved % Chart – You see how many tests receive approval compared to total submissions.
-
Satisfaction Rating by Industry – You understand how clients feel across industries.
-
Rejected % by Test Method – You identify which test methods create the most rejections.
-
Rejected by Test Method – You view the rejection count for each method so you can take corrective action.
These charts help you understand your certification performance from a top-level perspective. You see patterns that often remain hidden in spreadsheets.
Click to Purchases Test Lab Certifications Dashboard in Power BI
2. Industry Analysis
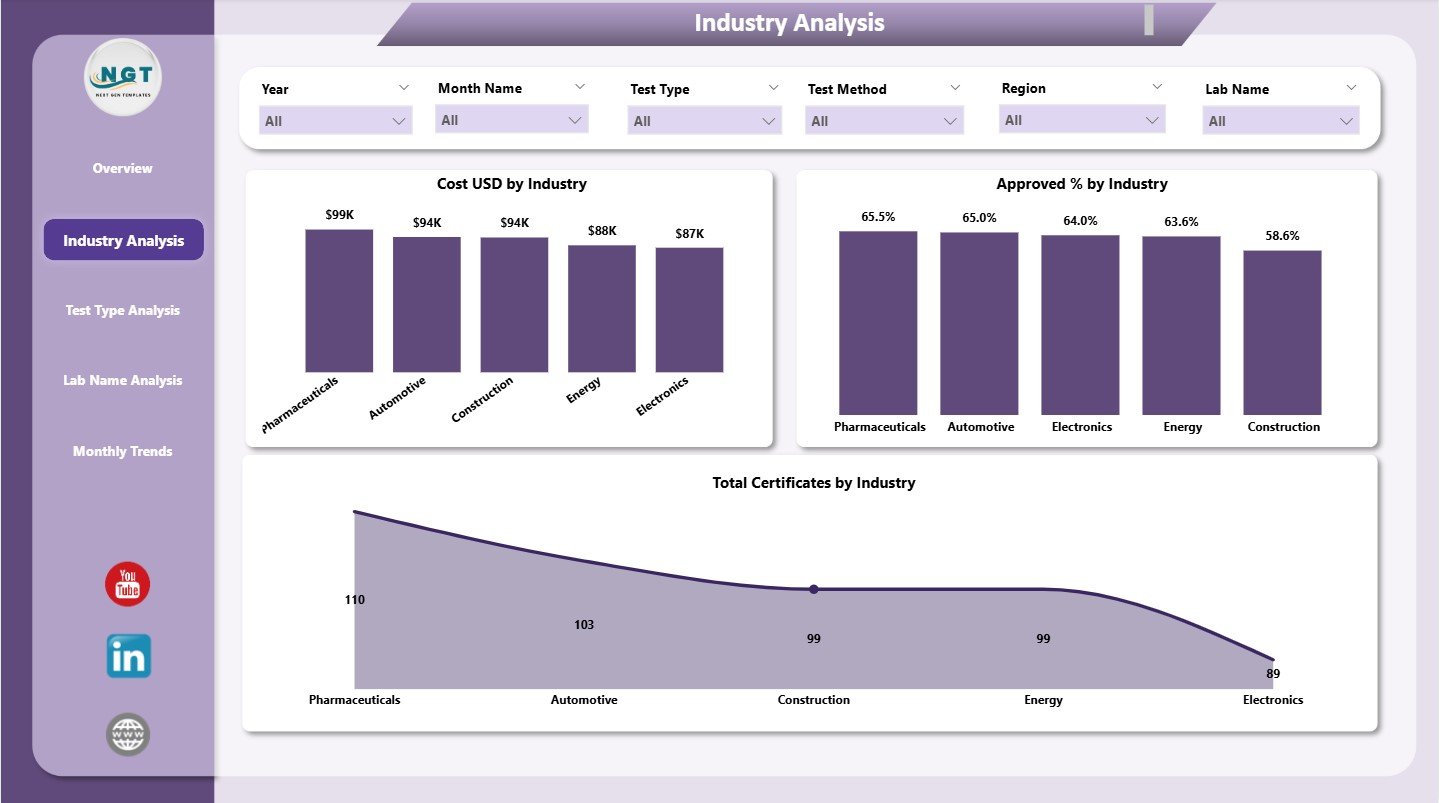
The Industry Analysis Page gives a detailed breakdown of certifications by industry. Teams who work in quality, customer service, or R&D use this page regularly because it reveals which industries drive test volume, cost, and satisfaction.
Key Features of the Industry Analysis Page
The page has slicers for easy filtering and presents three important charts:
✔ Cost (USD) by Industry
This chart displays total testing cost by industry. You see which industry spends more on certifications. You also identify which industry needs cost optimization.
✔ Approved % by Industry
This chart highlights the approval rate for each sector. For example, some industries may maintain high approval rates due to consistent quality, while others may show higher rejection rates.
✔ Total Certificates by Industry
This chart helps you monitor volume. You see which industry submits the most certifications and which one submits the least.
Because of these charts, your team understands the performance of every industry and adjusts strategies quickly.
3. Test Type Analysis
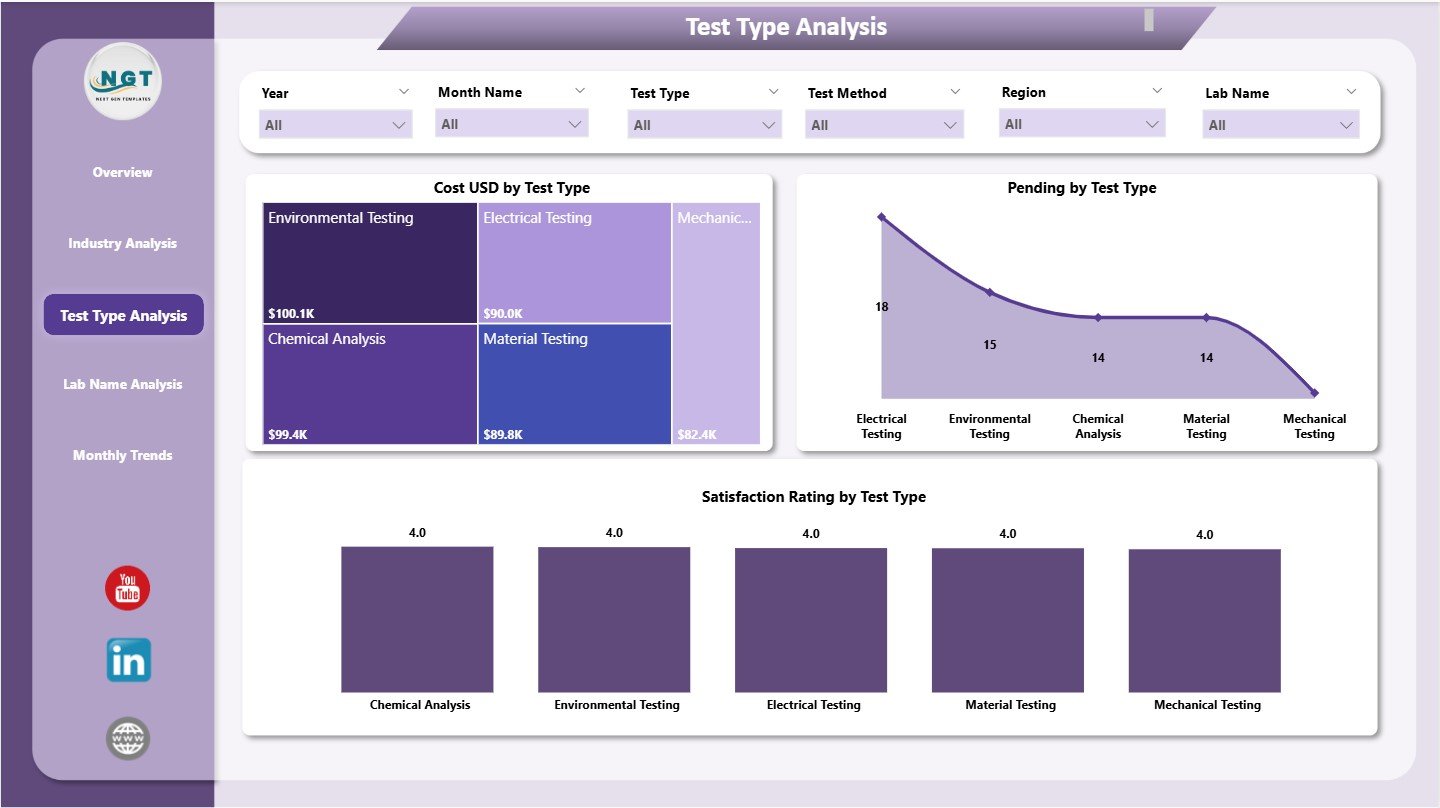
The Test Type Analysis Page shows how each test type performs. Every testing laboratory usually handles multiple types of tests. Some tests require more time. Others require advanced techniques. Some test types also generate more rejections.
This page gives complete transparency regarding these test types.
Key Charts on the Test Type Analysis Page
The page contains three charts:
✔ Cost (USD) by Test Type
This chart highlights which test types consume the highest cost. You can use this insight to revise pricing, improve efficiency, or optimize resource usage.
✔ Pending Certificates by Test Type
This chart shows the pending count for each test type. It helps teams understand bottlenecks. You also identify test types that take more time.
✔ Satisfaction Rating by Test Type
Different test types produce different levels of customer satisfaction. You see which test types deliver smooth service and which ones require improvement.
This page helps lab managers monitor every test type closely. It also supports decision-making because the page shows where more resources are needed.
Click to Purchases Test Lab Certifications Dashboard in Power BI
4. Lab Name Analysis
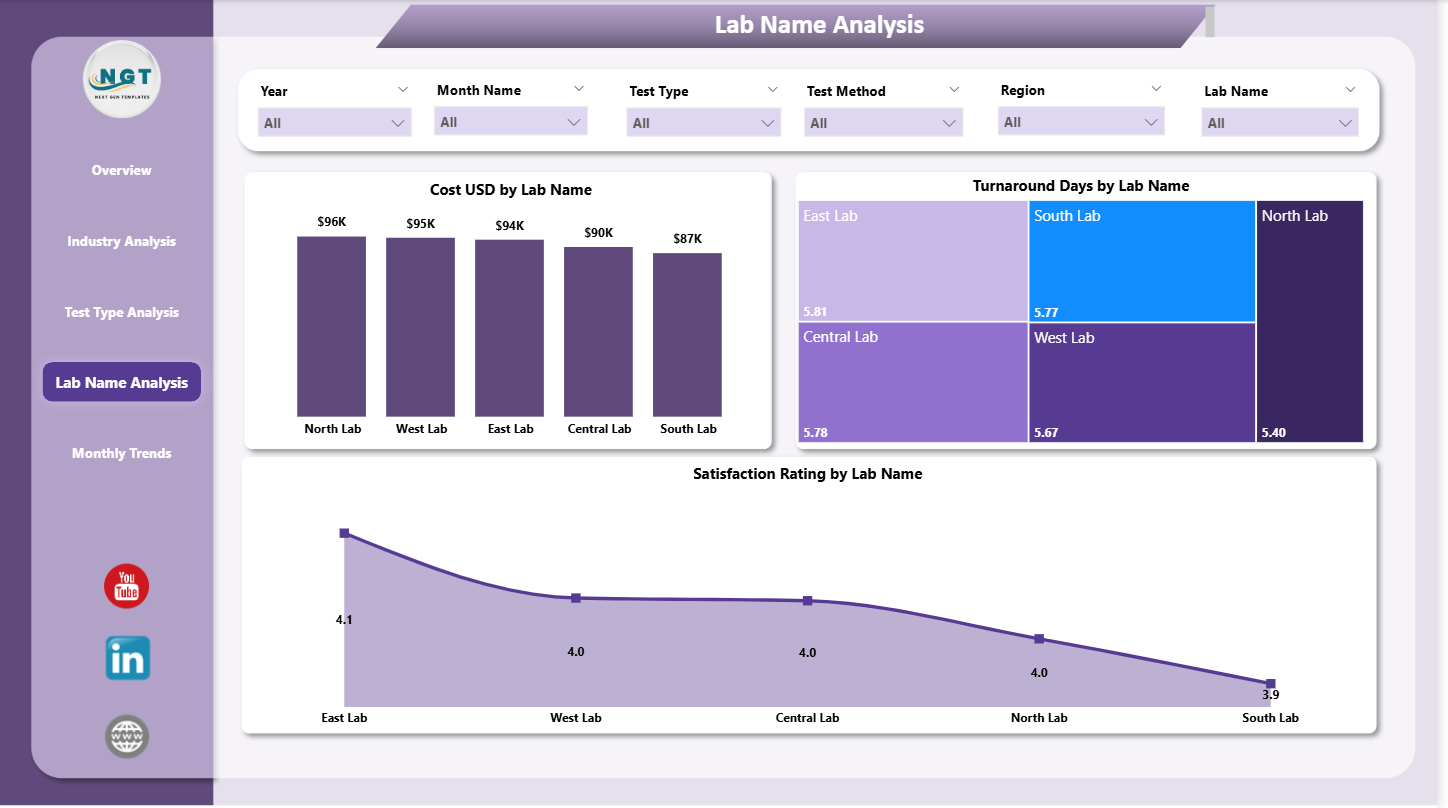
The Lab Name Analysis Page compares the performance across multiple labs. Organizations with multiple test facilities need clear visibility into each lab’s turnaround time, cost, and customer satisfaction.
Key Charts on Lab Name Analysis Page
The page includes:
✔ Cost (USD) by Lab Name
You see how much each lab spends on testing activities. You compare labs and identify the most cost-efficient ones.
✔ Turnaround Days by Lab Name
Turnaround time is one of the most important KPIs. This chart shows how many days each lab takes to complete tests. Because of this, you identify delays instantly.
✔ Satisfaction Rating by Lab Name
This chart shows how clients rate each lab. It helps you understand which labs maintain good relationships and which ones need improvement.
This page gives management a clear view of lab performance. You can introduce improvements, training, or resource adjustments based on these insights.
5. Monthly Trends
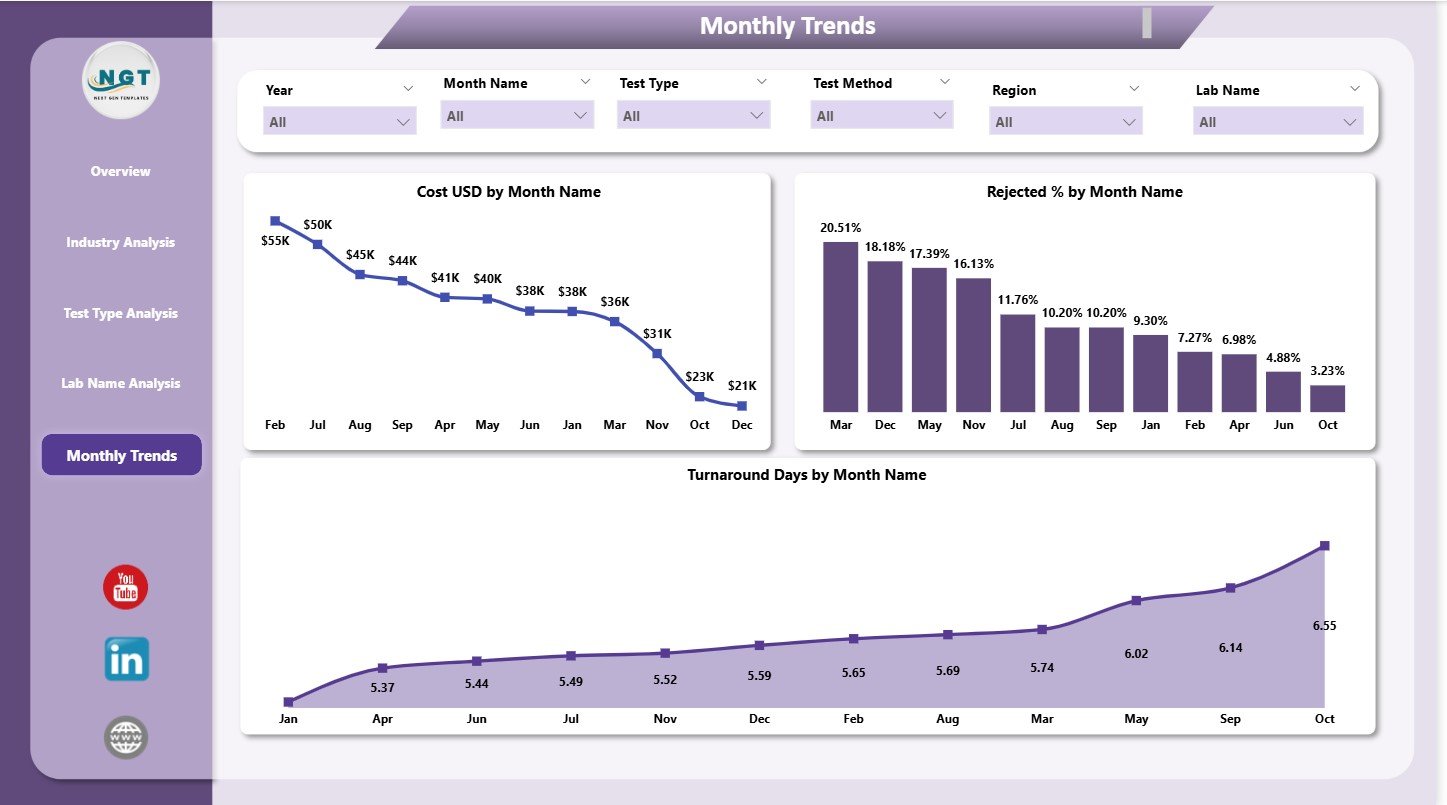
The Monthly Trends Page shows how your certification KPIs change month by month. You monitor cost, rejection rate, and turnaround days throughout the year.
Key Charts on the Monthly Trends Page
This page includes three powerful charts:
✔ Cost (USD) by Month
You understand the monthly spending pattern for test certifications. You detect peak months and slow months.
✔ Rejected % by Month
This chart highlights the rejection percentage every month. It helps you analyze quality trends. You also understand if rejections increase during specific periods.
✔ Turnaround Days by Month
This chart shows monthly turnaround time. You monitor improvements or delays.
Monthly trend analysis helps teams plan resources effectively. It also helps management take proactive steps before issues repeat.
Click to Purchases Test Lab Certifications Dashboard in Power BI
Advantages of a Test Lab Certifications Dashboard in Power BI
A well-designed certification dashboard offers several strong advantages. Because it brings data into one place, you track every part of the certification cycle with ease.
✔ 1. Better Decision-Making
The dashboard presents all KPIs in visual form. Leaders take quick decisions without reading long reports.
✔ 2. Complete Transparency
Teams see approval rates, rejection trends, and cost patterns clearly. Nothing remains hidden.
✔ 3. Improved Productivity
Employees spend less time searching for data. They focus more on solving problems and improving quality.
✔ 4. Strong Quality Monitoring
You quickly identify test methods, industries, or labs that show higher rejection rates. You act immediately.
✔ 5. Enhanced Customer Satisfaction
You track satisfaction ratings in real time. You take corrective actions faster.
✔ 6. Cost Optimization
You see cost by industry, lab name, test type, and month. You control expenses easily.
✔ 7. Streamlined Reporting
The dashboard replaces manual reporting. Teams share insights with one click.
✔ 8. Trend Identification
Monthly trend charts help you detect long-term patterns. You prepare strategies in advance.
Click to Purchases Test Lab Certifications Dashboard in Power BI
Best Practices for the Test Lab Certifications Dashboard in Power BI
You get maximum value from the dashboard when you follow these best practices.
✔ 1. Keep Your Data Clean
Maintain clean, structured data in the Excel file. Avoid blank rows, wrong formats, or inconsistent entries.
✔ 2. Refresh Data Regularly
Update your data on a fixed schedule so the dashboard always shows the latest performance.
✔ 3. Use Slicers Smartly
Use slicers to filter data and compare performance. Switch between industries, test types, and labs to explore insights deeply.
✔ 4. Check Rejection Patterns Frequently
Track rejection percentages often. You identify quality issues before they grow.
✔ 5. Monitor Turnaround Time
Focus on turnaround days so you maintain customer satisfaction.
✔ 6. Share the Dashboard with Teams
Share insights with quality teams, management, and labs so everyone stays informed.
✔ 7. Review Monthly Trends
Study monthly charts to prepare budgets, optimize manpower, and plan improvements.
✔ 8. Act on Satisfaction Ratings
Use feedback to improve service quality and communication.
Conclusion
The Test Lab Certifications Dashboard in Power BI helps organizations monitor certification performance easily. It brings approval rates, cost, satisfaction ratings, test types, industries, labs, and monthly trends into one place. Because of this, your team works faster and makes decisions confidently.
This dashboard supports operations, quality, customer service, and management teams. It ensures that every certification meets the expected standard. As a result, your organization improves efficiency and customer trust.
Frequently Asked Questions (FAQs)
1. What is the purpose of a Test Lab Certifications Dashboard in Power BI?
The dashboard helps teams monitor certification metrics such as approval rate, test cost, satisfaction score, turnaround days, and rejection trends.
2. Who can use this dashboard?
Quality teams, R&D departments, testing labs, manufacturing units, and compliance managers use this dashboard to track performance.
3. Does this dashboard work with Excel data?
Yes. The dashboard connects to an Excel file and updates automatically when you refresh the data.
4. Can I analyze performance by industry or test type?
Yes. The dashboard includes pages for Test Type Analysis and Industry Analysis.
5. Does the dashboard show rejection reasons?
Yes. You can track rejected percentages and rejection count by test method.
6. Can I customize this dashboard?
Yes. You can add new KPIs, charts, slicers, or pages based on your requirements.
7. How does the dashboard help in decision-making?
Visual insights help leaders understand patterns quickly and make fast and accurate decisions.
8. Can I track monthly performance trends?
Yes. The Monthly Trends page shows monthly costs, rejection percentage, and turnaround days.
Click to Purchases Test Lab Certifications Dashboard in Power BI
Visit our YouTube channel to learn step-by-step video tutorials