Animation and VFX studios work on fast-moving projects, tight timelines, complex revisions, and multiple creative departments. Because of this, managers need a clear view of project status, revenue, production cost, profit margin, software tool performance, and monthly trends. Many studios try to track everything manually, yet this leads to errors, delays, and confusion.
Therefore, an Animation & VFX Dashboard in Excel becomes an essential tool. It organizes data, highlights important KPIs, and helps creative teams make quick and confident decisions. This article explains everything you need to know about this dashboard, including its features, advantages, best practices, structure, and the most common questions users ask.
Click to Purchases Animation & VFX Dashboard in Excel
What Is an Animation & VFX Dashboard in Excel?
An Animation & VFX Dashboard in Excel is a user-friendly reporting system that tracks key performance indicators related to animation projects, VFX workflows, production cost, revisions, revenue, and profit margins. It converts raw project data into interactive visuals, easy-to-understand charts, and clean summaries.
You can monitor:
-
Revenue by client type
-
Profit margin by software tool
-
In-progress and on-hold project percentage
-
Production cost by department
-
Project revisions
-
Monthly revenue and margin trends
Since the dashboard runs inside Excel, you can update it easily without using any complex software. It works great for small studios, large production companies, freelancers, and agencies that want a fast and affordable way to manage performance.
Why Do Animation Studios Need an Excel Dashboard?
Animation and VFX teams handle multiple activities at the same time. They work on 3D assets, rigging, compositing, editing, effects, texturing, modeling, character animation, and more. Because these activities take time and effort, you need a structured way to track progress.
Additionally:
-
Clients expect quick project updates
-
Studios deal with multiple departments
-
Revisions increase workload
-
Budgets change based on tools and staff
-
Monthly revenue fluctuates
A dashboard helps you manage everything in one place. It reduces confusion, increases clarity, and supports better decision-making.
Key Features of the Animation & VFX Dashboard in Excel
This dashboard includes five analytical pages and two support sheets. Each page focuses on a specific part of the studio workflow. You can use slicers on every page to filter the data and review the insights in seconds.
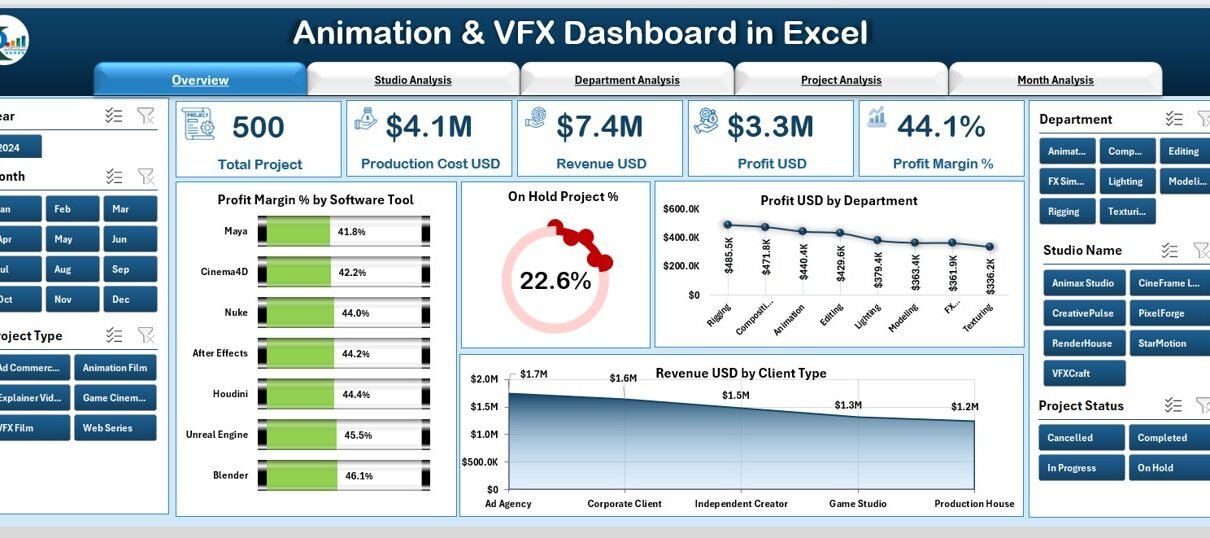
1. Overview Page – What Does It Show?
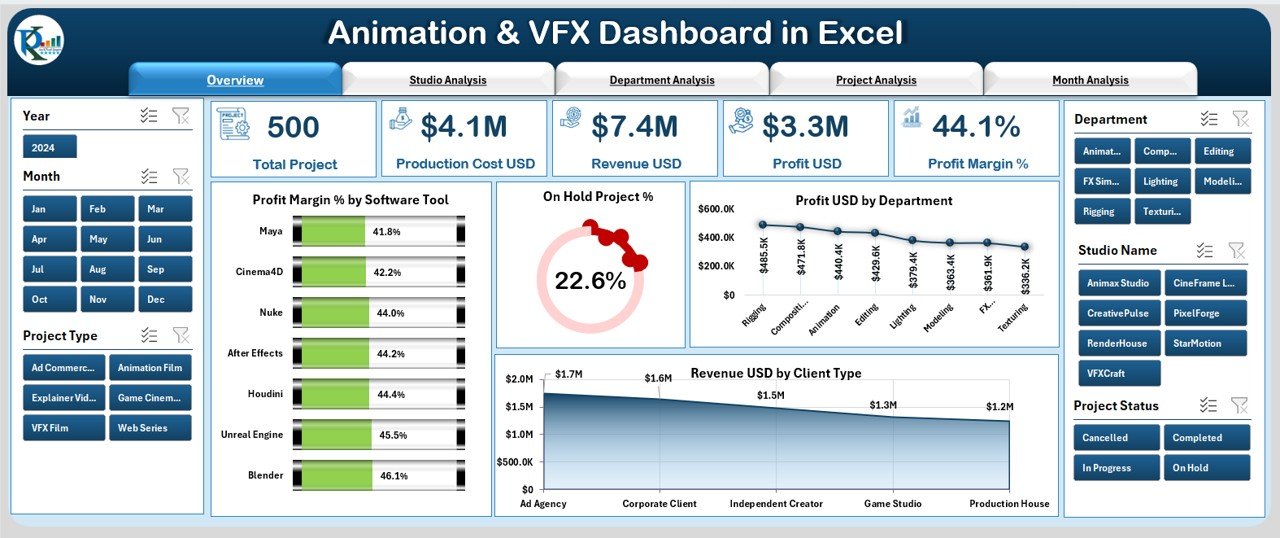
The Overview Page works as the main summary page of the dashboard. It gives you a quick snapshot of the entire studio’s performance.
⭐ Key Elements on the Overview Page
-
Page navigator on the left side
-
Slicer on the right side
-
5 summary cards
-
4 key performance charts
⭐ Charts Displayed
-
Profit Margin % by Software Tool
-
On Hold Project %
-
Profit (USD) by Department
-
Revenue (USD) by Client Type
This page helps you understand which software tool generates more profit, which client type provides more revenue, and how the departments perform overall.
2. Studio Analysis Page – What Insights Does It Provide?
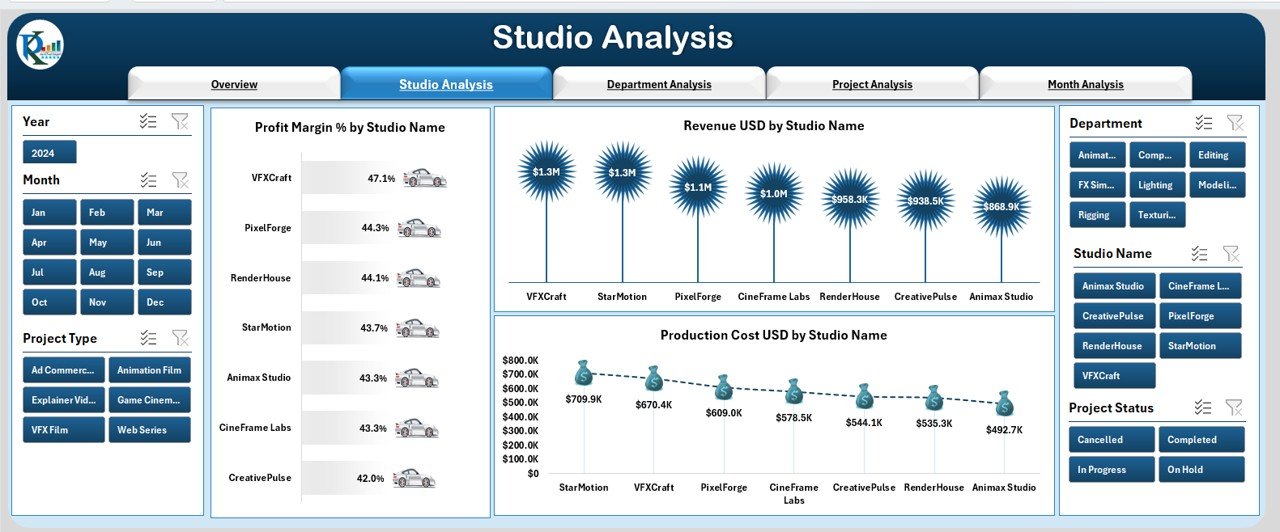
The Studio Analysis page helps you compare performance across different studios or branches. Many production houses run multiple studios or partner with external studios. Because of this, comparing numbers becomes important.
⭐ Charts Displayed
-
Profit Margin % by Studio Name
-
Revenue (USD) by Studio Name
-
Production Cost (USD) by Studio Name
This page shows which studio performs better, where the production cost stays high, and which branch generates the most revenue.
3. Department Analysis Page – How Does It Help Teams?
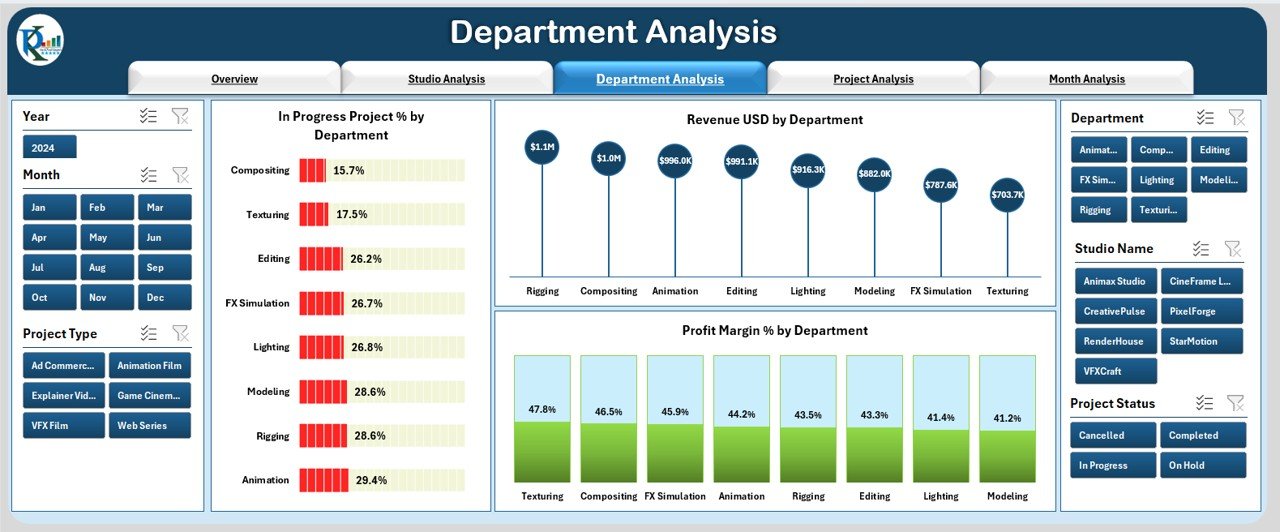
Animation and VFX work depends on multiple departments such as Modeling, Rigging, Animation, Lighting, Compositing, and Editing. Each department affects the timeline and the budget. So you must monitor departmental performance.
⭐ Charts Displayed
-
In-Progress Project % by Department
-
Revenue (USD) by Department
-
Profit Margin % by Department
With this page, you can identify high-performing departments and those that need improvement.
4. Project Analysis Page – What Project Trends Does It Show?

This page helps you understand the health of all projects in the studio. Since project timelines and revisions affect profit, this page becomes extremely valuable.
Click to Purchases Animation & VFX Dashboard in Excel
⭐ Charts Displayed
-
Profit Margin % by Project Status
-
Revision Count by Project Status
-
Production Cost (USD) by Project Status
You can easily track how revisions increase the project cost, which project status delivers better margins, and where delays occur.
5. Month Analysis Page – Why Is Monthly Tracking Important?
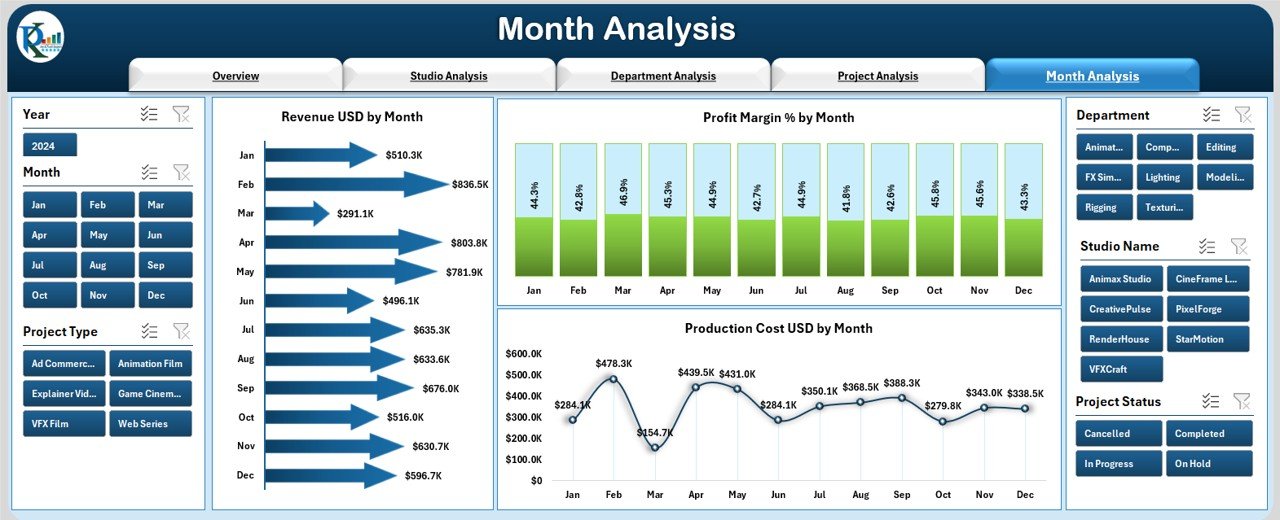
Studios experience monthly ups and downs. Some months bring more projects, while others focus on production work. Understanding monthly patterns helps you plan resources better.
⭐ Charts Displayed
-
Revenue (USD) by Month
-
Project Margin % by Month
-
Production Cost (USD) by Month
This page gives you clarity about seasonal trends and helps you create better revenue forecasts.
Support Sheets Included in the Dashboard
⭐ Support Sheet
This sheet stores master-level data such as:
-
Department names
-
Software tools
-
Project statuses
-
Client types
-
Studio names
These values help slicers and charts work smoothly.
⭐ Data Sheet
The core data of the dashboard lives here. You update this sheet, and the entire dashboard updates automatically.
Advantages of Animation & VFX Dashboard in Excel
Animation and VFX studios enjoy many benefits when they use this dashboard. Here are the top advantages:
⭐ 1. Better Visibility of Project Performance
The dashboard provides real-time clarity on project timelines, revision count, revenue, and cost.
⭐ 2. Improved Decision-Making
Since you can compare departments, months, and studios, your decisions become stronger and faster.
⭐ 3. Simple and Easy to Use
You do not need any complex software or advanced skills. Excel makes everything simple.
⭐ 4. Saves Time and Effort
You save hours because the dashboard automatically updates once you paste the data.
⭐ 5. Highlights Revenue and Profit Trends
You can track which clients bring more revenue and which months perform better.
⭐ 6. Enhances Team Efficiency
Teams work better when they know how the studio performs.
⭐ 7. Helps in Budget Planning
You can view production costs and profit margins easily, which helps in budget planning.
Best Practices for Using the Animation & VFX Dashboard in Excel
Follow these best practices to get the most value from your dashboard:
⭐ 1. Update the Data Sheet Regularly
The fresher the data, the more accurate your insights.
⭐ 2. Maintain Standard Naming Conventions
Use consistent names for clients, studios, tools, and departments.
⭐ 3. Review Monthly Trends
Monthly analysis helps you plan staffing, budget, and workload.
⭐ 4. Track Revision Count
Revisions impact cost. Monitor trends to reduce unnecessary revision cycles.
⭐ 5. Use Slicers to Compare Different Categories
Slicers help you compare departments, studios, and months effectively.
⭐ 6. Analyze Profit Margin Frequently
Profit margin tells you if a project remains healthy or requires attention.
⭐ 7. Share the Dashboard with Your Team
When everyone understands the insights, the entire workflow improves.
Click to Purchases Animation & VFX Dashboard in Excel
Conclusion
An Animation & VFX Dashboard in Excel gives studios a powerful tool to monitor performance, reduce production cost, improve project timelines, and increase profitability. It turns complex data into simple charts and cards, making analysis easy for managers, artists, and stakeholders.
Because the dashboard uses Excel, you can update it quickly, customize it easily, and understand the results without needing any technical skills. Whether you manage a small studio or a large production house, this dashboard helps you track every important KPI and make smart business decisions.
Frequently Asked Questions (FAQs)
1. What is an Animation & VFX Dashboard in Excel?
It is a reporting tool that tracks key performance indicators such as revenue, profit margin, revision count, and project status using interactive Excel charts.
2. Who can use this dashboard?
Animation studios, VFX teams, production houses, freelancers, and creative agencies can use it.
3. Do I need advanced Excel skills?
No. You only update the data sheet and the dashboard updates automatically.
4. Can I customize the dashboard?
Yes, you can add new KPIs, charts, colors, and branding based on your needs.
5. How often should I update the data?
Update it weekly or monthly for accurate and real-time insights.
6. Does it track project revisions?
Yes, the Project Analysis page shows revision count by project status.
7. Can I compare departments or studios?
Yes, the dashboard provides filters and charts to compare performance across multiple categories.
Visit our YouTube channel to learn step-by-step video tutorials