Accounting firms deal with large volumes of data every single day. They track financial performance, monitor client satisfaction, measure billing efficiency, and evaluate profitability across regions, services, clients, and lead sources. Because the accounting industry runs on numbers, firms need quick insights and clear visuals to make faster decisions. This is why an Accounting Firms Dashboard in Power BI becomes a game-changer.
Power BI gives accountants a modern and interactive way to visualize data. It helps teams understand trends, save time, and improve client service. In this detailed article, you will explore everything about this dashboard. You will see how each page works, why it matters, and how to use it effectively in your day-to-day operations.
Let’s begin the journey toward smarter, faster, and more organized accounting analytics.
Click to Purchases Accounting Firms Dashboard in Power BI
What Is an Accounting Firms Dashboard in Power BI?
An Accounting Firms Dashboard in Power BI is a powerful visual tool that converts raw financial and operational data into meaningful insights. It organizes reports into interactive pages, allowing users to explore trends, compare performance, and make informed decisions.
You can monitor:
-
Profit margins
-
Revenue and expenses
-
Billing hours
-
Client satisfaction
-
Lead source performance
-
Service type efficiency
-
Monthly trends
Because Power BI offers slicers, filters, and cross-highlighting, it becomes easy to drill down into data. As a result, accounting leaders, auditors, and financial analysts gain instant clarity without the need to create manual reports.
Why Do Accounting Firms Need a Power BI Dashboard?
Accounting firms manage complex and sensitive data. They deal with multiple clients, deliver various services, and handle large teams. Because of this, leaders need dashboards that provide instant financial visibility. Power BI helps firms track KPIs, identify risks, and uncover opportunities much faster than traditional Excel reports.
You can:
-
Replace manual reporting
-
Automate insights
-
Understand financial trends
-
Improve decision-making
-
Deliver better results to clients
-
Monitor team performance
-
Reduce errors and delays
The dashboard not only saves time but also improves accuracy. This makes it a valuable tool for both large and small accounting firms.
What Are the Key Pages of the Accounting Firms Dashboard in Power BI?
This dashboard contains five powerful pages. Each page focuses on a specific area of accounting performance. This structure helps users evaluate KPIs from different dimensions and improve decision-making.
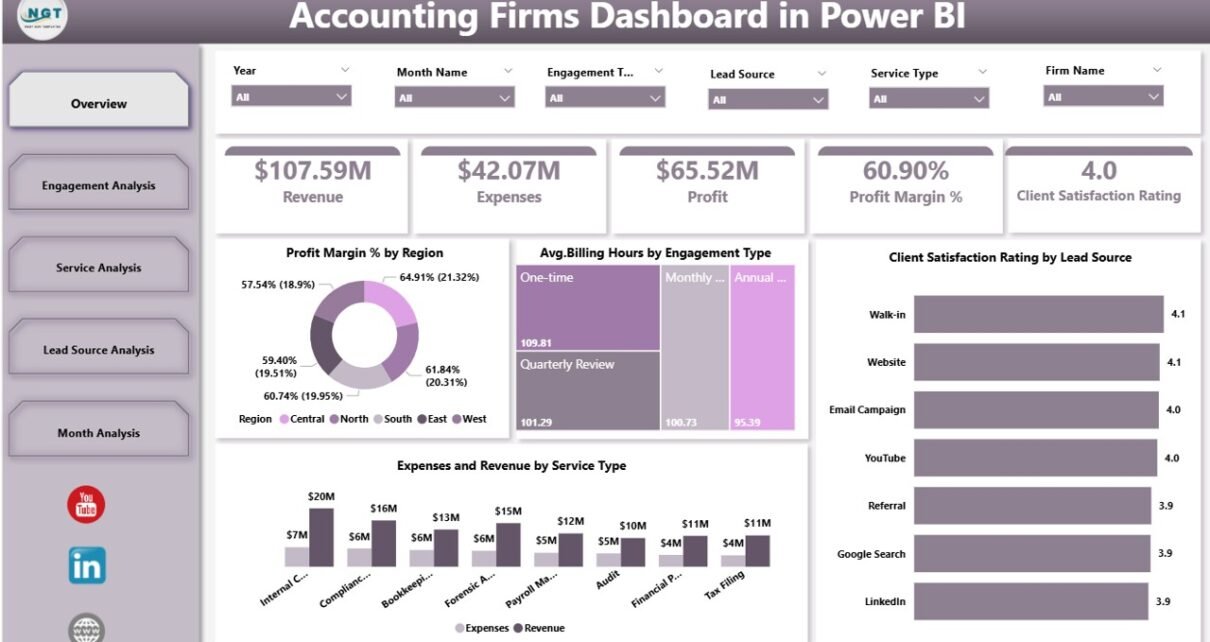
1. Overview Page: What Insights Does It Provide?
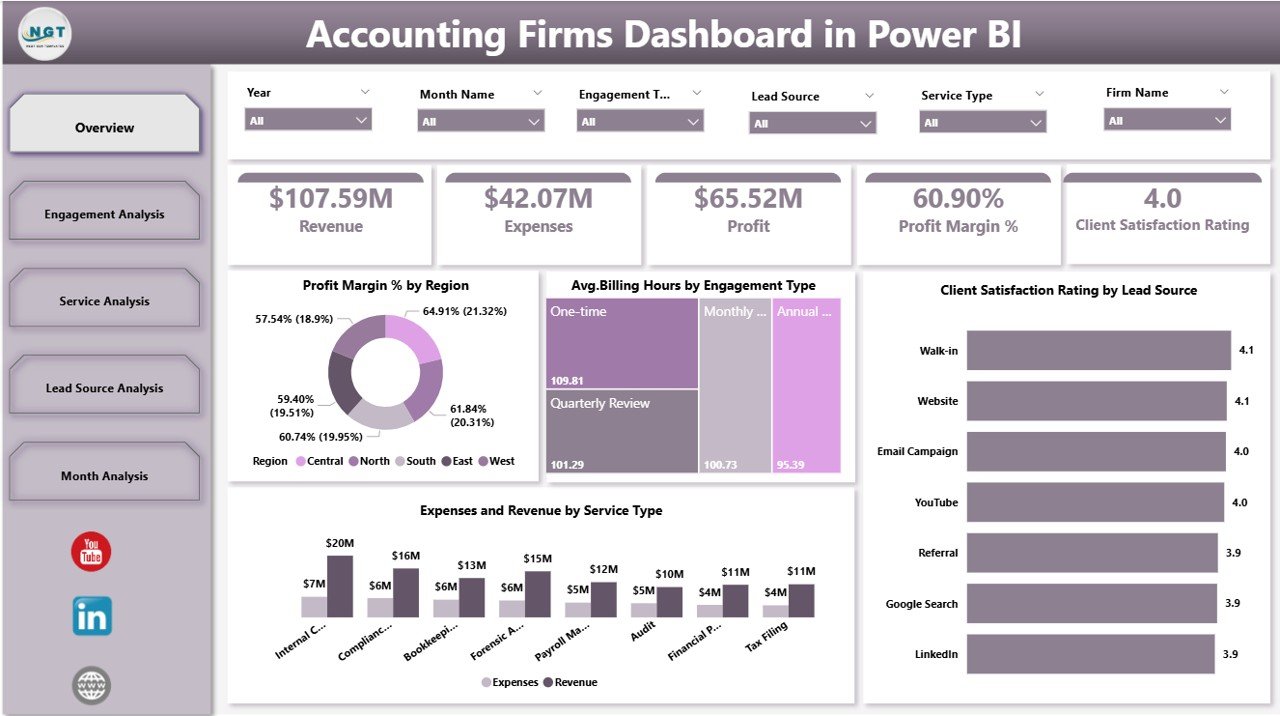
The Overview Page is the starting point of the dashboard. It gives a complete snapshot of accounting performance. You can use slicers to filter data by region, time period, service type, or engagement type. Because this page acts as a summary, it helps leaders quickly understand the firm’s health.
Key Components on the Overview Page
✔ Four Performance Cards
These cards show the most important KPIs at a glance. They include metrics such as:
-
Total revenue
-
Total expenses
-
Profit margin %
-
Client satisfaction score
-
Total billing hours
You can modify these metrics based on firm requirements.
✔ Profit Margin % by Region
This chart helps you identify profitable and low-performing regions. You can compare profit margins across different areas to understand growth opportunities.
✔ Avg. Billing Hours by Engagement Type
This chart shows how many hours teams spend on each engagement. It helps you understand workload distribution and productivity levels.
✔ Client Satisfaction Rating by Lead Source
This helps you see which lead sources deliver high-quality and satisfied clients.
✔ Expenses and Revenue by Service Type
This chart enables you to compare expenses and revenue for each service. You can identify profitable services and optimize low-performing ones.
Because the overview page pulls information from all sections, it becomes the most critical dashboard page for decision-makers.
2. Engagement Analysis Page: How Does It Improve Decision-Making?
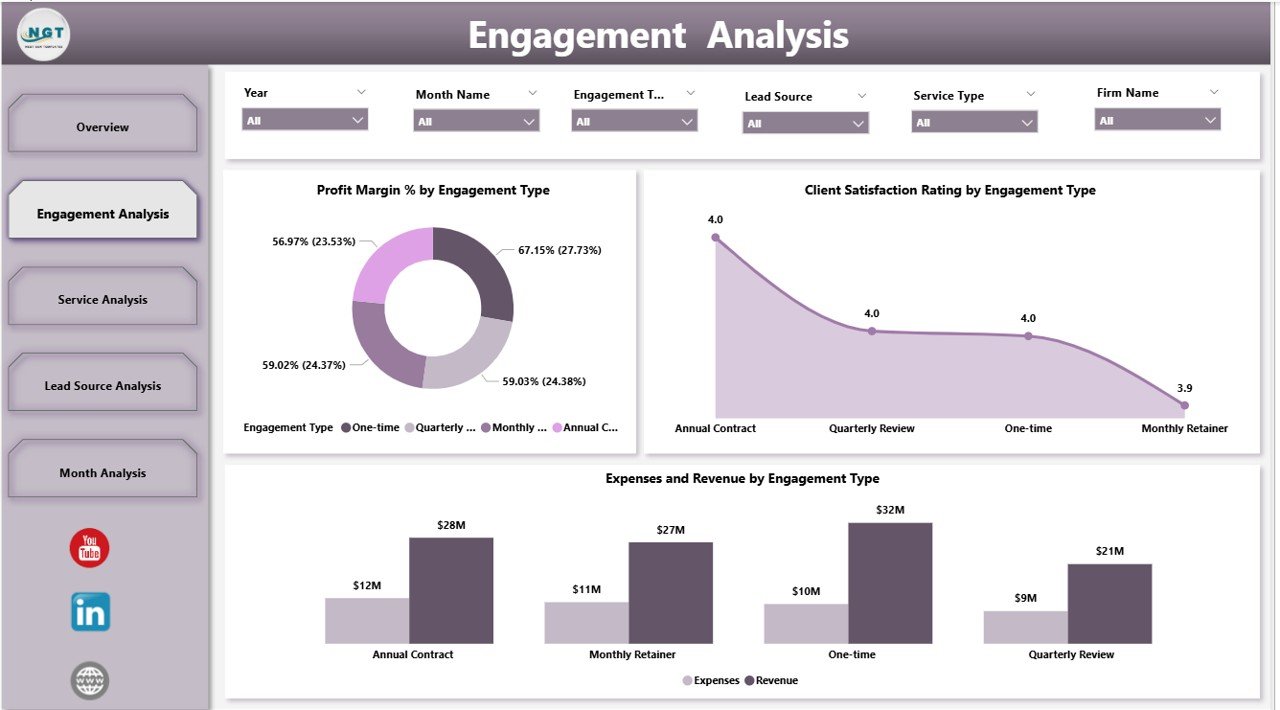
The Engagement Analysis page focuses on performance across engagement types such as audits, tax advisory, consulting, payroll, bookkeeping, or financial analysis. Because every engagement type has different requirements and profitability levels, firms need to evaluate them separately.
Click to Purchases Accounting Firms Dashboard in Power BI
Key Insights on the Engagement Analysis Page
✔ Profit Margin % by Engagement Type
This chart helps you understand which engagement types bring higher profit. You can analyze:
-
High-value engagements
-
Low-profit engagements
-
Loss-making engagements
This insight helps firms set better pricing strategies.
✔ Client Satisfaction Rating by Engagement Type
This shows how clients feel about each engagement type. Accounting firms can use this data to improve service quality and employee performance.
✔ Expenses and Revenue by Engagement Type
This comparison helps you calculate profit, margin, and efficiency for each engagement. You can adjust cost structures and improve resource allocation.
Because this page contains targeted analysis, it becomes essential for firms offering a wide range of services.
3. Service Analysis Page: What Can Firms Learn from It?
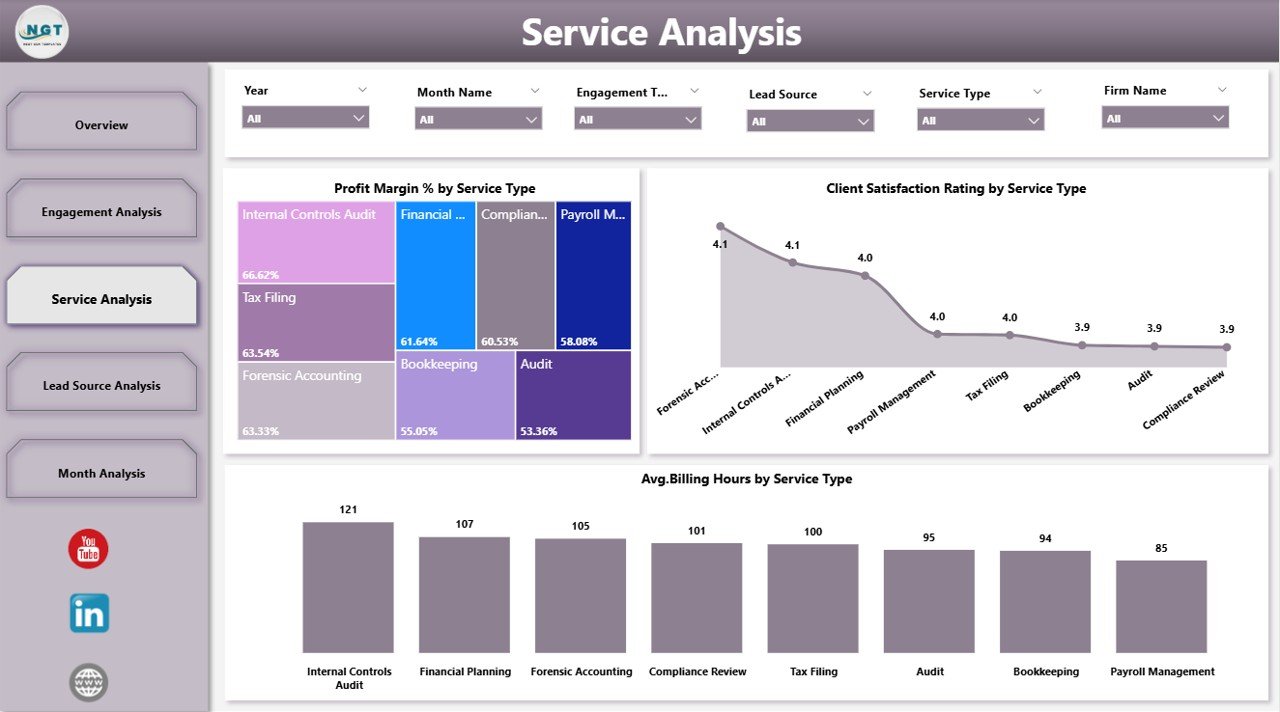
The Service Analysis page gives users deep visibility into performance across all service types. Accounting firms often offer multiple services, and each service contributes differently to revenue and profitability.
Key Reports on the Service Analysis Page
✔ Profit Margin % by Service Type
You can compare performance across:
-
Audits
-
Bookkeeping
-
Tax filing
-
Payroll
-
Consulting
-
Financial analysis
This chart helps leaders identify their strongest services.
✔ Client Satisfaction Rating by Service Type
This shows how satisfied clients feel about each service. Firms can explore service quality improvement areas and refine processes.
✔ Avg. Billing Hours by Service Type
This highlights the time spent on each service. It helps firms:
-
Manage workloads
-
Improve billing efficiency
-
Allocate resources smartly
This page becomes helpful for operational planning and team management.
4. Lead Source Analysis Page: Why Is Lead Source Important?
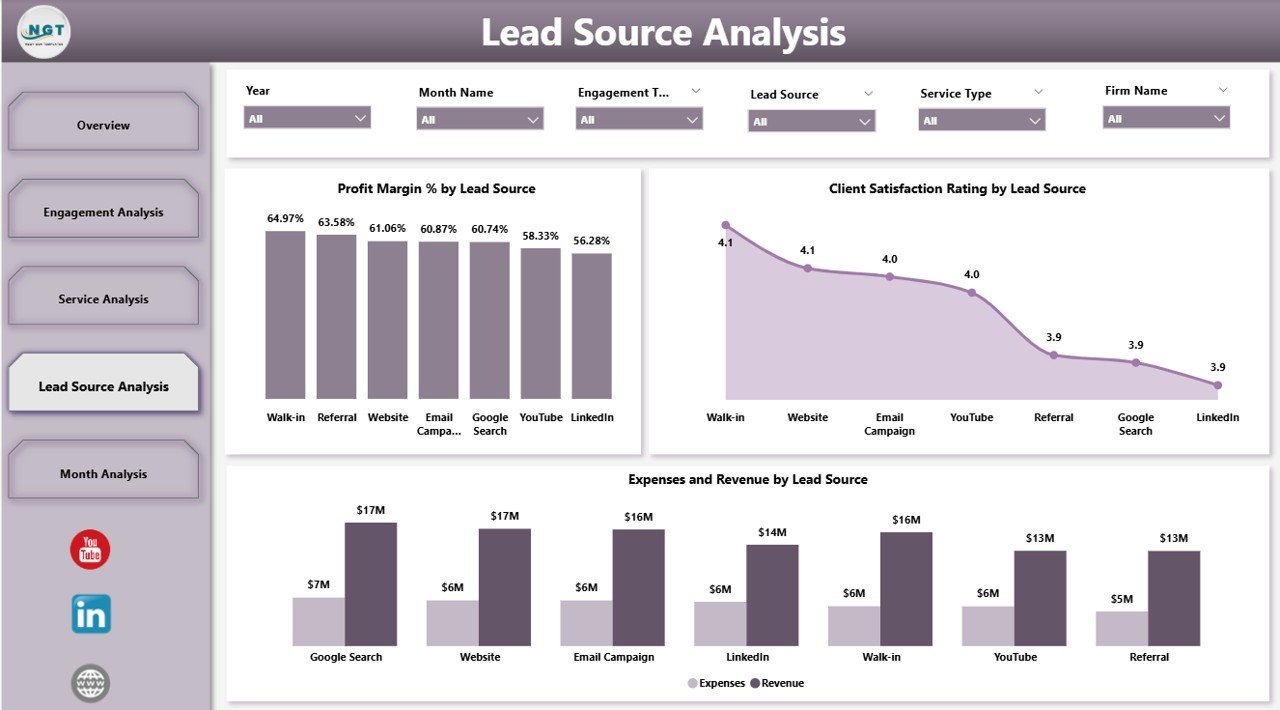
The Lead Source Analysis page focuses on understanding how clients reach your accounting firm. Because every lead source has different conversion rates, cost levels, and quality, this page helps you understand where your best clients come from.
Main Charts on the Lead Source Analysis Page
✔ Profit Margin % by Lead Source
Some lead sources bring high-value clients, while others deliver low-profit engagements. This chart helps you identify the right marketing channels.
✔ Client Satisfaction Rating by Lead Source
You can check how satisfied clients from each source feel. This insight helps you understand which channels deliver loyal and long-term clients.
✔ Expenses and Revenue by Lead Source
This shows the financial impact of each source. Firms can optimize marketing budgets and improve ROI.
Because lead source quality impacts long-term profits, this page becomes important for both marketing and financial planning.
5. Monthly Trends Page: How Do Monthly Trends Help Firms?
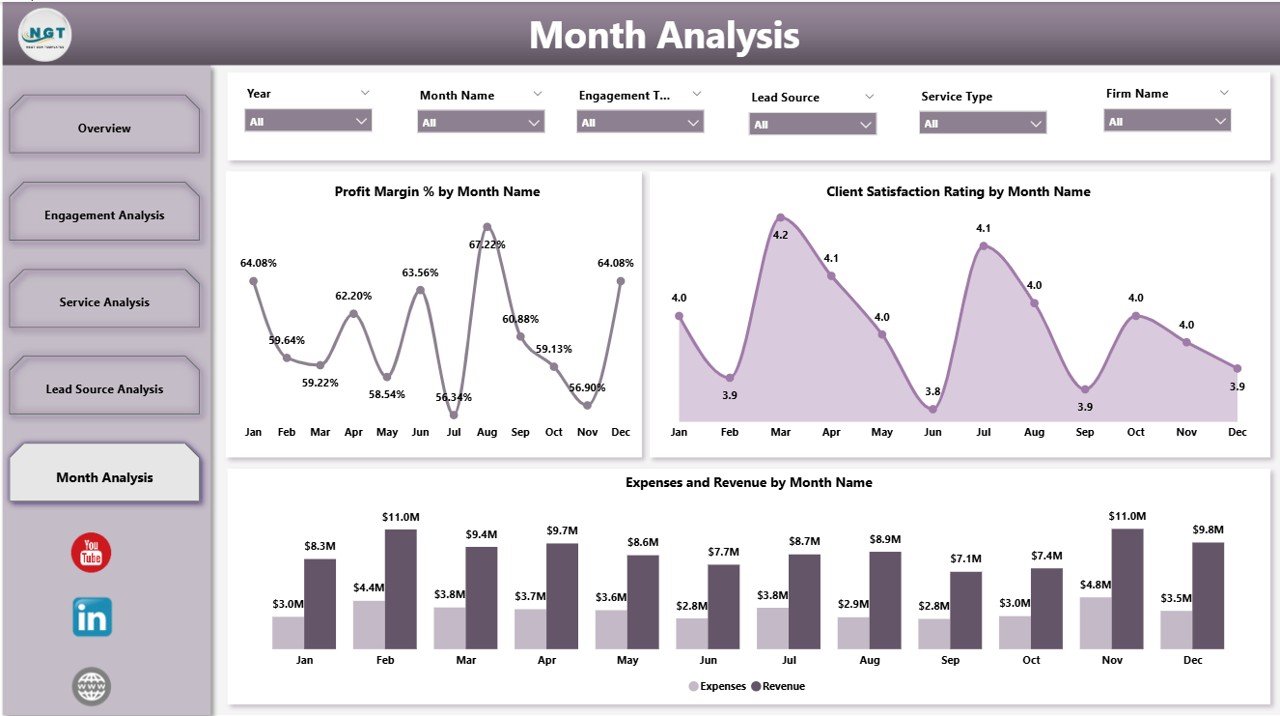
The Monthly Trends page is the final and one of the most important pages of the dashboard. It shows performance month by month. Because financial activities change throughout the year, monthly data helps firms identify patterns and make timely decisions.
Charts on the Monthly Trends Page
Click to Purchases Accounting Firms Dashboard in Power BI
✔ Profit Margin % by Month
This helps users track profitability throughout the year. You can identify:
-
Growth months
-
Low-performance months
-
Seasonal impact
-
Revenue drop patterns
✔ Client Satisfaction Rating by Month
This shows how client satisfaction changes over time. Firms can detect service issues before they grow.
✔ Expenses and Revenue by Month
This chart helps you compare expenses and revenue monthly. You can maintain financial stability by tracking trends.
The Monthly Trends page helps firms create forecasts and plan budgets more effectively.
Advantages of Using an Accounting Firms Dashboard in Power BI
Using a Power BI dashboard gives accounting firms several advantages. Below are the key benefits:
1. Faster Decision-Making
Because the dashboard shows real-time insights, leaders make quicker and better decisions.
2. Improved Accuracy
Power BI reduces manual work and minimizes errors. Data updates automatically.
3. Better Resource Allocation
With insights on billing hours, expenses, and profitability, firms allocate teams more efficiently.
4. Enhanced Client Satisfaction
You can track satisfaction levels and improve services based on feedback.
5. Transparent Financial Monitoring
Charts clearly show revenue, expenses, and profit margins.
6. Operational Efficiency
Teams work smarter because they get all insights in one place.
7. Customizable and Scalable
Firms can add new KPIs, charts, and pages anytime.
Best Practices for Using the Accounting Firms Dashboard in Power BI
To get maximum value from the dashboard, follow these best practices:
1. Keep Data Clean and Updated
Always maintain correct and complete data. This ensures accurate insights.
2. Define Clear KPIs
Use KPIs that match your business goals. Avoid too many KPIs on a single page.
3. Use Consistent Color Coding
Use the same colors for revenue, expenses, profit, and satisfaction across all pages.
4. Train Your Team
Ensure all team members understand how to use filters, slicers, and visuals.
5. Refresh Data Regularly
Set automated refresh schedules for real-time reporting.
6. Use Drill-Through Features
Allow users to click visuals and explore deeper insights.
7. Review Monthly Trends
Use the monthly trends page to improve budgeting and forecasting.
Conclusion
An Accounting Firms Dashboard in Power BI gives firms a modern way to track financial and operational performance. It helps accountants visualize important KPIs, evaluate profitability, improve client satisfaction, and manage workloads more effectively. Because the dashboard contains multiple pages for overview, engagements, services, lead sources, and trends, it provides 360-degree insights. When used correctly, this dashboard improves decision-making and supports smarter growth for any accounting firm.
Frequently Asked Questions (FAQs)
1. What is an Accounting Firms Dashboard in Power BI?
It is a visual reporting tool that helps accounting firms track key financial and operational metrics in one place.
2. Why should accounting firms use Power BI dashboards?
They help firms make faster decisions, reduce manual reporting, improve accuracy, and increase productivity.
3. Can I customize this dashboard based on my KPIs?
Yes. You can add new KPIs, visuals, pages, and calculations anytime.
4. Does Power BI help improve client satisfaction?
Yes. Because the dashboard tracks ratings and service quality, firms can fix issues before they affect clients.
5. Is this dashboard suitable for small accounting firms?
Yes. Both small and large firms can use this dashboard to improve financial clarity.
6. How often should I refresh the data?
Daily or weekly refresh works best, depending on your reporting needs.
Visit our YouTube channel to learn step-by-step video tutorials