Oncology centers deal with complex cases every day. Doctors, nurses, and administrative teams work together to manage treatments, patient flow, diagnostics, research, and long-term outcomes. Because oncology services depend on accuracy and real-time insights, teams need a simple way to track every important metric. Therefore, an Oncology Services KPI Dashboard in Excel becomes one of the most useful tools for cancer care units.
In this detailed guide, you will learn everything about this dashboard, including its purpose, structure, benefits, features, best practices, and real-world usage. You will also discover how Excel helps you monitor performance without worrying about complicated software. So let us explore how this dashboard transforms oncology reporting.
What Is an Oncology Services KPI Dashboard in Excel?
An Oncology Services KPI Dashboard in Excel is a ready-to-use reporting tool that displays all critical oncology performance indicators in one place. You can monitor patient care metrics, diagnostic turnaround times, treatment efficiency, chemotherapy cycles, radiation sessions, bed occupancy, staffing workload, and many other KPIs.
The dashboard connects with simple data sheets. You enter your Monthly (MTD), Year-to-Date (YTD), Target, and Previous Year numbers, and Excel updates everything automatically. Because hospitals need consistency and quick insights, this dashboard avoids complexity and offers a clean, interactive layout.
You can use it for:
-
Cancer hospitals
-
Oncology departments in general hospitals
-
Specialty clinics
-
Radiation therapy centers
-
Chemotherapy units
-
Daycare cancer treatment centers
Since Excel offers flexibility, teams can update the dashboard daily, weekly, or monthly without advanced tech skills.
Why Do Oncology Services Need a KPI Dashboard?
Oncology care includes multiple processes. Doctors run tests, prepare treatment plans, manage patient flow, and ensure safety. Even small delays can affect patient outcomes. Because of this, hospital administrators and oncologists need a clear view of what is happening every day.
An Excel-based KPI dashboard solves this problem because it:
-
Brings all KPIs into a single view
-
Tracks real-time progress
-
Shows gaps between actual and target
-
Highlights improvements and risks
-
Helps teams take faster decisions
This dashboard also supports compliance, audit readiness, and strategic planning.
Key Features of the Oncology Services KPI Dashboard in Excel
Your ready-to-use Oncology Services KPI Dashboard includes 7 major worksheets, each designed to simplify monitoring and decision-making. Below is a detailed explanation of every sheet.
1. Home Sheet – Index and Navigation
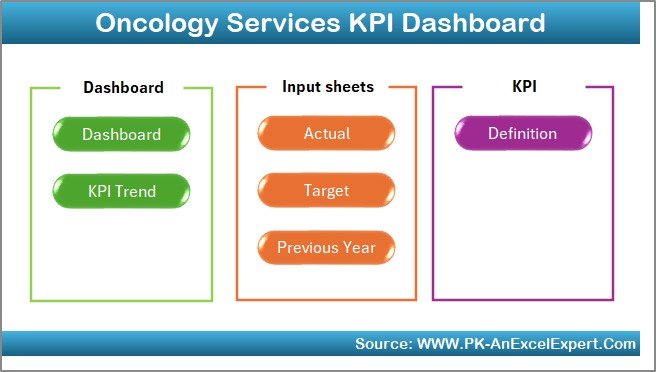
The Home sheet works as an index page. Because oncology teams need quick access, this sheet includes 6 smart navigation buttons. You can jump to the Dashboard, Trends, Actual Input, Targets, Previous Year, and KPI Definition sheets without scrolling.
This design keeps reporting simple, especially for doctors and operations teams who do not have time to search for sheets.
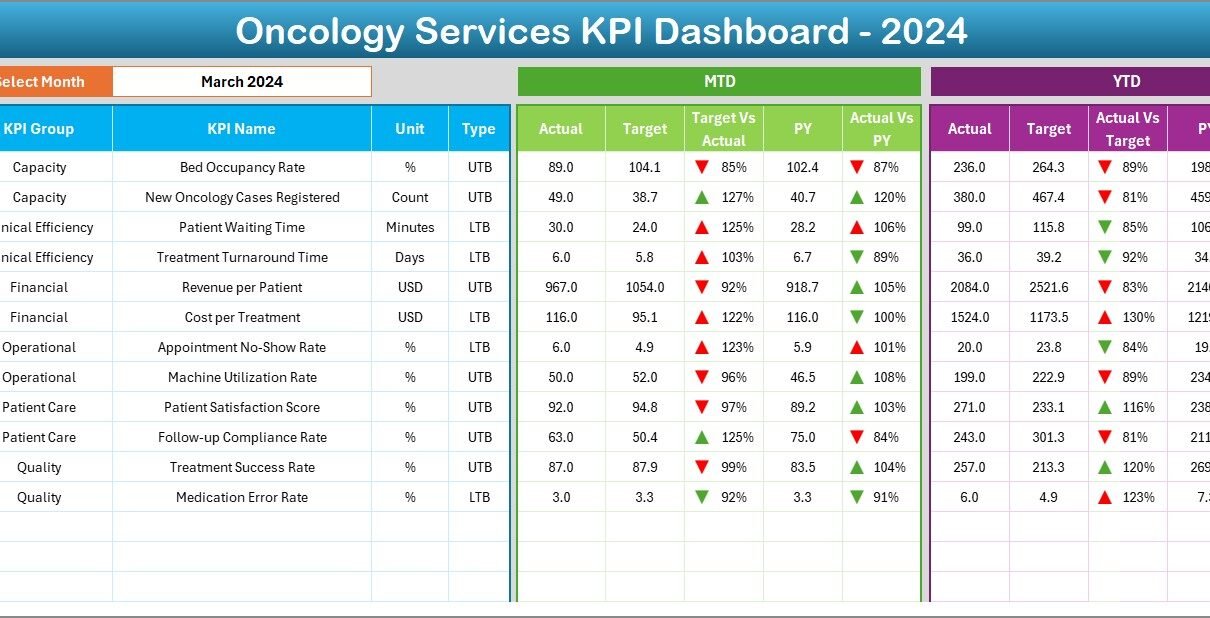
2. Dashboard Sheet – The Main Reporting Page
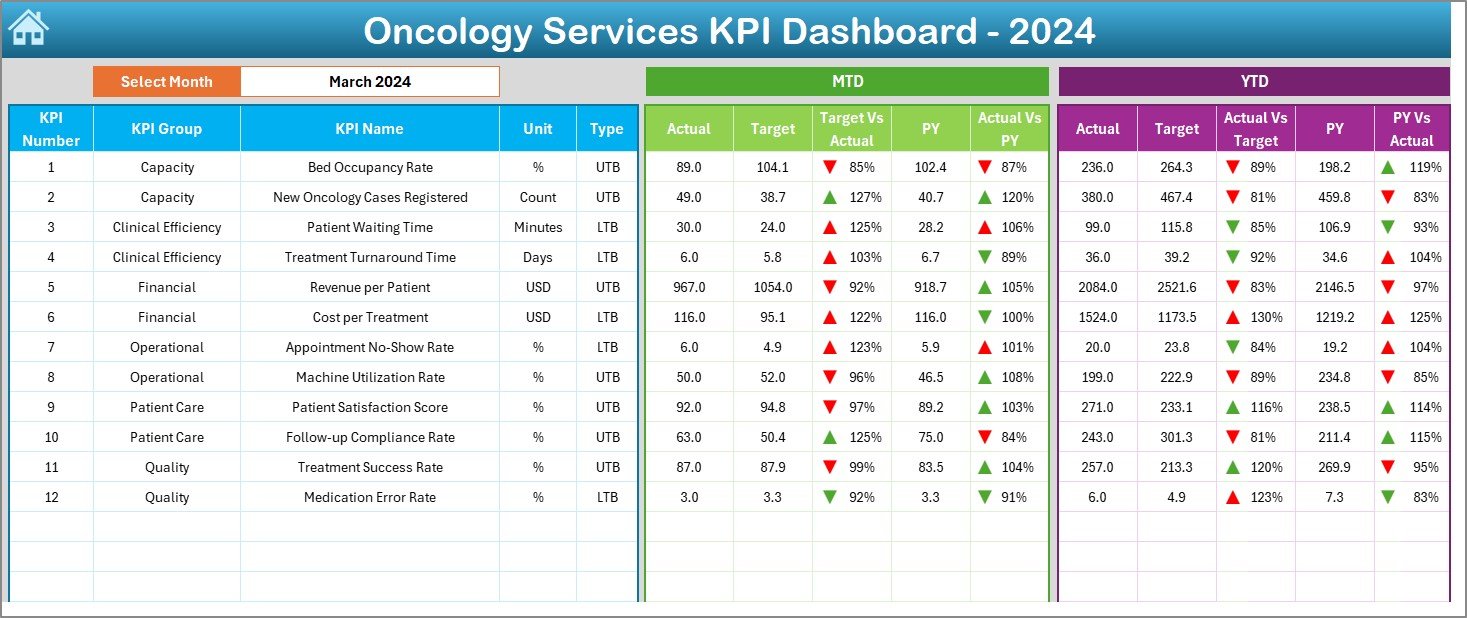
The Dashboard sheet tab displays all key performance indicators in a clean and interactive format. It works as the primary view where administrators analyze daily and monthly performance.
Here is what this sheet shows:
✔ Month Selector (Range D3)
You select a month from the drop-down list, and all numbers update instantly.
✔ MTD KPI Summary
-
MTD Actual
-
MTD Target
-
MTD Previous Year
-
Target vs Actual comparison
-
Previous Year vs Actual comparison
-
Up/down arrows using conditional formatting
✔ YTD KPI Summary
-
YTD Actual
-
YTD Target
-
YTD Previous Year
-
Target vs Actual comparison
-
Previous Year vs Actual comparison
-
Conditional arrows to show direction
This sheet gives a quick and powerful snapshot of oncology operations.
3. KPI Trend Sheet – Visual Tracking of Performance
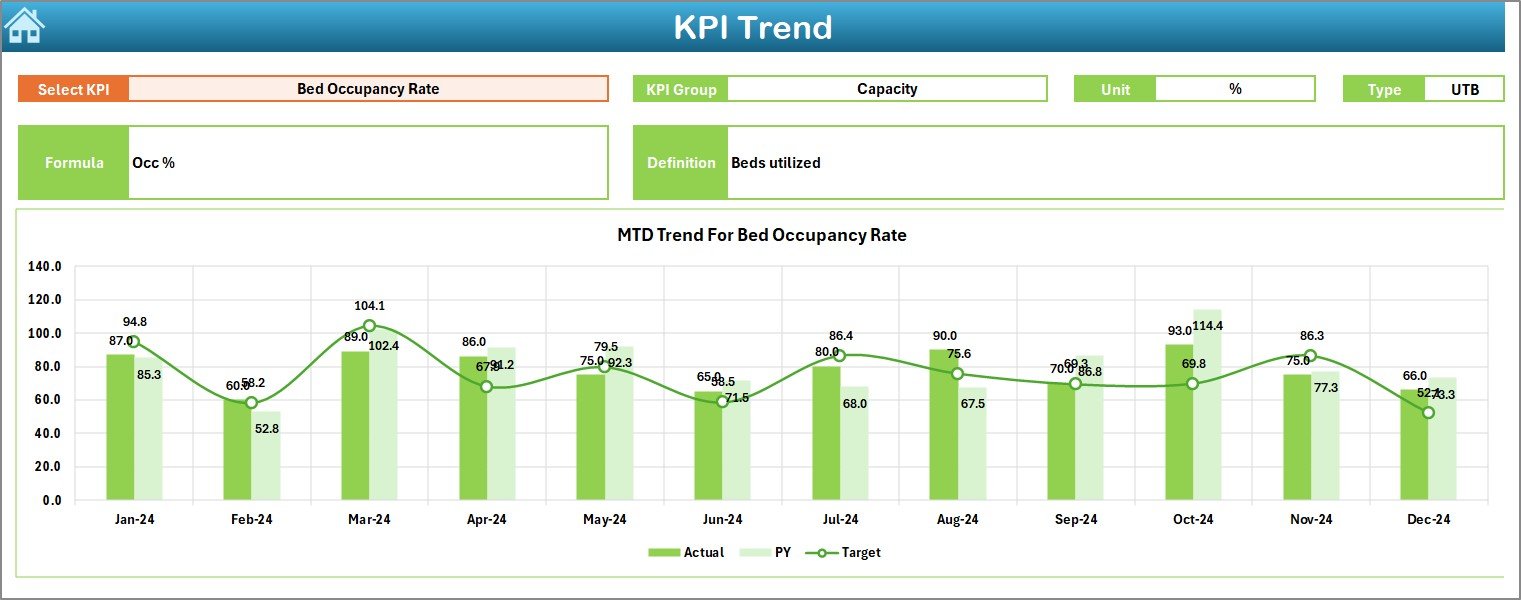
The KPI Trend sheet lets you analyze trends over time. You can select any KPI from the drop-down in cell C3, and the sheet updates instantly.
It displays:
-
KPI Group
-
KPI Unit
-
KPI Type (Lower the Better or Upper the Better)
-
KPI Formula
-
KPI Definition
You also see MTD and YTD trend charts for Actual, Target, and Previous Year values. This helps oncology teams spot issues, track improvements, and understand long-term performance patterns.
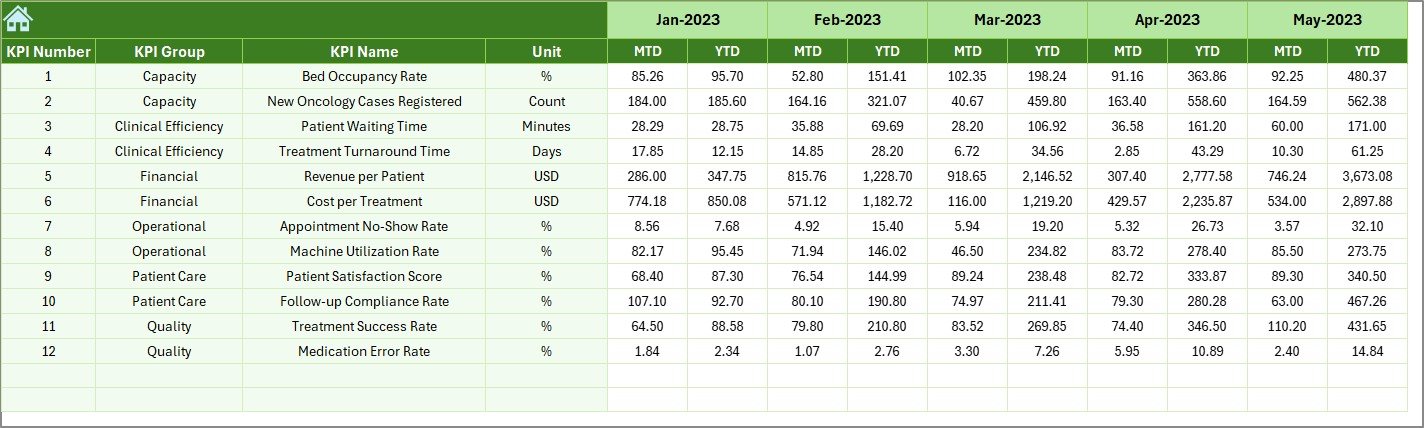
4. Actual Numbers Input Sheet – Simple Monthly Data Entry
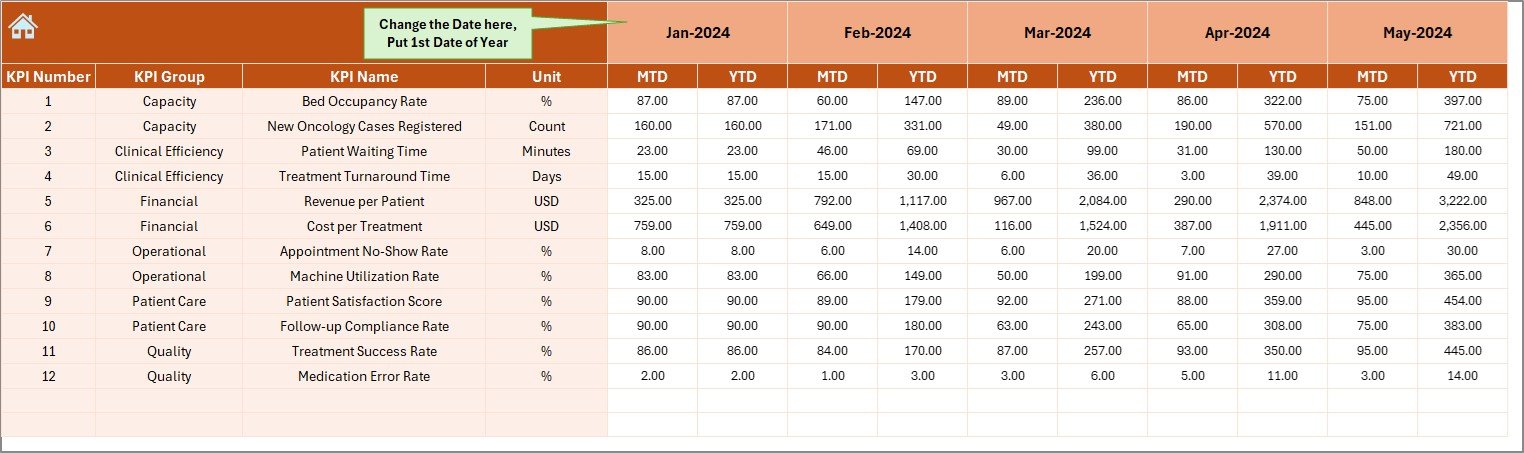
The Actual Numbers Input sheet allows you to enter MTD and YTD numbers for each KPI. You can update the month by changing the first month of the year in cell E1.
You only enter:
-
Actual MTD
-
Actual YTD
Excel handles all calculations and works for every KPI automatically.
5. Target Sheet – Define KPI Goals Clearly
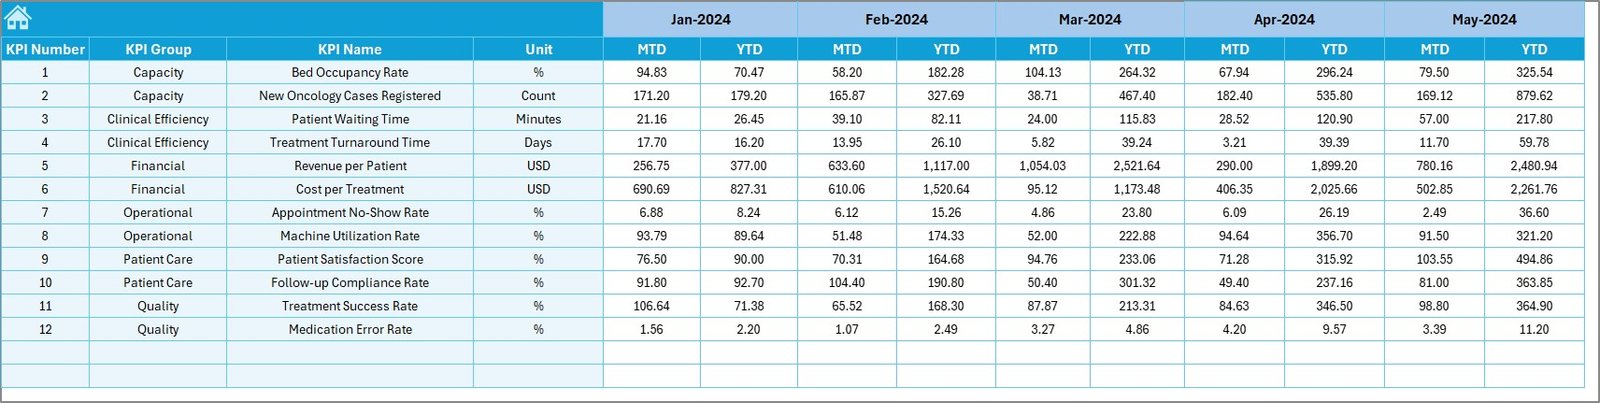
In the Target sheet tab, you enter the monthly and YTD target numbers for each KPI. This helps leaders plan capacity, staff needs, patient flow, and treatment goals.
You can add:
-
MTD Target
-
YTD Target
This sheet becomes the baseline for performance comparison.
6. Previous Year Number Sheet – Compare Year-over-Year
The Previous Year Numbers sheet lets you enter last year’s data. Oncology teams use this sheet to compare progress with previous performance.
This comparison highlights improvements or declines across:
-
Diagnostic processes
-
Treatment volumes
-
Patient care numbers
-
Efficiency metrics
-
Outcomes
Because oncology services depend on continuous improvement, this sheet becomes extremely helpful.
7. KPI Definition Sheet – Standardize Oncology Metrics
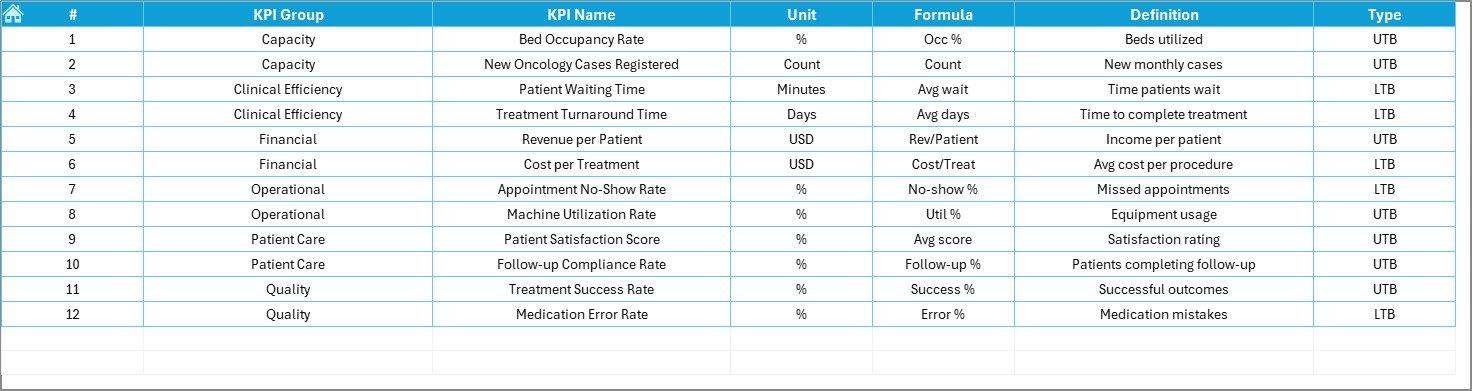
The KPI Definition sheet includes:
-
KPI Name
-
KPI Group
-
KPI Unit
-
KPI Type (UTB or LTB)
-
Formula
-
KPI Definition
This sheet ensures clarity, consistency, and audit readiness. Every doctor or administrator can check how a KPI is calculated and what it means.
What KPIs Does an Oncology Dashboard Usually Track?
Below are examples of KPIs commonly used in oncology services:
Patient Care KPIs
-
New cancer cases registered
-
Ongoing treatment cases
-
Average time from diagnosis to treatment
-
Patient satisfaction score
-
Treatment compliance rate
Chemotherapy KPIs
-
Chemotherapy cycles completed
-
Adverse reaction rate
-
Average chemotherapy waiting time
Radiation Therapy KPIs
-
Radiation sessions completed
-
Machine downtime
-
Radiation plan approval time
Diagnostic KPIs
-
Biopsy turnaround time
-
Radiology report time
-
Lab test turnaround time
Operational KPIs
-
Bed occupancy rate
-
Oncology OPD visits
-
Doctor-to-patient ratio
Financial KPIs
-
Cost per treatment
-
Insurance approval cycle time
-
Revenue per patient
Because every oncology center works differently, you can modify all KPIs inside the dashboard.
Why Excel Is the Best Tool for Oncology KPI Tracking
Many hospitals want automation but do not want complex tools. Excel becomes the best solution because:
-
It is easy to use
-
It requires no coding
-
Everyone understands Excel
-
You can update data quickly
-
You can customize KPIs anytime
-
Charts and visuals update instantly
-
It works offline
-
It supports secure sharing
Therefore, this dashboard becomes the perfect fit for medium and large oncology units.
Advantages of an Oncology Services KPI Dashboard in Excel
Using this dashboard gives oncology teams a strong advantage. Below are the major benefits:
1. Better Decision-Making
You see real-time data for every KPI. Therefore, decision-makers can act quickly, adjust resources, and support patients better.
2. Faster Treatment Monitoring
Because the dashboard shows daily progress, oncologists can track treatment performance, chemotherapy cycles, and diagnostic timelines with ease.
3. Higher Patient Satisfaction
You reduce delays, improve communication, and increase care quality. These improvements raise patient satisfaction scores.
4. Improved Efficiency
Since the system highlights gaps, teams can reduce waiting times, manage beds better, and streamline oncology workflows.
5. Makes Reporting Simple
You build reports in seconds. Managers can export visuals, share dashboards, and prepare audit-ready summaries without stress.
6. Full Customization
Every hospital uses different KPIs. This dashboard allows complete customization to match your needs.
Best Practices for Using the Oncology Services KPI Dashboard
To get the maximum value from this dashboard, follow these best practices:
1. Update Data on Time
Enter actuals every week or month. This keeps insights fresh and accurate.
2. Use Clear KPI Definitions
Make sure every doctor and administrator understands the meaning and formula of each KPI.
3. Track Trends, Not Just Monthly Numbers
Use the Trend Sheet to study long-term patterns. It helps you identify major shifts in oncology care.
4. Review Target vs. Actual Frequently
Compare performance with targets often. This supports improvement and accountability.
5. Customize KPIs Based on Your Oncology Unit
Add or remove KPIs depending on:
-
Patient volume
-
Facilities
-
Treatment options
-
Diagnostic services
You can adjust the dashboard anytime.
6. Share the Dashboard With All Stakeholders
Oncologists, nurses, managers, and finance teams should use the same dashboard. This brings alignment across departments.
How This Dashboard Helps Oncology Hospitals Grow
This dashboard does more than reporting. It becomes a tool for growth. Teams can:
-
Improve patient outcomes
-
Reduce treatment delays
-
Strengthen resource planning
-
Increase revenue accuracy
-
Maintain compliance
-
Achieve quality certifications
Because oncology services demand precision, this dashboard supports stronger and more structured clinical performance.
Conclusion
The Oncology Services KPI Dashboard in Excel gives cancer hospitals and oncology departments a powerful and simple way to track essential performance indicators. It brings clarity to patient treatment, diagnostic workflows, chemotherapy sessions, radiation therapy, and overall hospital efficiency.
Since Excel offers real-time updates, trend analysis, and full customization, oncology teams can track monthly and yearly data without technical effort. This dashboard improves decision-making, reduces delays, enhances patient satisfaction, and helps hospitals achieve better clinical outcomes.
If you want a complete, accurate, and ready-to-use dashboard for cancer care reporting, this Excel-based solution will give you full control over your oncology KPIs.
Frequently Asked Questions (FAQs)
1. What is an Oncology Services KPI Dashboard?
It is an Excel-based reporting tool that tracks and displays key performance indicators for oncology services.
2. Who can use this dashboard?
Oncologists, administrators, nurses, finance teams, and hospital management teams can use it.
3. Do I need advanced Excel skills to use this dashboard?
No. You only enter your numbers in simple tables. Everything else updates automatically.
4. Can I customize the KPIs?
Yes. You can add or remove KPIs based on your oncology unit’s needs.
5. Does the dashboard include charts?
Yes. The Trend sheet includes MTD and YTD charts for each KPI.
6. How often should I update the data?
You should update it daily, weekly, or monthly based on your reporting process.
7. Can I compare data with the previous year?
Yes. The dashboard includes a Previous Year sheet to track year-over-year performance.
8. Is this dashboard suitable for small oncology clinics?
Yes. Both small and large oncology centers can use it because the layout is simple and scalable.
Visit our YouTube channel to learn step-by-step video tutorials