Efficient irrigation helps farms, landscapes, and agricultural projects grow with confidence. Yet, managing irrigation data often becomes difficult because information stays scattered across worksheets, meters, soil tests, and field logs. As a result, users spend more time collecting data than analyzing it. This slows down decisions, increases costs, and reduces resource efficiency.
An Irrigation Systems Dashboard in Excel solves these issues. It organizes data, shows trends, and presents clear insights in one simple view. Because the dashboard works inside Excel, users track water usage, energy consumption, costs, rainfall, soil performance, and irrigation type behavior without complex software.
In this detailed article, you will explore how the dashboard works, what each page shows, and how it supports better irrigation decisions. You will also learn the advantages, best practices, and answers to common questions. Let us begin.
Click to Purchases Irrigation Systems Dashboard
What Is an Irrigation Systems Dashboard in Excel?
An Irrigation Systems Dashboard in Excel is a ready-to-use workbook that tracks water usage, soil type performance, irrigation hours, cost trends, monthly changes, rainfall, and regional behavior. It uses slicers, charts, cards, and interactive buttons that help users view data from many angles.
Since Excel is easy to use, this dashboard becomes a strong analytical tool for farmers, agricultural officers, irrigation managers, landscaping teams, and sustainability departments. It helps them plan water usage, reduce waste, control cost, and improve efficiency across irrigation operations.
Key Features of the Irrigation Systems Dashboard in Excel
This dashboard contains 5 analytical pages and a support sheet with clean, structured data. A page navigator appears on the left side, allowing quick movement between pages.
Below is a clear breakdown of each page.
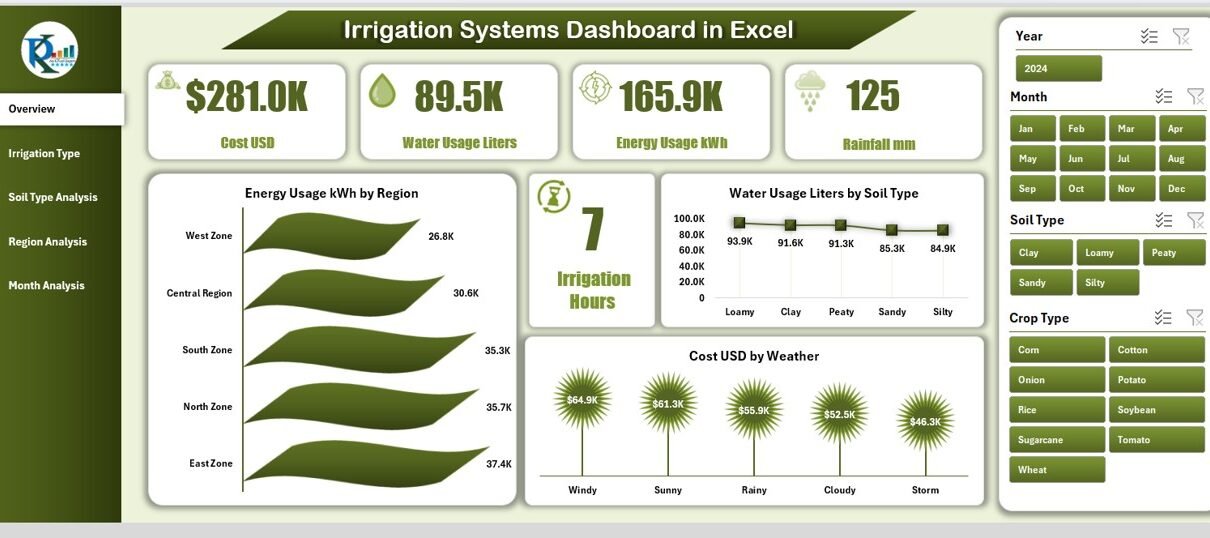
1. Overview Page – What Does It Show?
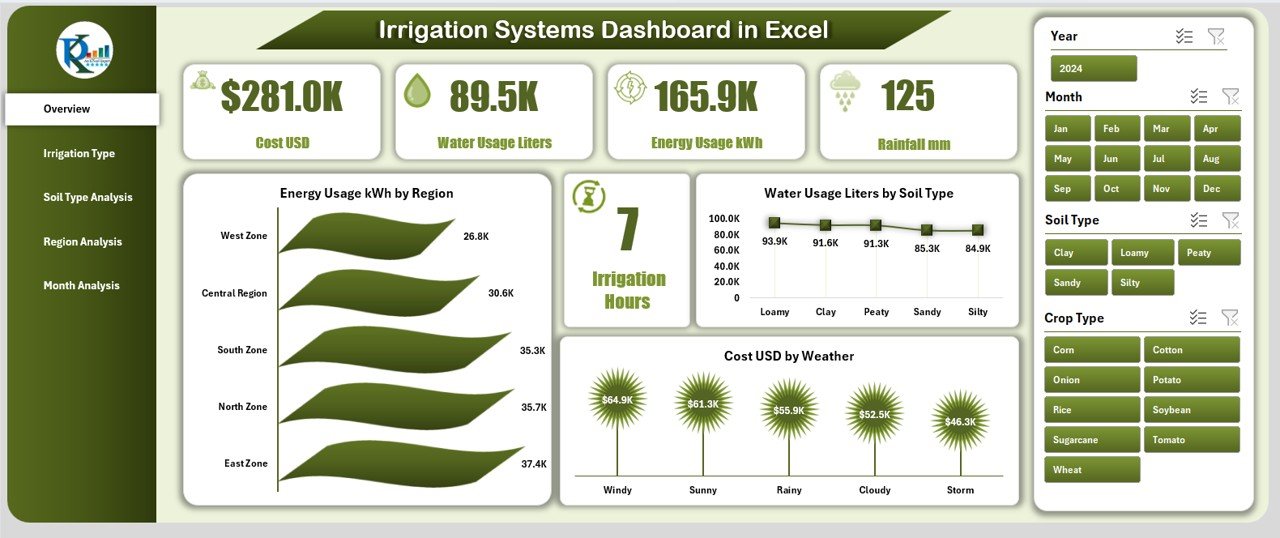
The Overview Page acts as the main summary of the entire system. It displays important insights through cards and charts, and users get an instant view of system performance.
Key elements on the Overview Page include:
-
✔ 5 summary cards
These cards highlight important indicators such as total cost, total water usage, energy usage, rainfall, and irrigation hours. -
✔ 4 major charts:
-
Energy Usage (kWh) by Region
-
Water Usage (Liters) by Soil Type
-
Cost (USD) by Weather
-
Water Usage / Energy Consumption comparisons
-
These visual summaries help users understand how different regions and soil types behave, how weather impacts cost, and how energy consumption changes over time.
Because of this structure, users quickly identify high-usage areas, cost-heavy fields, and patterns that affect irrigation performance.
2. Irrigation Type Analysis Page – What Can You Learn Here?
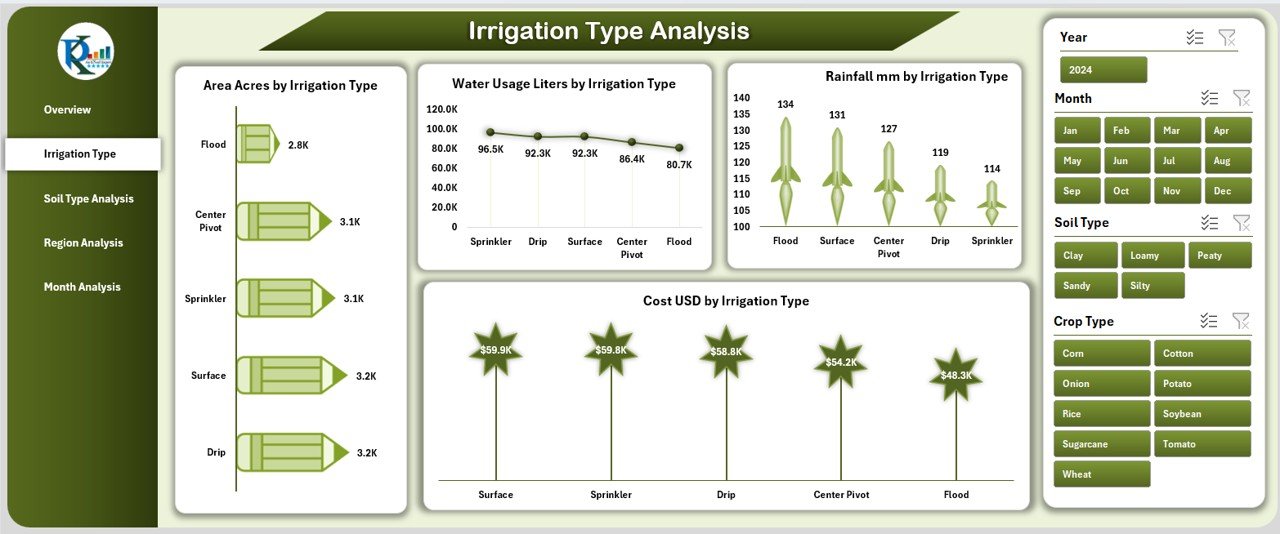
This page shows how each irrigation method performs. Since irrigation type directly affects water flow, pressure, energy usage, and cost, this page becomes extremely valuable.
Charts on this page include:
-
Area (Acres) by Irrigation Type
-
Water Usage (Liters) by Irrigation Type
-
Rainfall (mm) by Irrigation Type
-
Cost (USD) by Irrigation Type
Why this page matters:
-
You compare drip irrigation vs. sprinkler vs. flood irrigation.
-
You check which irrigation method uses more water.
-
You find the most cost-effective irrigation technique.
-
You observe how rainfall changes type-wise performance.
This page helps users choose better irrigation systems, plan upgrades, and optimize water allocation.
3. Soil Type Analysis Page – How Does Soil Behavior Affect Performance?
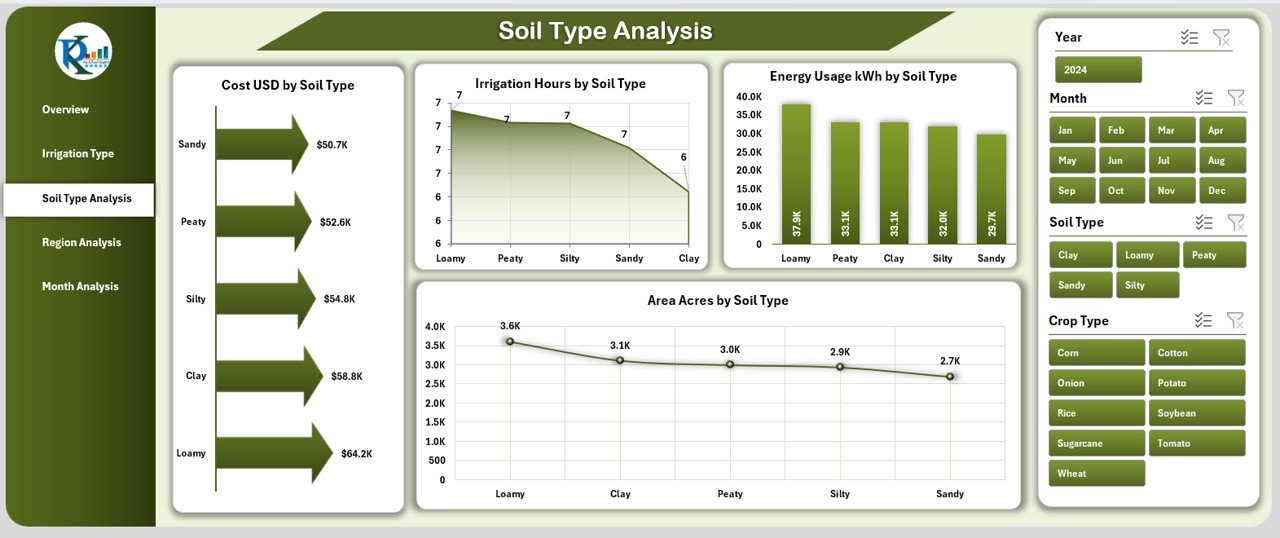
Different soil types—such as sandy, clay, loamy, or silt—absorb and retain water differently. Because of this, irrigation performance changes based on soil.
Click to Purchases Irrigation Systems Dashboard
The Soil Type Analysis Page includes:
-
Area (Acres) by Soil Type
-
Irrigation Hours by Soil Type
-
Energy Usage (kWh) by Soil Type
-
Area Repeated for Comparative Analysis
Insights from this page:
-
Soil with low water retention requires more irrigation hours.
-
Heavy soils may need more energy for pumping.
-
Some soil types show high cost due to longer irrigation cycles.
By understanding soil behavior, users make better choices about frequency, irrigation type, and water allocation.
4. Region Analysis Page – Why Regional Insights Matter
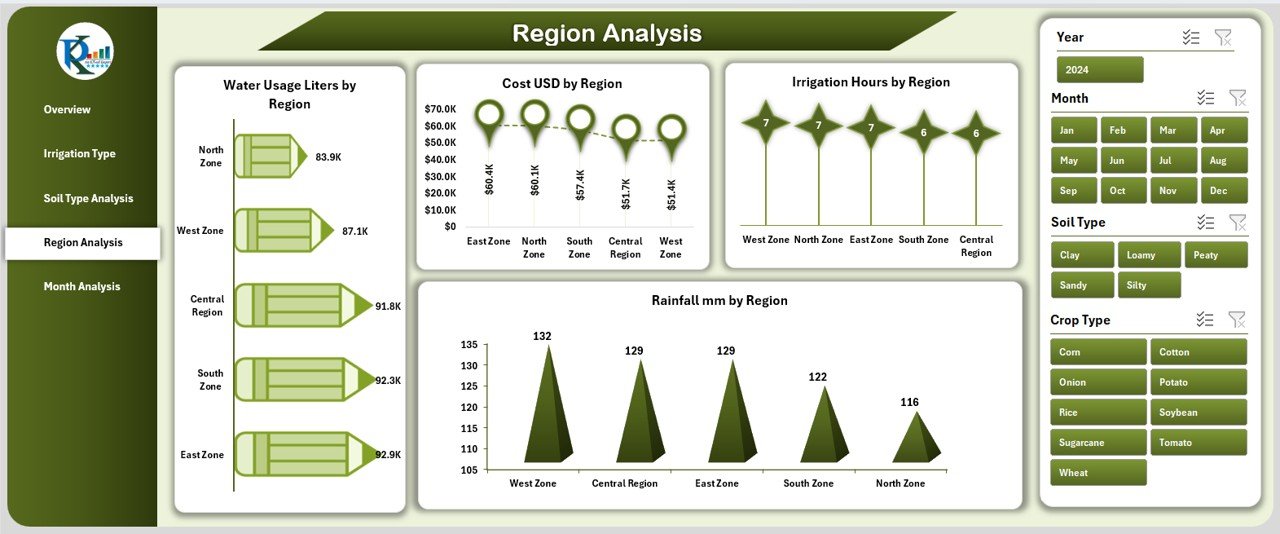
Irrigation behavior changes by region due to climate, rainfall, water sources, and field size. The Region Analysis Page helps identify these differences.
Charts on this page include:
-
Water Usage (Liters) by Region
-
Cost (USD) by Region
-
Irrigation Hours by Region
-
Rainfall (mm) by Region
Benefits of regional tracking:
-
You understand which regions consume more water.
-
You compare cost differences across locations.
-
You evaluate rainfall levels and adjust irrigation schedules.
-
You identify regions that require more attention or optimization.
This page is ideal for farms spread across multiple areas or organizations maintaining several irrigation sites.
5. Month Analysis Page – What Do Monthly Trends Tell You?
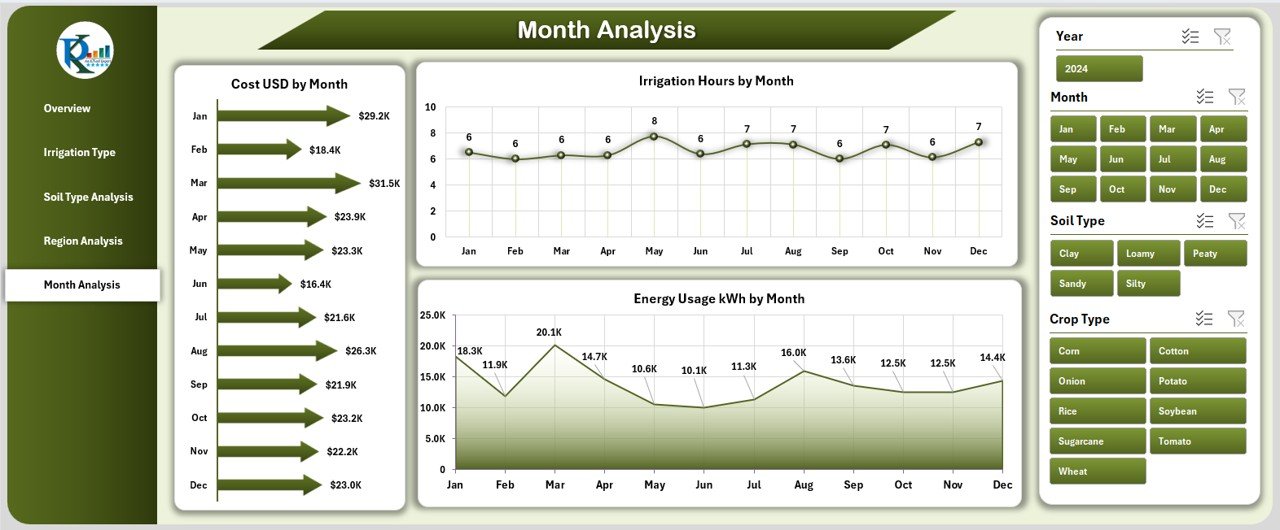
Monthly patterns help users predict future behavior and plan resources. The Month Analysis Page shows seasonal changes and helps create better irrigation schedules.
Charts include:
-
Cost (USD) by Month
-
Irrigation Hours by Month
-
Energy Usage (kWh) by Month
Why this page is useful:
-
You monitor irrigation cost month-by-month.
-
You track seasonal water needs.
-
You identify months with high or low energy consumption.
-
You plan maintenance, fertilizer schedules, and water-saving methods.
Seasonal analysis helps improve decision-making and reduces unnecessary usage.
Why Should You Use an Irrigation Systems Dashboard in Excel?
Managing irrigation without analytics leads to confusion and waste. A dashboard brings clarity and structure to your data. Below are strong reasons to use this dashboard.
Advantages of Using an Irrigation Systems Dashboard in Excel
1. Easy Access to All Irrigation Insights
You no longer jump between different worksheets, notebooks, or reports. Everything appears in one place.
2. Better Water Management
You track water usage by soil type, region, irrigation type, and month. This helps you reduce waste and plan more efficiently.
3. Cost and Energy Optimization
The dashboard shows cost behavior and energy usage. Because of this, you identify high-cost months or high-energy zones immediately.
4. Improved Decision-Making
Clear visuals help you compare performance at every level. You make quick decisions based on real data rather than assumptions.
5. Saves Time and Effort
The dashboard automates many calculations. Users spend less time pulling reports and more time focusing on improvement.
6. Ideal for All Types of Users
Farmers, analysts, agricultural students, sustainability teams, irrigation managers, and researchers benefit from this dashboard.
7. User-Friendly and Ready to Use
You need no advanced technical skills. Open the Excel file, load your data, and start analyzing.
How Does an Irrigation Systems Dashboard Help in Practical Work?
Let us understand how this dashboard helps real users:
• Farmers
Track water levels, rainfall, cost, and energy usage. Adjust schedules for better crop results.
• Irrigation Managers
Monitor system health, run-time, and performance differences across irrigation methods.
• Agriculture Officers
Prepare reports, fill compliance documents, and track sustainability progress.
• Landscape Maintenance Teams
Manage lawns, parks, gardens, and green belts with accurate water allocation.
• Universities and Research Centers
Study water conservation, soil behavior, and seasonal water demand.
Best Practices for Using the Irrigation Systems Dashboard in Excel
Following best practices ensures accurate reporting and reliable results.
1. Keep Data Updated Regularly
Update daily, weekly, or monthly based on your system. Fresh data improves accuracy.
2. Standardize Units of Measurement
Use the same units for water, energy, area, hours, and cost. This avoids reporting errors.
3. Validate Soil and Region Names
Use consistent spelling and avoid duplication (e.g., “North Region” vs. “North”).
4. Review Trends Before Making Changes
Check monthly, soil, region, and irrigation type performance before adjusting irrigation cycles.
5. Use Filters and Slicers
Filters help you compare performance across many dimensions.
6. Keep the Dashboard Clean
Avoid unnecessary colors or elements. Clean visuals are easier to understand.
7. Train Users
Help your team understand the metrics and charts so they can use the insights effectively.
How to Get the Most Value From This Dashboard
Click to Purchases Irrigation Systems Dashboard
To maximize the dashboard’s value, follow these tips:
-
Compare soil behavior before deciding irrigation duration.
-
Track monthly cost and adjust schedules before peak months.
-
Evaluate rainfall data to reduce unnecessary watering.
-
Compare regions and prioritize areas that need improvement.
-
Test new irrigation types and measure performance instantly.
With consistent use, this dashboard becomes a powerful tool that transforms irrigation planning.
Conclusion
The Irrigation Systems Dashboard in Excel is more than a simple reporting template. It is a complete analytical tool that helps users understand water usage, cost behavior, energy consumption, soil performance, and seasonal trends with clarity.
Because the dashboard is interactive and simple to use, farmers, irrigation managers, agricultural officers, and researchers gain real value from it. They make informed decisions, reduce waste, control cost, and improve irrigation efficiency.
With strong visuals, easy navigation, and clean data structure, this dashboard supports better planning and better outcomes in every irrigation system.
Frequently Asked Questions (FAQs)
1. What is an Irrigation Systems Dashboard in Excel?
It is a ready-to-use Excel dashboard that tracks water usage, energy usage, cost, rainfall, irrigation hours, soil behavior, irrigation types, and regional performance.
2. Who can use this dashboard?
Farmers, irrigation managers, researchers, landscape teams, agricultural students, and sustainability officers use this dashboard to monitor irrigation systems.
3. Does the dashboard require advanced Excel skills?
No. You can use it with basic Excel knowledge. Everything works through slicers and charts.
4. Can I add more data to the dashboard?
Yes. You can expand the data sheet and refresh the pivot tables.
5. Does the dashboard support multiple regions?
Yes. It tracks regions, soil types, irrigation types, and months.
6. What makes this dashboard useful?
It helps reduce water waste, lower cost, save energy, and understand soil and regional behavior.
7. Can I customize the charts?
Yes. You can edit colors, chart types, fields, and layout based on your needs
Visit our YouTube channel to learn step-by-step video tutorials