The aircraft leasing industry handles complex financial data, operational risk parameters, lessee performance, and global regulatory requirements. Because the leasing lifecycle involves multiple stakeholders—lessors, lessees, manufacturers, financiers, insurers, and regulators—tracking performance with accuracy becomes essential. When teams use scattered spreadsheets, emails, or static reports, they lose visibility, which results in errors, delays, and financial loss.
A ready-to-use Aircraft Leasing Dashboard in Excel solves this problem with clarity and structure. It centralizes all aircraft leasing metrics into one simple but powerful Excel-based dashboard. The dashboard helps companies track lease rates, maintenance reserves, deposits, high-risk ratings, on-time payments, regional trends, manufacturer performance, and monthly variations.
In this complete guide, you will learn how the dashboard works, its features, its structure, its advantages, and its best practices. You will also explore common questions that users ask while tracking aircraft leasing KPIs.
Click to Purchases Aircraft Leasing Dashboard in Excel
What Is an Aircraft Leasing Dashboard in Excel?
An Aircraft Leasing Dashboard in Excel is an analytical reporting tool designed for leasing companies, aviation finance teams, asset managers, and compliance departments. It helps them track financial KPIs, operational performance, regional trends, lessee risk ratings, maintenance reserves, and overall lease status.
Since the travel and aviation industry changes quickly, leasing companies need a fast and reliable way to monitor their lease portfolio. This dashboard organizes the entire dataset and displays insights using cards, charts, and slicers. Because of this structure, users get real-time, actionable insights without using complicated software.
The dashboard includes:
-
Page Navigator
-
Interactive slicers
-
KPI cards
-
Manufacturer analysis
-
Lessee type analysis
-
Regional analysis
-
Monthly trends
-
Input and support sheets
Everything works inside Excel, making it easy to update and maintain.
Why Do Aircraft Leasing Companies Need a KPI Dashboard?
Aircraft leasing companies handle:
-
Multiple lessees
-
Contract variations
-
Different aircraft types
-
Regional financial regulations
-
Maintenance obligations
-
Deposit amounts
-
Escalation rates
-
Risk ratings
-
Monthly lease payments
-
Global portfolio distributions
Tracking everything manually becomes slow and risky. A KPI dashboard improves:
-
Financial control
-
Asset monitoring
-
Operational transparency
-
Risk reduction
-
Collection efficiency
-
Data accuracy
-
Lease forecasting
-
Decision-making
With this dashboard, teams move from reactive reporting to proactive management.
Click to Purchases Aircraft Leasing Dashboard in Excel
Key Features of the Aircraft Leasing Dashboard in Excel
This dashboard has five complete analysis pages, plus support and data sheets. Each page serves a specific purpose, helping users monitor every area of the leasing business.
Page Navigator – Easy Multi-Page Navigation
The Page Navigator appears on the left side. It contains navigation buttons that help users jump directly to:
-
Overview
-
Manufacturer Analysis
-
Lessee Type Analysis
-
Region Analysis
-
Monthly Trends
This structure improves usability and ensures a smooth user experience.
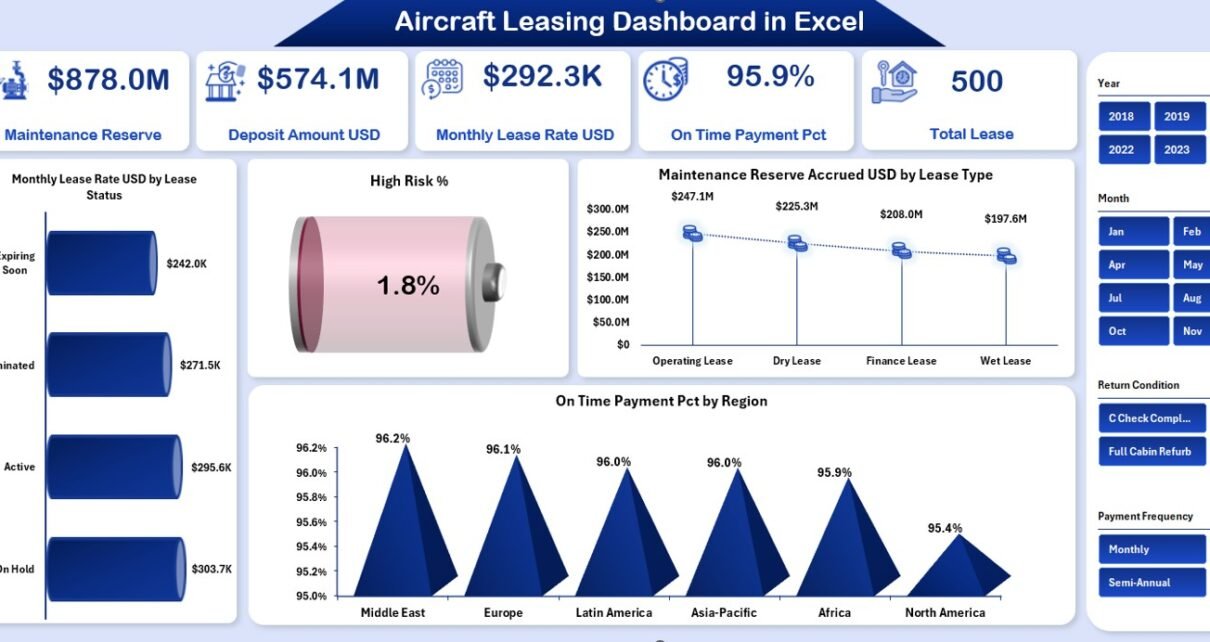
1. Overview Page – Complete Portfolio Summary
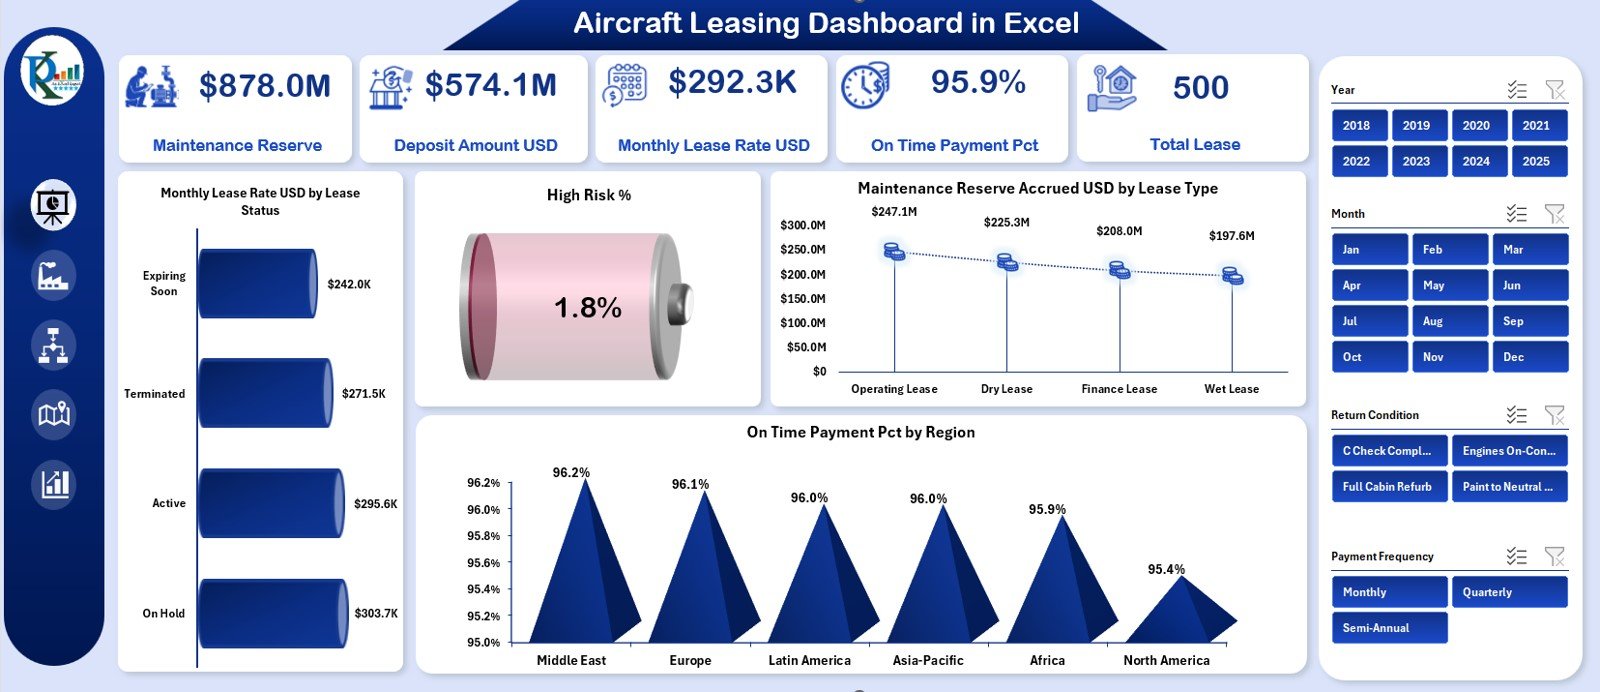
The Overview Page acts as the main page of the dashboard. The right-side slicer allows users to filter the results using categories such as:
-
Lease Status
-
Region
-
Manufacturer
-
Lessee Type
-
Aircraft Type
KPI Cards on the Overview Page
The page displays five important KPI cards:
-
Maintenance Reserve
-
Deposit Amount (USD)
-
Monthly Lease Rate (USD)
-
On-Time Payment (%)
-
Total Lease
These cards display the financial and operational health of the lease portfolio instantly.
Charts on the Overview Page
The page includes four analytical charts:
-
Monthly Lease Rate (USD) by Lease Status
-
High-Risk %
-
Maintenance Reserve Accrued (USD) by Lease Type
-
On-Time Payment % by Region
Each chart helps users analyze patterns:
-
Which lease status categories generate more revenue
-
How high-risk ratings change over time
-
How different lease types accumulate maintenance reserves
-
Which regions pay on time and which require follow-up
Together, these charts create a strong financial and operational overview.
Click to Purchases Aircraft Leasing Dashboard in Excel
2. Manufacturer Analysis – Compare Key Aircraft Manufacturers
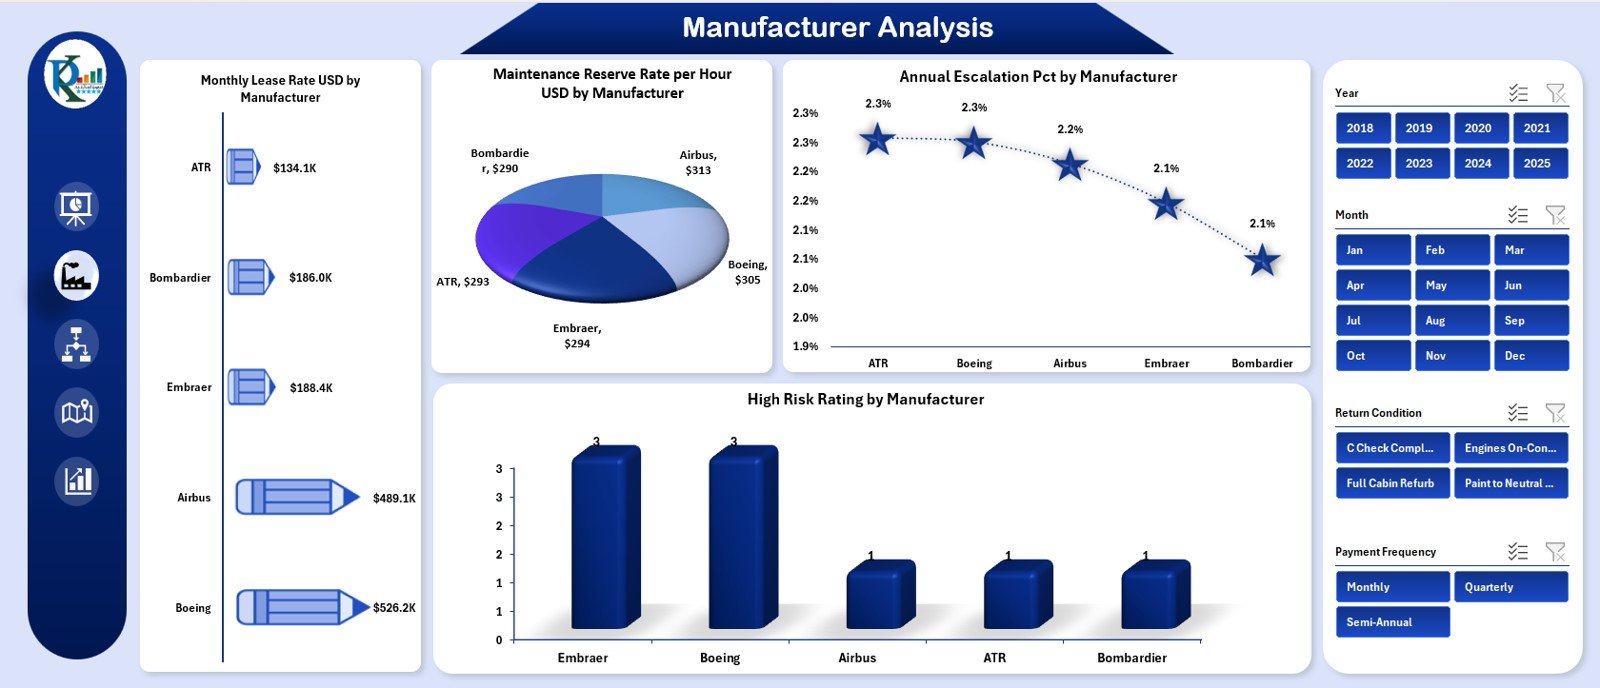
This page also includes a right-side slicer for easy filtering. The page analyzes leasing performance based on aircraft manufacturers such as:
-
Boeing
-
Airbus
-
Embraer
-
ATR
-
Bombardier
Charts on the Manufacturer Analysis Page
-
Monthly Lease Rate (USD) by Manufacturer
-
Maintenance Reserve Rate per Hour (USD) by Manufacturer
-
Annual Escalation (%) by Manufacturer
-
High-Risk Rating by Manufacturer
These charts help users understand:
-
Which manufacturers offer more profitable lease returns
-
Which aircraft generate higher maintenance costs
-
Which fleet has high or low escalation trends
-
Which manufacturer’s lessees fall under high-risk categories
This page supports better aircraft selection and contract structuring.
Click to Purchases Aircraft Leasing Dashboard in Excel
3. Lessee Type Analysis – Evaluate Lessee Performance
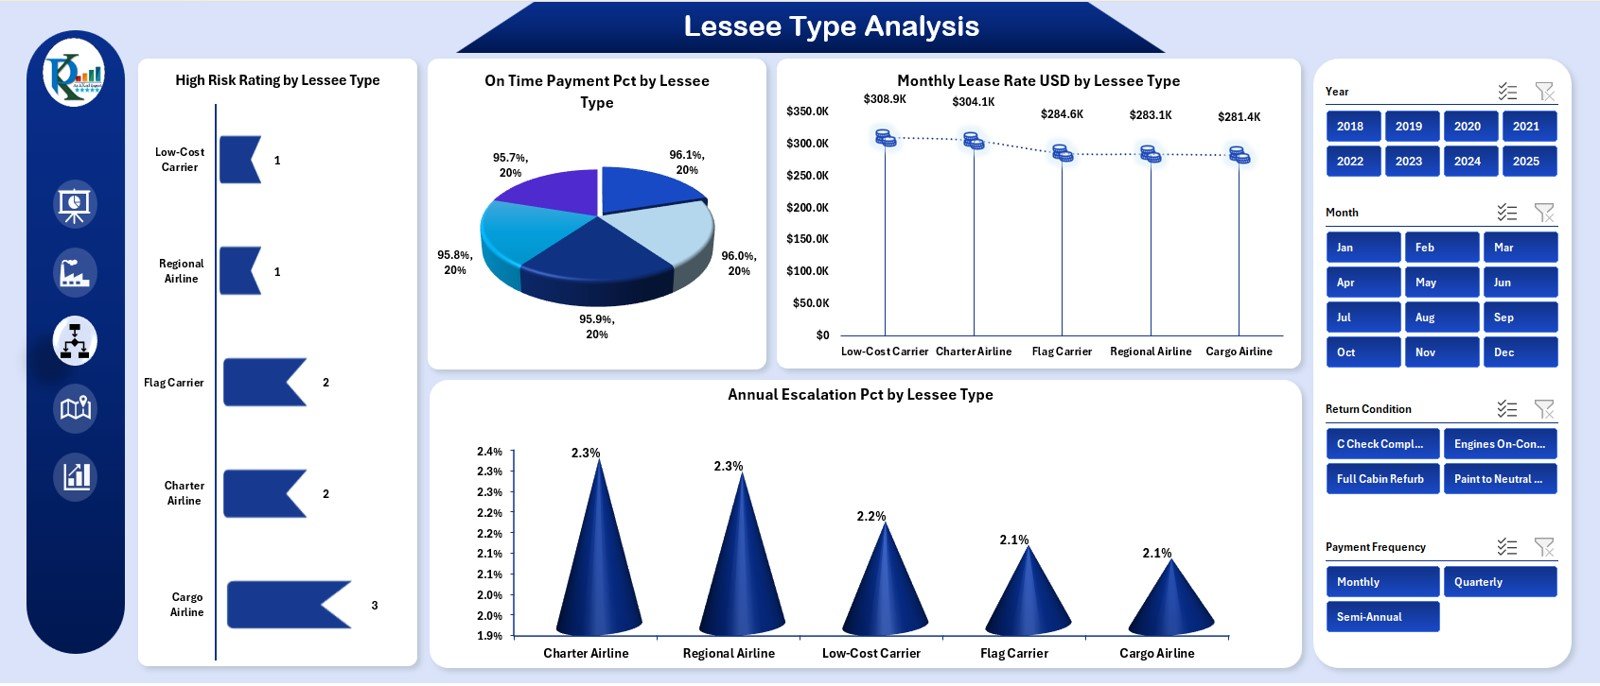
Different lessee types (low-cost carriers, full-service airlines, charter operators, cargo airlines, leasing companies, and regional carriers) behave differently. This page helps analyze their performance.
The right-side slicer helps users focus on specific lessee categories.
Charts on the Lessee Type Page
-
High-Risk Rating by Lessee Type
-
On-Time Payment % by Lessee Type
-
Monthly Lease Rate (USD) by Lessee Type
-
Annual Escalation % by Lessee Type
These charts help users see:
-
Which lessee type pays late
-
Which category offers better contract stability
-
Which type gives higher lease revenue
-
Which lessee type creates financial risks
This page supports strategic lessee selection and renewal planning.
Click to Purchases Aircraft Leasing Dashboard in Excel
4. Region Analysis – Compare Financial Performance Across Regions
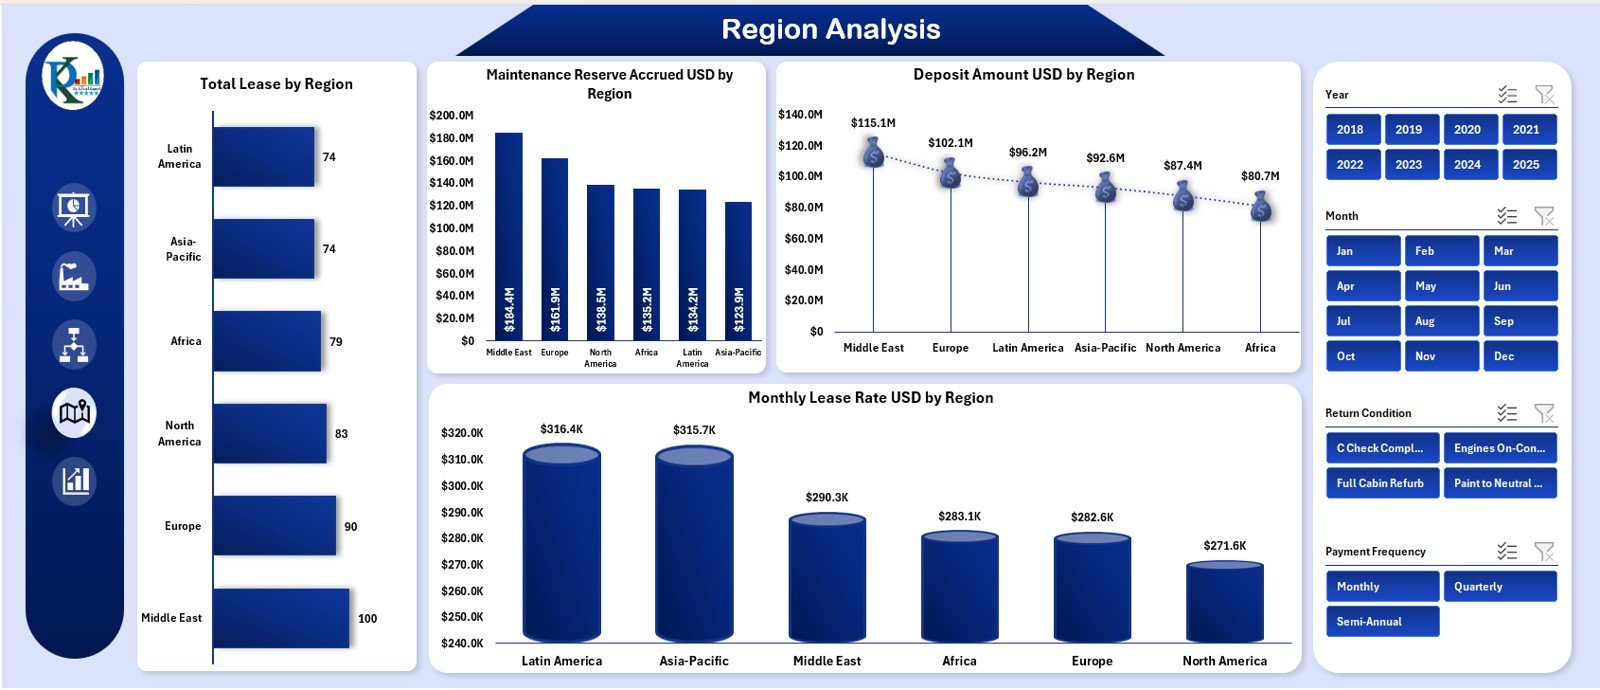
Aircraft leases differ by country and region due to economic, regulatory, and operational standards. The Region Analysis page shows these differences clearly.
The right-side slicer allows filtering by region.
Charts on the Region Analysis Page
-
Total Lease by Region
-
Maintenance Reserve Accrued (USD) by Region
-
Deposit Amount (USD) by Region
-
Monthly Lease Rate (USD) by Region
These charts reveal:
-
Which regions produce stable lease revenue
-
How maintenance reserves vary across markets
-
Which markets require higher deposits
-
Regional variations in lease rate structures
This supports global portfolio optimization.
5. Monthly Trends – Understand Time-Based Patterns
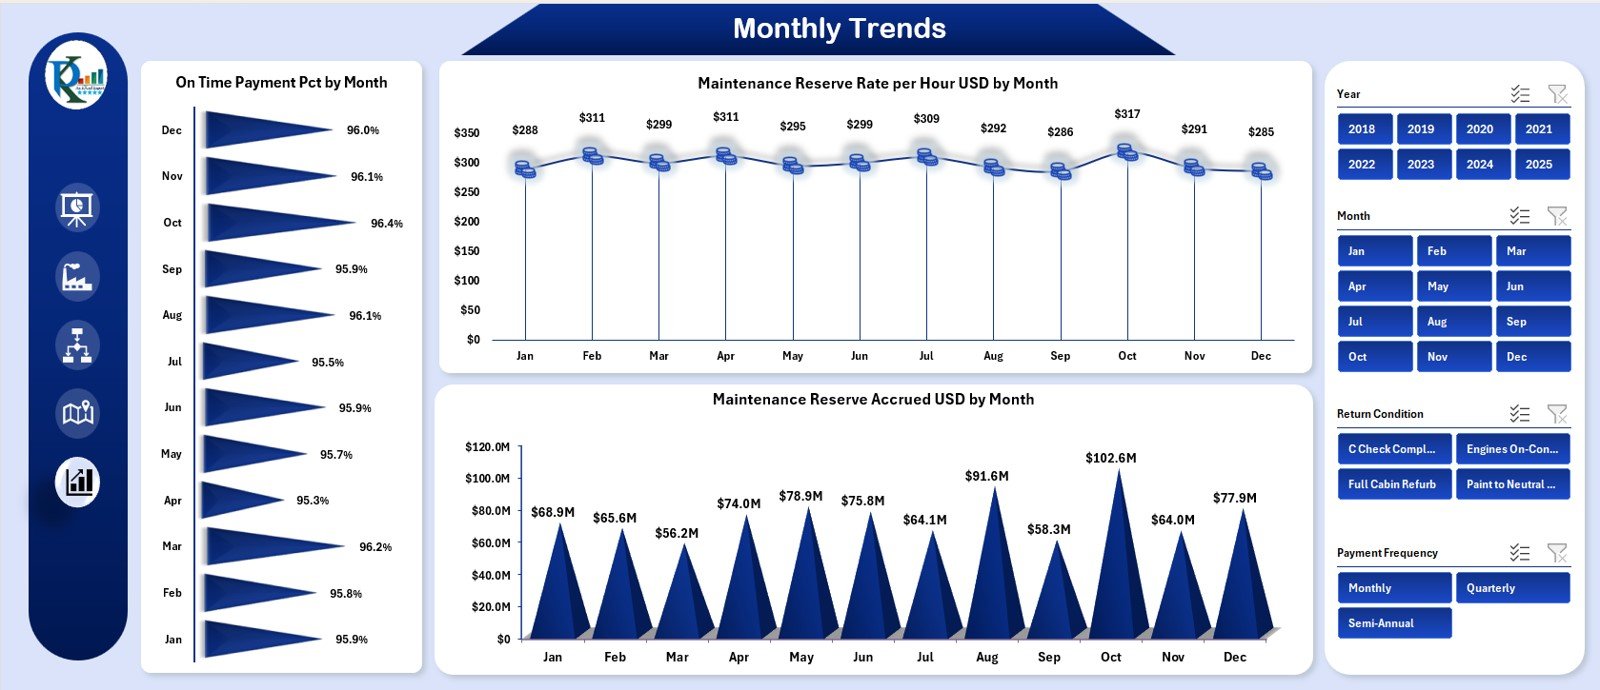
The Monthly Trends page shows how key KPIs change month-by-month.
Again, a right-side slicer simplifies filtering for specific months or conditions.
Charts on the Monthly Trends Page
-
On-Time Payment % by Month
-
Maintenance Reserve Rate per Hour (USD) by Month
-
Maintenance Reserve Accrued (USD) by Month
This page helps identify:
-
Payment delays
-
Seasonal workload impact
-
Aircraft usage variation
-
Maintenance reserve fluctuations
-
Portfolio risk patterns
Trend analysis helps leasing companies plan for payments, maintenance, and contract renewals.
Click to Purchases Aircraft Leasing Dashboard in Excel
Support Sheet & Data Sheet
These sheets contain:
-
Backend calculations
-
Raw data
-
Mappings
-
Helper formulas
-
Lookups
-
Data for slicers
Users do not need to modify these sheets often. They support all the calculations and visuals used in the dashboard.
What KPIs Should an Aircraft Leasing Dashboard Track?
Here are some of the most useful KPIs:
Financial KPIs
-
Monthly Lease Rate (USD)
-
Maintenance Reserve Accrued
-
Deposit Amount
-
Annual Escalation %
-
Total Lease Revenue
Operational KPIs
-
Maintenance Reserve Rate per Hour
-
Aircraft Utilization Hours
-
High-Risk Rating
-
On-Time Payment (%)
Lessee KPIs
-
Lessee Type Risk Profile
-
Payment Behavior
-
Contract Health
-
Lease Status
Manufacturer KPIs
-
Manufacturer Risk Trend
-
Lease Rate by Manufacturer
-
Maintenance Cost Differences
Regional KPIs
-
Lease Contribution by Region
-
Deposit Variation
-
Payment Performance
These KPIs provide a complete picture of aircraft leasing performance.
Click to Purchases Aircraft Leasing Dashboard in Excel
Advantages of Using an Aircraft Leasing Dashboard in Excel
This dashboard delivers multiple benefits that improve speed, accuracy, and financial control.
1. You Get a Centralized View of Your Entire Lease Portfolio
The dashboard consolidates all KPIs into one easy-to-understand interface.
2. You Improve Financial Monitoring
Lease rates, deposits, escalation percentages, and maintenance reserves stay updated.
3. You Reduce Manual Labor
Excel formulas and pivot structures automate reporting.
4. You Identify Risk Early
High-risk percentages, regional payment behavior, and lessee type risk become clear.
5. You Strengthen Decision-Making
Manufacturers, regions, and lessee types can be compared instantly.
6. You Improve Cash-Flow Planning
Monthly trends reveal payment cycles and delays.
7. You Enhance Lease Negotiation Strategy
Understanding KPIs strengthens negotiation power with lessees and manufacturers.
Click to Purchases Aircraft Leasing Dashboard in Excel
Best Practices for Using the Aircraft Leasing Dashboard in Excel
Follow these practices to maximize value:
1. Update Monthly Data Consistently
Fresh data creates accurate insights.
2. Verify Maintenance Reserve Entries
These numbers affect long-term financial forecasts.
3. Track High-Risk Lessees Closely
This reduces exposure to payment defaults.
4. Review Manufacturer Trends
Some manufacturers have higher maintenance costs or escalation rates.
5. Compare Regions Regularly
Regional risk and revenue vary significantly.
6. Use the Page Navigator for Clear Workflow
It keeps the analysis structured.
7. Train Teams to Use the Dashboard
Data-driven teams make stronger decisions.
Conclusion
An Aircraft Leasing Dashboard in Excel is a powerful tool that gives aircraft leasing companies full visibility into their financial and operational performance. Because it covers manufacturer, lessee type, region, and monthly trends, companies gain clarity and control over their entire lease portfolio.
The dashboard improves decision-making, highlights risk, simplifies analysis, and supports long-term strategic planning. As a result, leasing companies optimize revenue, reduce financial exposure, and strengthen their global portfolio structure.
Click to Purchases Aircraft Leasing Dashboard in Excel
Frequently Asked Questions (FAQs)
1. Is the dashboard suitable for small leasing companies?
Yes, it works for both small and large leasing portfolios.
2. Can I add more KPIs to the dashboard?
Yes, you can expand the data sheets and refresh the visuals.
3. Is this dashboard difficult to update?
No, you only update the data sheet with new monthly numbers.
4. Does it support multi-region analysis?
Yes, the dashboard includes region-wise charts.
5. Can I track both financial and operational KPIs?
Yes, the dashboard includes KPIs for revenue, deposits, maintenance reserves, risk, and payment behavior.
Click to Purchases Aircraft Leasing Dashboard in Excel
Visit our YouTube channel to learn step-by-step video tutorials