Logistics tech startups operate in a fast and competitive environment. They handle funding, revenue, customers, delivery time, app performance, fuel cost, technology expenses, and regional operations. Because these companies grow quickly, they need better visibility and faster insights. Traditional spreadsheets and manual reporting slow down decisions and increase operational risks.
A Logistics Tech Startups Dashboard in Excel solves this problem. It offers a ready-to-use, clean, and interactive reporting system that helps founders, operations teams, and investors track performance easily. With simple sheet navigation, slicers, KPI cards, and charts, this dashboard turns raw data into meaningful insights.
In this complete guide, you will learn how the dashboard works, its structure, pages, advantages, best practices, and FAQs. If you run or support a logistics startup, this dashboard will help you understand your business better.
Click to Purchases Logistics Tech Startups Dashboard in Excel
What Is a Logistics Tech Startups Dashboard in Excel?
A Logistics Tech Startups Dashboard in Excel is a dynamic analytics tool that helps startup teams track the most important KPIs for logistics operations. It shows total funding, revenue, tech cost, fuel cost, customer satisfaction, delivery performance, business model insights, and regional metrics. It also includes monthly trends to study performance growth.
Since it is built in Excel, the dashboard is easy to use, update, and customize. Every page includes charts and slicers that help you filter data and view insights instantly.
This dashboard is perfect for:
-
Logistics startups
-
Last-mile delivery companies
-
On-demand delivery platforms
-
E-commerce logistics partners
-
Mobility tech startups
-
Hyperlocal delivery services
-
Fleet management startups
The dashboard includes five analytical pages, each offering a different perspective of your business.
Dashboard Structure and Page Navigation
This Excel dashboard includes an easy Page Navigator on the left side. It helps you switch between pages quickly without scrolling through sheet tabs. Each page focuses on a business area and includes slicers on the right side for filtering data.
The dashboard includes the following five pages:
-
Overview Page
-
Customer Segment Analysis
-
Cost Analysis
-
Region Analysis
-
Monthly Trends
Let’s explore each page in detail.
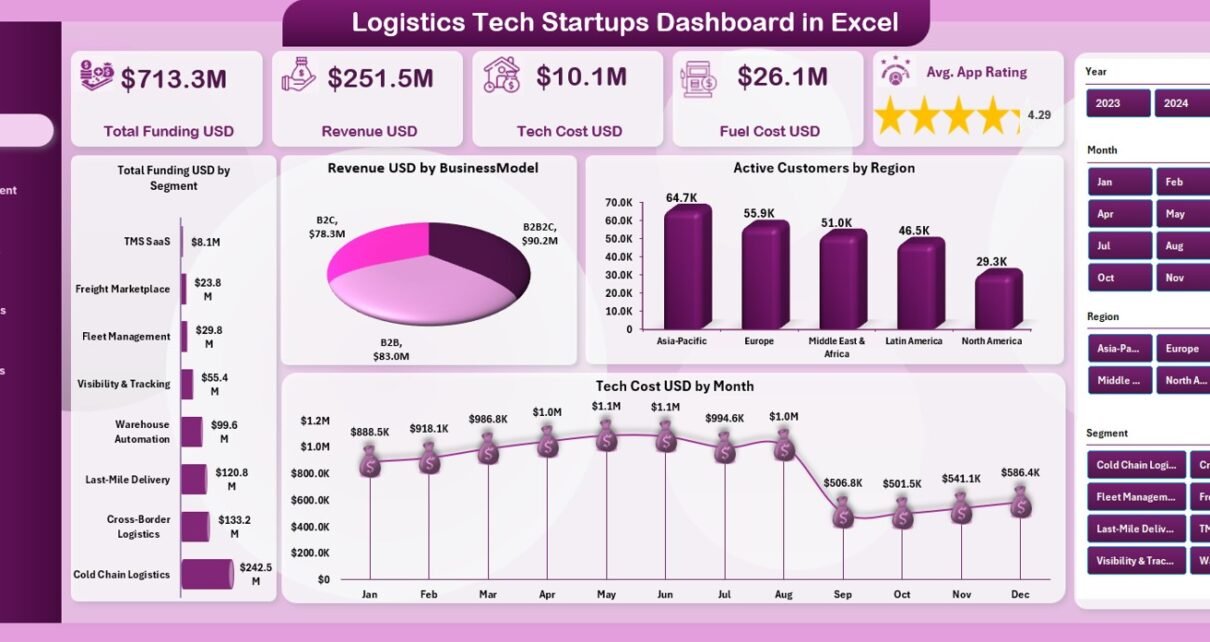
1. Overview Page – Your Startup’s Performance Snapshot
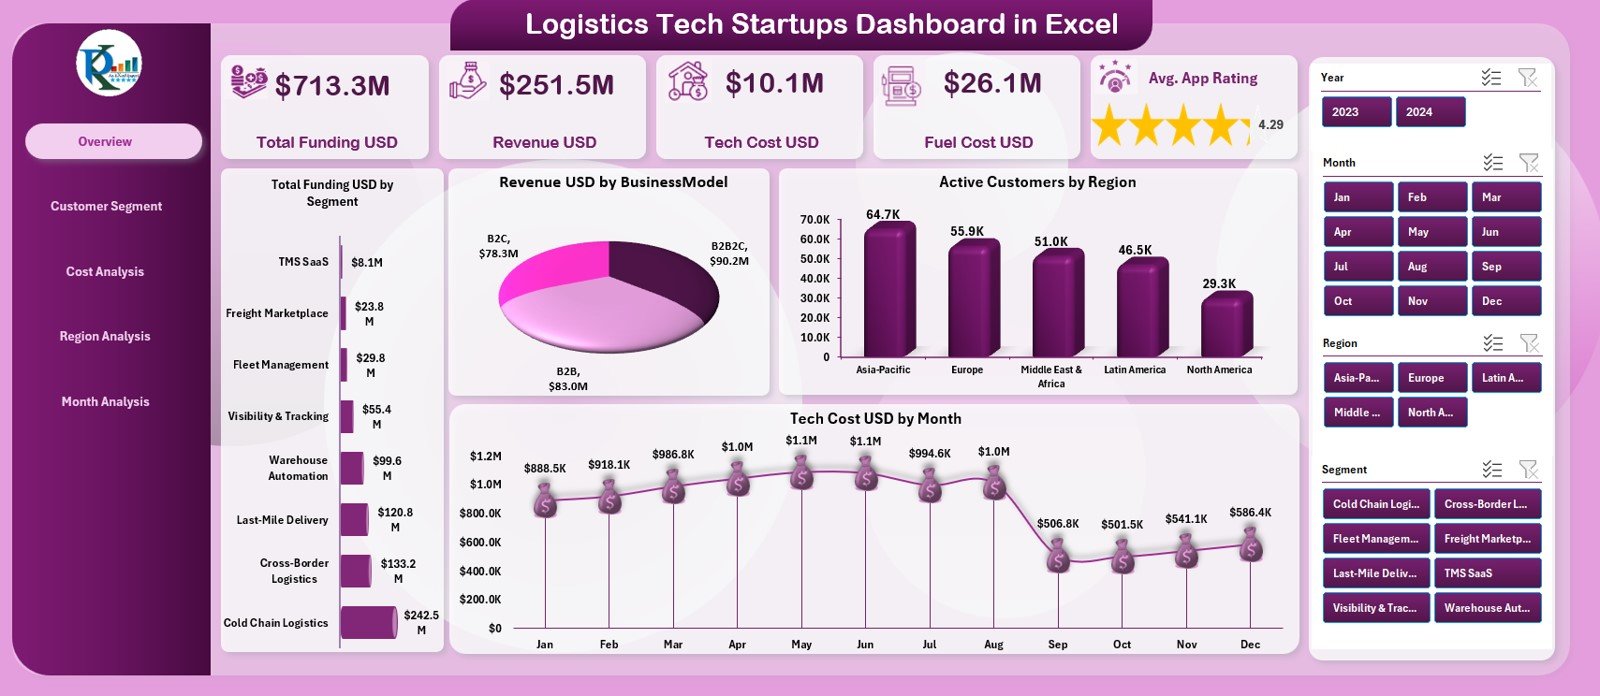
The Overview Page acts as the home screen for all logistics KPIs. It includes right-side slicers for filtering the dashboard by month, region, business model, segment, or customer group.
Five KPI Cards on the Overview Page
The page displays five important financial and operational cards:
✔ Total Funding (USD)
Shows all external funding raised by the startup.
✔ Revenue (USD)
Shows the revenue earned by the startup.
✔ Tech Cost (USD)
Shows the amount spent on technology development and product scaling.
✔ Fuel Cost (USD)
Highlights the fuel-related expenses of delivery operations.
✔ Average Satisfaction Rating
Tracks customer satisfaction quality of the platform or app.
These KPIs provide a quick overview of your startup’s health.
Charts on the Overview Page
The page includes four high-impact charts:
1. Total Funding (USD) by Segment
Shows which customer or business segments contribute most to funding.
2. Revenue (USD) by Business Model
Helps you compare business models such as subscription, pay-per-delivery, hybrid, or marketplace.
3. Active Customers by Region
Shows customer distribution across regions.
4. Tech Cost (USD) by Month
Displays month-wise technology spending patterns.
These insights help founders understand business strengths and growth areas.
Click to Purchases Logistics Tech Startups Dashboard in Excel
2. Customer Segment Analysis – Understand Customer Behavior
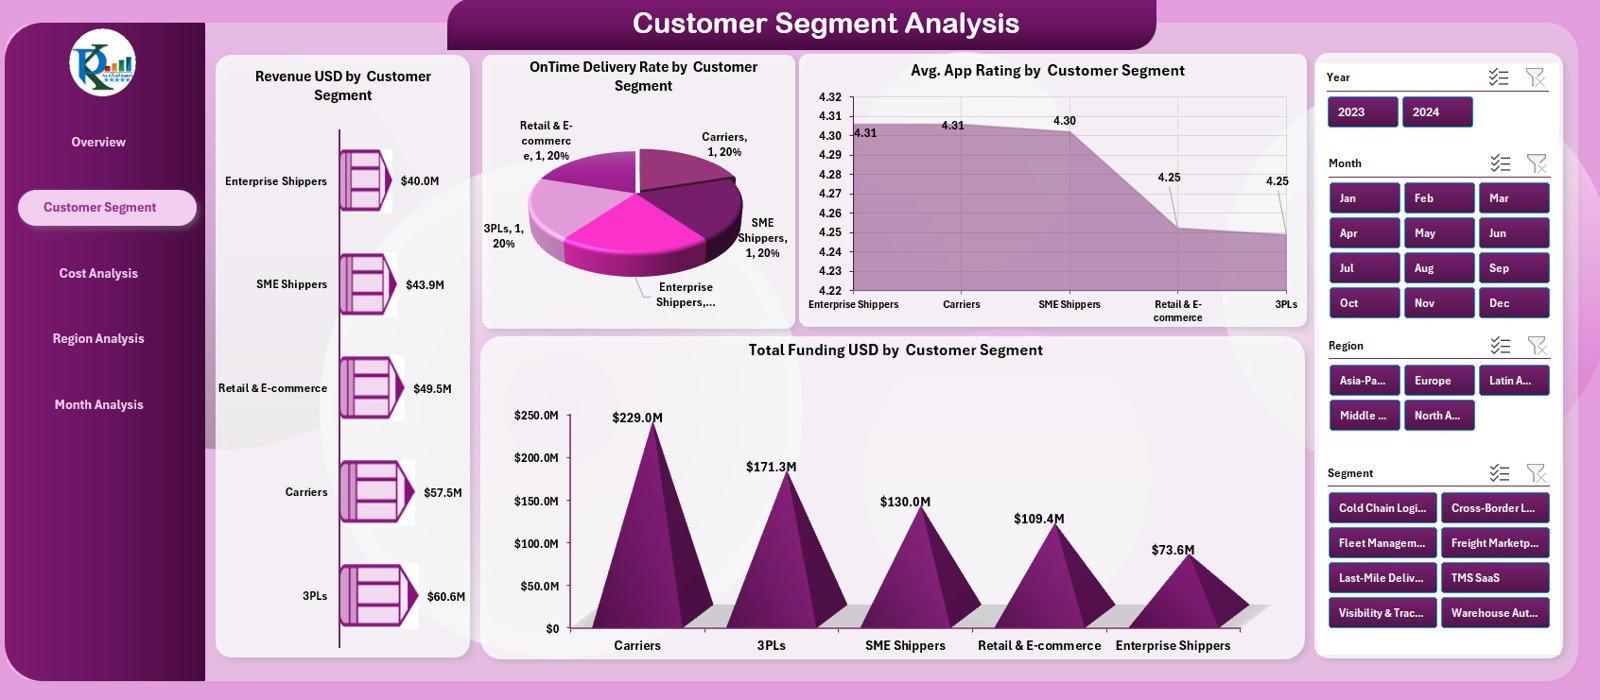
This page analyzes performance from the customer’s point of view. Slicers appear on the right side for flexible filtering.
Four Key Charts on This Page
1. Revenue (USD) by Customer Segment
Shows which customer groups bring the highest revenue.
2. On-Time Delivery Rate (%) by Customer Segment
Shows how well the startup delivers on schedule.
3. Average App Rating by Customer Segment
Helps you identify segments with low satisfaction.
4. Total Funding (USD) by Customer Segment
Shows funding distribution across segments.
This page helps decision-makers understand customer needs and improve service quality.
3. Cost Analysis – Control Business Expenses
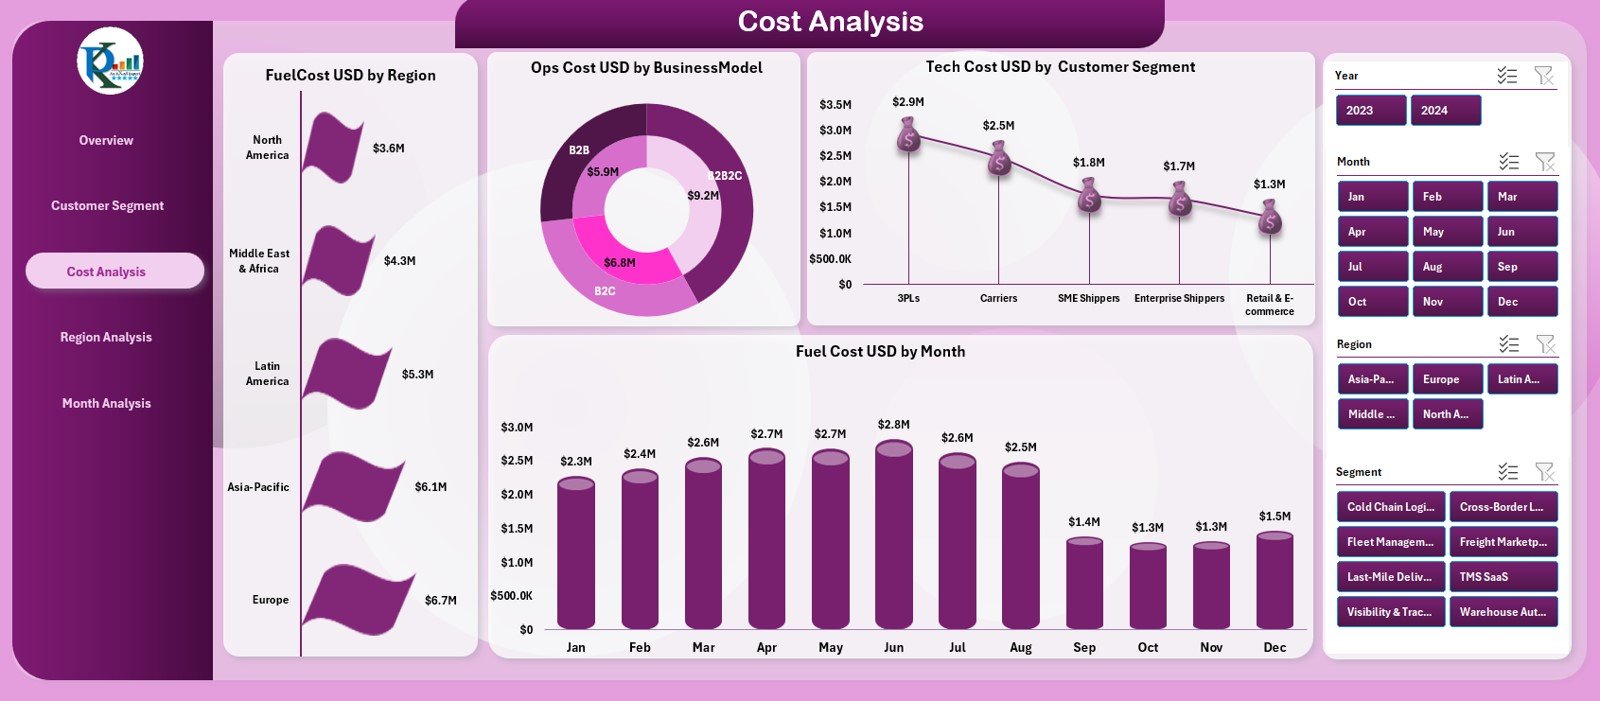
Cost is a major factor in every logistics startup. This page helps you analyze cost distribution across regions, models, and months.
Four Charts on This Page
1. Fuel Cost (USD) by Region
Shows which regions consume more fuel.
2. Ops Cost (USD) by Business Model
Displays operational cost distribution across business models.
3. Tech Cost (USD) by Customer Segment
Shows how much technology spending supports each segment.
4. Fuel Cost (USD) by Month
Helps you study monthly fuel cost patterns.
This page helps startup teams control expenses and manage profitability better.
Click to Purchases Logistics Tech Startups Dashboard in Excel
4. Region Analysis – Compare Regional Performance
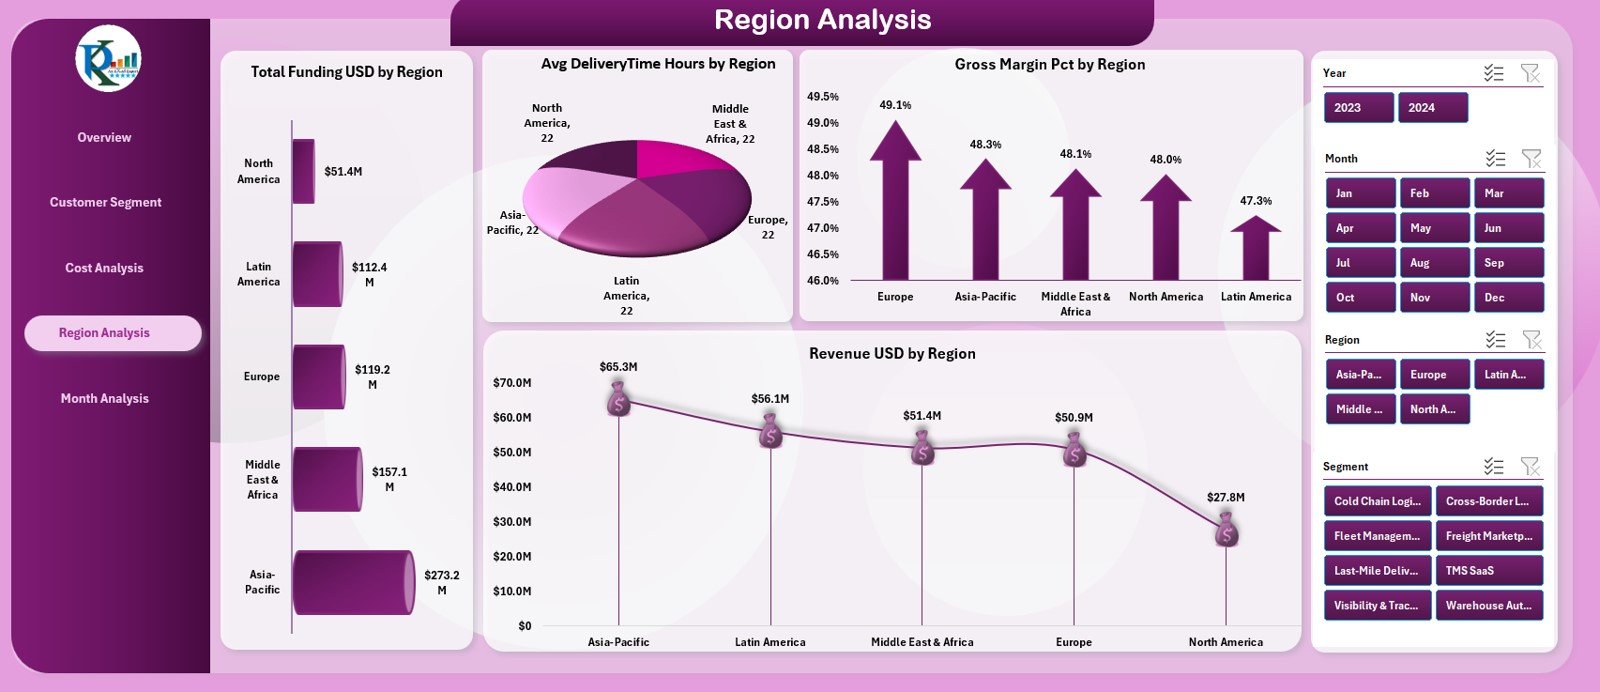
Different regions show different customer behaviors, cost structures, and business results. The Region Analysis page gives you a complete view of geographical performance.
Four Charts on This Page
1. Total Funding (USD) by Region
Shows funding received for each region.
2. Average Delivery Time (Hours) by Region
Highlights regions with slow delivery performance.
3. Gross Margin (%) by Region
Shows profitability region-wise.
4. Revenue (USD) by Region
Displays revenue contributions from each region.
Regional insights help startups grow in the right markets and improve performance in weaker ones.
5. Monthly Trends – Track Growth Over Time

Monthly analytics help you understand performance patterns. This page shows all trend-based KPIs.
Three Charts on This Page
1. Total Funding (USD) by Month
Shows month-wise funding inflow.
2. Average App Rating by Month
Helps you track customer satisfaction over time.
3. Revenue (USD) by Month
Shows month-wise revenue growth or decline.
This page is extremely helpful during investor meetings and financial reviews.
Support Sheets
Besides the dashboard pages, the file includes:
✔ Data Sheet
Stores source data used by all charts and KPIs.
✔ Support Sheet
Used for dropdowns, mapping tables, and backend calculations.
These sheets help maintain consistency and clean data flow.
Click to Purchases Logistics Tech Startups Dashboard in Excel
Advantages of Logistics Tech Startups Dashboard in Excel
Using this dashboard provides many strong benefits:
1. Fast and Clear Performance Tracking
You see all KPIs in one place and understand performance instantly.
2. Improves Decision-Making
You get accurate insights for funding, revenue, delivery, and app performance.
3. Helps Control Cost
The Cost Analysis page helps you track high-expense areas.
4. Better Customer Understanding
Segment-wise analysis helps you improve user satisfaction and delivery speed.
5. Easy to Customize
You can add more KPIs, charts, or segments as the startup grows.
6. Simple Excel Navigation
The Page Navigator helps any user access the dashboard without confusion.
7. Perfect for Startup Pitches
The dashboard looks professional and is useful in investor presentations.
Click to Purchases Logistics Tech Startups Dashboard in Excel
Best Practices for Using This Dashboard
To get maximum value, follow these best practices:
1. Update Data Frequently
Always enter the latest revenue, cost, and delivery data.
2. Keep Data Clean
Avoid merged cells, color formatting, and errors in the Data Sheet.
3. Compare Segments Regularly
Customer segments help you understand growth opportunities.
4. Track Monthly Trends Carefully
Trends reveal business momentum more clearly than daily numbers.
5. Use Slicers in Meetings
Slicers help present insights in a clear and interactive way.
6. Review Costs Every Month
Controlling tech, fuel, and operational costs can increase profitability.
7. Monitor Satisfaction Rating
Customer satisfaction plays a major role in long-term success.
Conclusion
A Logistics Tech Startups Dashboard in Excel gives founders and teams a powerful view of business performance. It brings funding, revenue, cost, delivery, satisfaction, and regional insights into one place. It also simplifies the review process by offering interactive visual analytics.
Whether you run a delivery startup, fleet platform, last-mile service, or logistics aggregator, this dashboard helps you take smarter decisions. It saves time, reduces reporting effort, and delivers insights that help startups grow faster and operate more efficiently.
With clean Excel sheets and structured analytics pages, this dashboard becomes an essential tool for every logistics tech business.
Click to Purchases Logistics Tech Startups Dashboard in Excel
Frequently Asked Questions (FAQs)
1. What is a Logistics Tech Startups Dashboard in Excel?
It is a ready-to-use Excel dashboard that tracks logistics startup KPIs such as funding, revenue, cost, delivery, and customer satisfaction.
2. Who can use this dashboard?
Founders, investors, analysts, delivery managers, and finance teams can use it.
3. How many pages does the dashboard have?
It has 5 pages: Overview, Customer Segment Analysis, Cost Analysis, Region Analysis, and Monthly Trends.
4. Can I customize the dashboard?
Yes. You can add more charts, KPIs, or sheets based on business needs.
5. Can beginners use this dashboard?
Yes. It uses simple Excel formulas and charts, so even beginners can use it easily.
6. Does it track monthly performance?
Yes. The Monthly Trends page shows revenue, rating, and funding trends.
7. Does it help with investor presentations?
Yes. The dashboard gives clear insights that investors want to see.
8. Can I add new regions or segments in the future?
Yes. You can update the Data Sheet and slicers to include new segments or regions.
Click to Purchases Logistics Tech Startups Dashboard in Excel
Visit our YouTube channel to learn step-by-step video tutorials