The fishing industry continues to grow because global demand for seafood increases every year. At the same time, fisheries face new challenges such as rising fuel prices, unpredictable marine conditions, strict compliance rules, and the need to improve sustainability. Therefore, managers, fleet owners, and government agencies look for tools that help them monitor operations, control costs, and protect fisheries resources.
A Fisheries Dashboard in Power BI solves these challenges with real-time insights. It brings all fishing-related data into one interactive platform. Users can explore catch performance, fuel efficiency, fishing methods, captain performance, fleet segment insights, maintenance costs, and monthly revenue trends. As a result, organizations make better decisions without depending on manual reports.
In this detailed guide, you will learn everything about the Fisheries Dashboard in Power BI. You will understand how it works, why teams need it, what each page includes, and how to use it effectively. You will also explore its advantages, best practices, and answers to common questions.
Click to Purchases Fisheries Dashboard in Power BI
What Is a Fisheries Dashboard in Power BI?
A Fisheries Dashboard in Power BI is an advanced but easy-to-use data visualization solution that helps fisheries track daily, monthly, and seasonal performance. It connects data from sources like fishing logs, fleet records, captain reports, maintenance sheets, and revenue files. Then, Power BI processes this information and presents it through intuitive charts, KPIs, slicers, and trend visuals.
The dashboard helps users understand:
-
Profit margin by fleet, zone, fishing method, or species
-
On-time log compliance
-
Maintenance and fuel costs
-
Revenue and cost distribution
-
Captain-wise performance
-
Monthly production and financial trends
Because the dashboard works in Power BI, teams update the data file and instantly see new insights. No coding knowledge is required. Moreover, Power BI allows smooth navigation between pages, making every performance detail easy to analyze.
Why Do Fisheries Need a Power BI Dashboard?
Fisheries operate with many variables. Boats move across zones, captains follow different techniques, fuel costs change often, and weather affects operations every day. Traditional spreadsheets cannot track these dynamic factors well.
Therefore, a Power BI dashboard becomes essential because:
-
It shows real-time performance.
-
It reduces errors from manual analysis.
-
It highlights cost leakages quickly.
-
It supports compliance and sustainability.
-
It makes complex data easy to understand.
When teams track everything in one dashboard, they make better decisions about catch plans, maintenance schedules, cost control strategies, and overall resource management.
Key Features of the Fisheries Dashboard in Power BI
The Fisheries Dashboard includes five insightful pages, each designed to help fisheries improve operational efficiency. Below is a breakdown of each page, along with the enhanced explanation of your already written information.
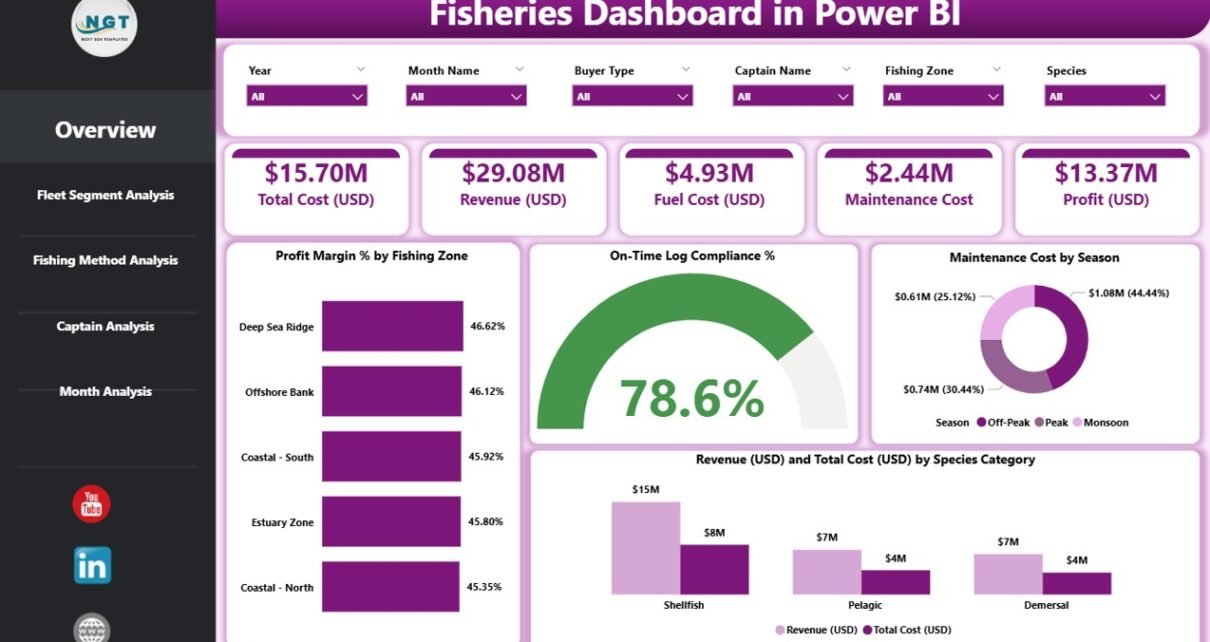
1. Overview Page – The Complete Operational Snapshot
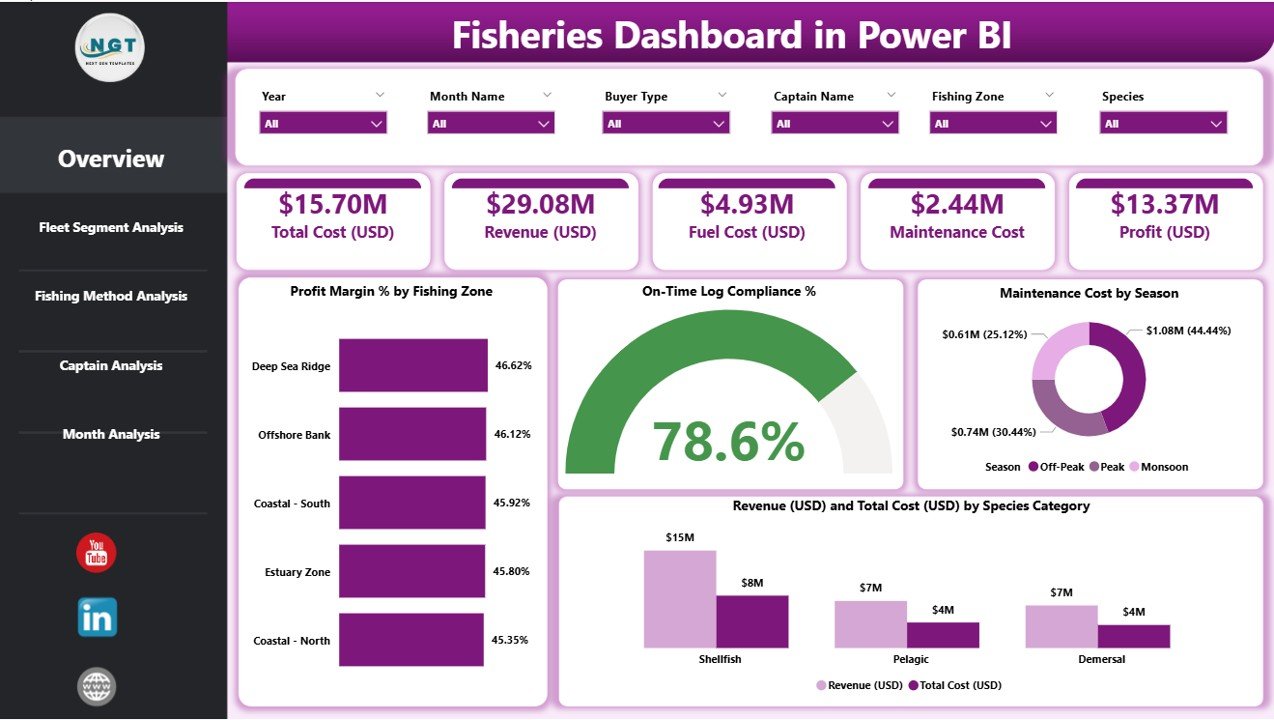
The Overview Page works as the main control center of the dashboard. It brings all crucial KPIs into one place so users understand the business health in a few seconds.
Key Elements on the Overview Page
Click to Purchases Fisheries Dashboard in Power BI
-
Slicers for Filters
Users filter results by month, fishing zone, fleet segment, species, and more. Because filters update every chart instantly, teams explore performance with ease. -
Four KPI Cards
These cards display essential performance indicators such as:-
Total Profit Margin %
-
On-Time Log Compliance %
-
Total Maintenance Cost
-
Total Revenue
-
-
Four Powerful Charts
These charts help decision-makers identify patterns quickly:-
Profit Margin % by Fishing Zone
-
On-Time Log Compliance %
-
Maintenance Cost by Season
-
Revenue and Total Cost by Species Category
-
Because the overview captures everything in one page, users understand how the fisheries perform without navigating through multiple reports.
2. Fleet Segment Analysis – Track Performance by Fleet Category
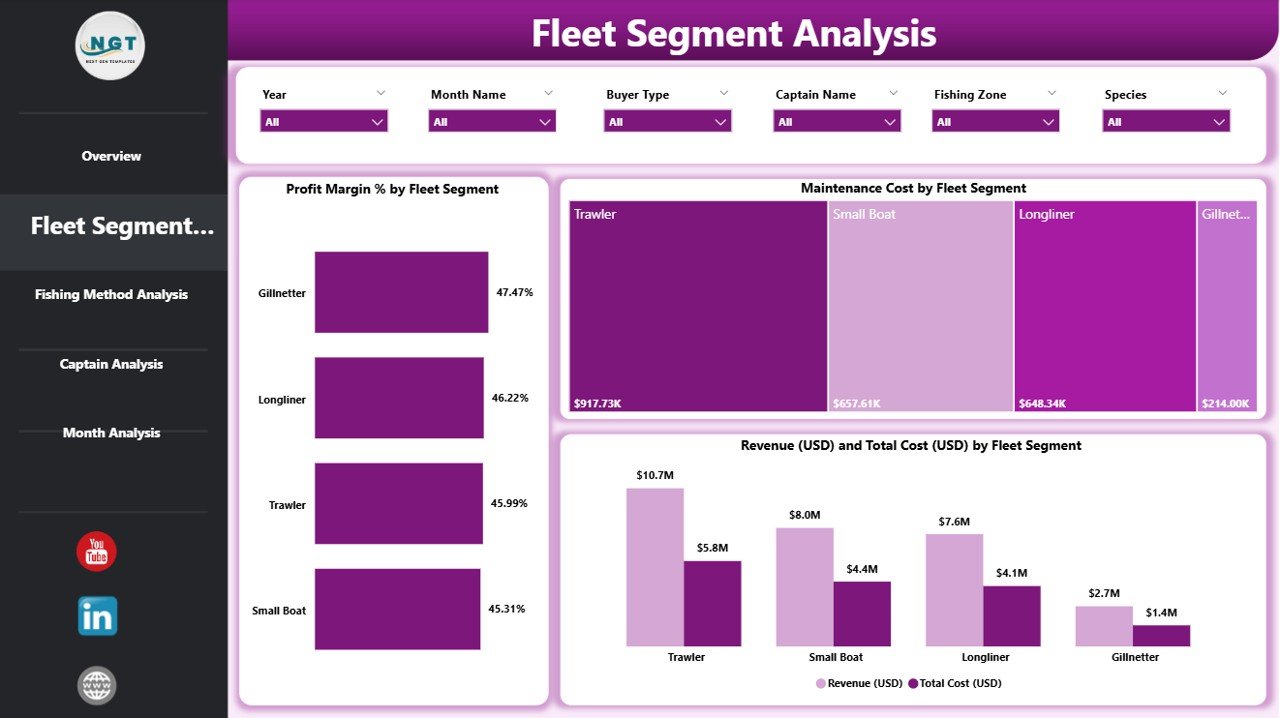
Different fleet segments operate differently. Some fleets catch high-value species, while others travel more and naturally consume more fuel. This page helps teams analyze these differences clearly.
Fleet Segment KPIs Include
-
Profit Margin % by Fleet Segment
-
Maintenance Cost by Fleet Segment
-
Revenue and Total Cost by Fleet Segment
The slicers on this page make it possible to compare seasons, years, and fishing zones for any specific fleet. Therefore, managers identify which fleets produce more profit and which fleets need operational improvement.
3. Fishing Method Analysis – Compare Efficiency and Profitability
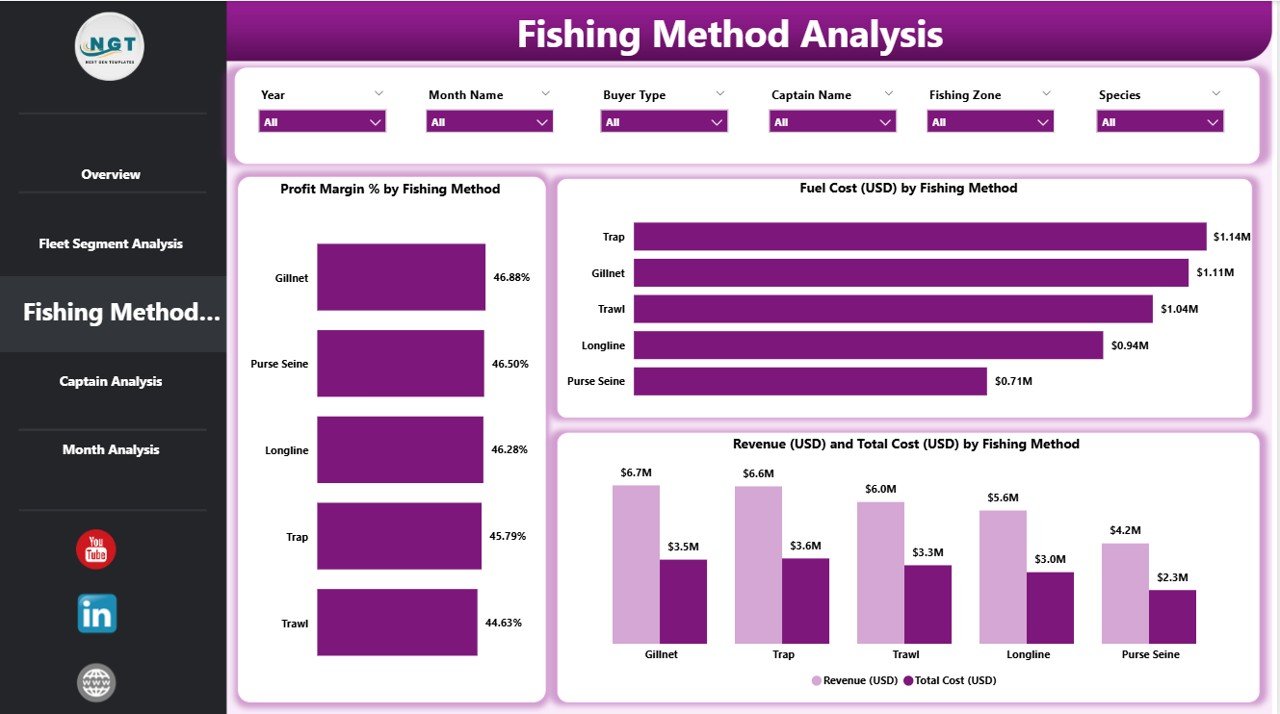
Fishing methods such as trawling, longlining, gillnetting, or purse seining produce different results. This page highlights those variations so teams optimize methods based on revenue and cost patterns.
Click to Purchases Fisheries Dashboard in Power BI
Charts on the Fishing Method Analysis Page
-
Profit Margin % by Fishing Method
-
Fuel Cost (USD) by Fishing Method
-
Revenue and Total Cost by Fishing Method
Since fuel represents one of the largest cost factors, this page becomes extremely important. Users quickly find out which technique delivers higher efficiency and better profit margins.
4. Captain Analysis – Evaluate Crew Leadership and Output
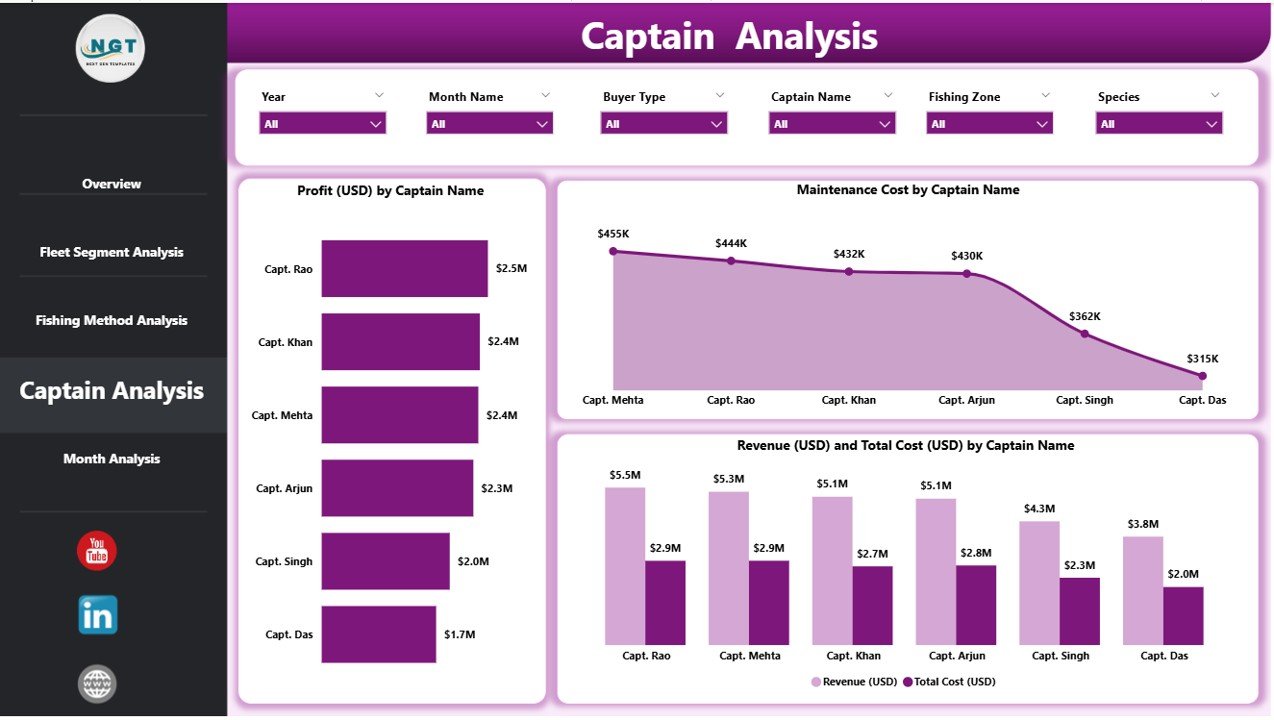
Captains play a major role in the success of fishing trips. Their judgment, methods, route planning, and safety practices impact revenue and costs directly. This page simplifies captain-wise performance evaluation.
What This Page Shows
-
Revenue by Captain
-
Total Cost by Captain
-
Profit Margin % by Captain
Users analyze captain performance and identify training needs, operational strengths, and improvement gaps. This builds a culture of accountability and skill development within the fleet.
5. Monthly Trends – Analyze Seasonality and Long-Term Patterns
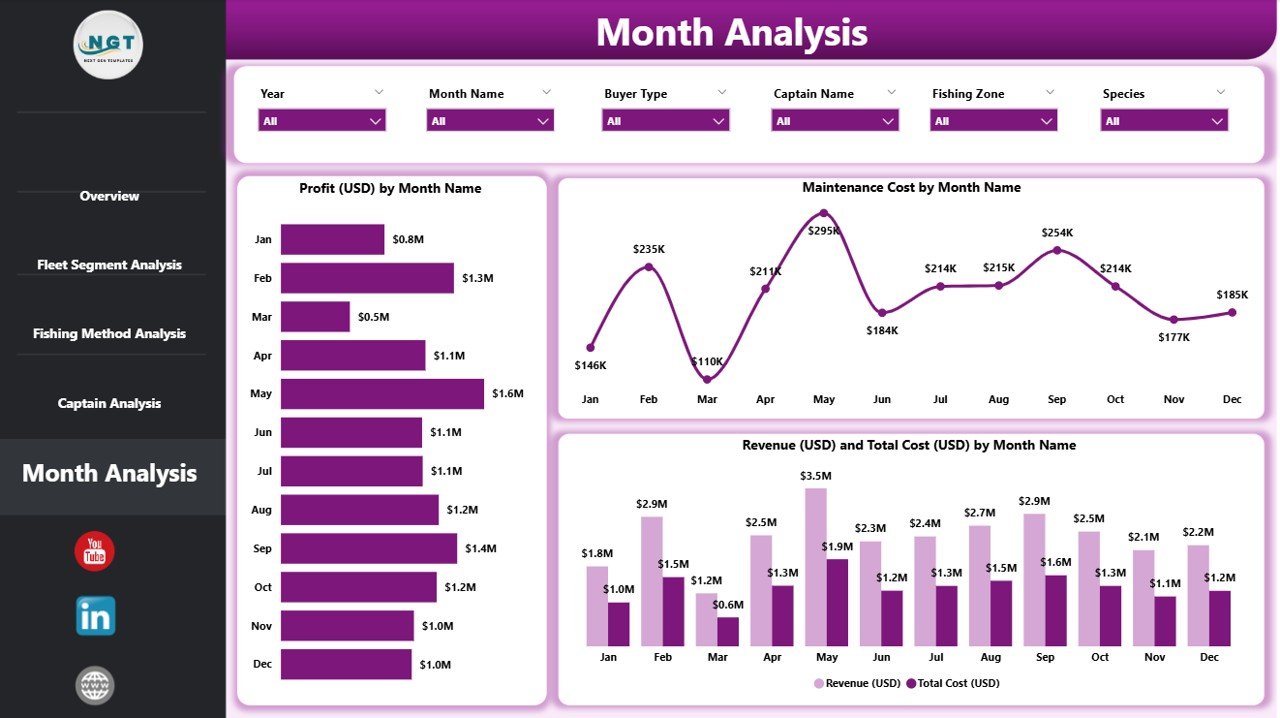
Fishing revenue and costs change every month due to season, weather, fuel price, and fishing restrictions. The Monthly Trends page helps teams understand all these patterns with time-based charts.
Charts Included
-
Profit (USD) by Month
-
Maintenance Cost by Month
-
Revenue and Total Cost by Month
These visuals reveal whether performance improves, declines, or remains stable. Businesses use this information for budget planning, maintenance scheduling, and forecasting production.
How Does a Fisheries Dashboard Improve Decision-Making?
A Power BI fisheries dashboard helps teams move from guesswork to strategic analysis. When all the numbers stay organized in one place, organizations react faster and solve challenges early.
Major Benefits Include
-
Faster financial insights
-
Stronger compliance management
-
Improved fleet utilization
-
Accurate planning of catch and supply
-
Reduced operational cost
-
Better captain performance tracking
-
Higher profitability due to informed decisions
Because Power BI updates instantly, every decision stays data-driven.
Advantages of a Fisheries Dashboard in Power BI
The Fisheries Dashboard delivers major advantages for industry professionals. Below are some of the most important ones:
1. Real-Time Visibility Across Operations
Teams see what happens across fishing zones, fleets, methods, and captains in real time. This helps them react before issues grow.
2. Improved Profitability Tracking
Since the dashboard highlights revenue, cost, and profit trends, managers identify profitable fleets, species categories, and seasons.
3. Better Fleet and Resource Optimization
The dashboard shows how each fleet segment performs. Teams shift resources to high-performing fleets and reduce costs where needed.
4. Enhanced Compliance and Reporting
With On-Time Log Compliance % visuals, managers reduce penalties and meet regulatory requirements with ease.
5. Clear Monthly and Seasonal Insights
Because monthly visuals show trends clearly, businesses plan fishing cycles and maintenance schedules correctly.
6. Stronger Decision-Making With Clean and Simple Charts
Power BI creates simple visuals that guide users toward the right decisions effortlessly.
Best Practices for Using the Fisheries Dashboard in Power BI
Click to Purchases Fisheries Dashboard in Power BI
To get the best results, fisheries should follow certain practices. These practices help maintain accuracy, transparency, and usability throughout the reporting process.
1. Update Data Files Regularly
You should update catch logs, cost sheets, and fleet reports frequently. Monthly or weekly updates keep the dashboard relevant.
2. Define Clear KPI Formulas
Because KPIs drive decisions, teams must agree on standard formulas for profit margin, fuel efficiency, compliance rate, and more.
3. Use Slicers Consistently
Always filter data by month, zone, species, or fleet when making comparisons. This ensures every decision uses consistent inputs.
4. Review Monthly Trends Before Budget Planning
The monthly trends section helps forecast expenses. Always review profit, revenue, and cost trends before finalizing budgets.
5. Train Users on Dashboard Navigation
Even though Power BI is easy to use, a short training session helps users explore insights more confidently.
6. Track Captain and Fleet Performance Together
Instead of analyzing captains separately, compare them with fleet activity. This reveals stronger and weaker combinations.
7. Look for Seasonal Patterns
Always review maintenance and revenue charts by season. This helps improve planning for weather-sensitive fishing cycles.
How to Use the Fisheries Dashboard Effectively?
You can follow these practical steps to extract the maximum value from the dashboard:
-
Start with the Overview Page for quick business health.
-
Explore Fleet Segment Analysis to find operational strengths.
-
Compare Fishing Methods to optimize fuel and cost efficiency.
-
Review Captain Analysis to improve leadership performance.
-
Study Monthly Trends to plan future activities.
Because each page connects with the others, users understand the entire fisheries lifecycle in one workflow.
Conclusion
The Fisheries Dashboard in Power BI empowers fisheries with clear insights, simple visuals, and data-driven decision-making. It brings together operational data from multiple sources and presents it in a format that teams understand instantly. As a result, businesses improve profit margins, reduce fuel and maintenance costs, enhance compliance, and streamline fleet operations.
This dashboard is not only a reporting tool but also a complete performance management system. From fleet analysis to monthly trends, every section provides valuable information that supports long-term planning and sustainable fisheries operations.
With the growing demand for efficient marine resource management, organizations that use Power BI dashboards stay ahead of competition and operate with stronger accuracy and efficiency.
Frequently Asked Questions (FAQs)
1. What is a Fisheries Dashboard in Power BI?
It is an interactive visual reporting tool that helps fisheries monitor revenue, cost, profit margin, fishing methods, fleet segments, and captain performance in real time.
2. Why should fisheries use Power BI for reporting?
Power BI provides fast, accurate, and interactive dashboards. It transforms complex data into simple insights and reduces manual reporting effort.
3. Can I track fuel costs and maintenance in this dashboard?
Yes. The dashboard includes charts for fuel cost, maintenance cost, and total operational cost by fleet, method, and season.
4. Is this dashboard useful for large fleets?
Yes. It works for both small and large fishing fleets because Power BI handles large datasets smoothly.
5. Can we compare different fishing methods using this dashboard?
Absolutely. The Fishing Method Analysis page shows profit margin, revenue, cost, and fuel consumption for each method.
6. How often should users update the data?
Weekly or monthly updates give the most accurate visibility of performance and trends.
7. Do users need technical skills to operate the dashboard?
No. The dashboard uses simple slicers, cards, and charts. Anyone can use it with minimal training.
8. Does the dashboard support seasonal analysis?
Yes. The Maintenance and Monthly Trends charts clearly show seasonal variations.
Visit our YouTube channel to learn step-by-step video tutorials
Click to Purchases Fisheries Dashboard in Power BI