The fashion e-commerce industry grows every day, and competition becomes stronger with every new trend. Customers expect fast delivery, accurate recommendations, transparent pricing, attractive discounts, and an enjoyable online shopping experience. Because of this, brands must track performance without delays. A Fashion E-commerce Dashboard in Power BI helps managers achieve this with complete clarity.
In this guide, you will learn how the dashboard works, what each page offers, and how fashion e-commerce companies can use it to improve sales, customer satisfaction, brand performance, and revenue. This article also includes advantages, best practices, and FAQs to help you use the dashboard effectively.
Click to Purchases Fashion E-commerce Dashboard in Power BI
What Is a Fashion E-commerce Dashboard in Power BI?
A Fashion E-commerce Dashboard in Power BI is a ready-to-use analytics solution that helps online fashion brands track orders, profit, discounts, customer satisfaction, delivery performance, and regional trends. Because Power BI updates visuals automatically, users get real-time insights about the entire business.
The dashboard contains five pages, and each page focuses on an important part of fashion e-commerce operations. With slicers, charts, cards, and interactive visuals, brands can review performance with just a few clicks.
Key Features of the Fashion E-commerce Dashboard in Power BI
Below are the features of all five pages of the dashboard. Each page plays a unique role in helping e-commerce teams understand their business performance better.
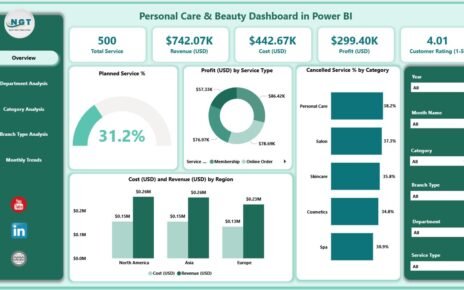
1. Overview Page – Your Complete Business Snapshot
The Overview Page acts as the main summary page. It contains important slicers and cards that highlight the most important KPIs.
Top KPI Cards Include:
-
Order Value (USD)
-
Profit (USD)
-
Discount Amount
-
Profit Margin %
-
Average Satisfaction Rating
These KPIs give an instant understanding of overall business health.
Charts on the Overview Page
The page includes five powerful charts:
-
Average Satisfaction Rating
-
Delivered Order % by Gender
-
Delivered Order %
-
Order Value (USD) by Brand Name
-
Profit (USD) by Delivery Status
These visuals help users see which customer segments perform well and which delivery types contribute most to revenue.
Click to Purchases Fashion E-commerce Dashboard in Power BI
2. Brand Name Analysis – Understanding Brand Performance
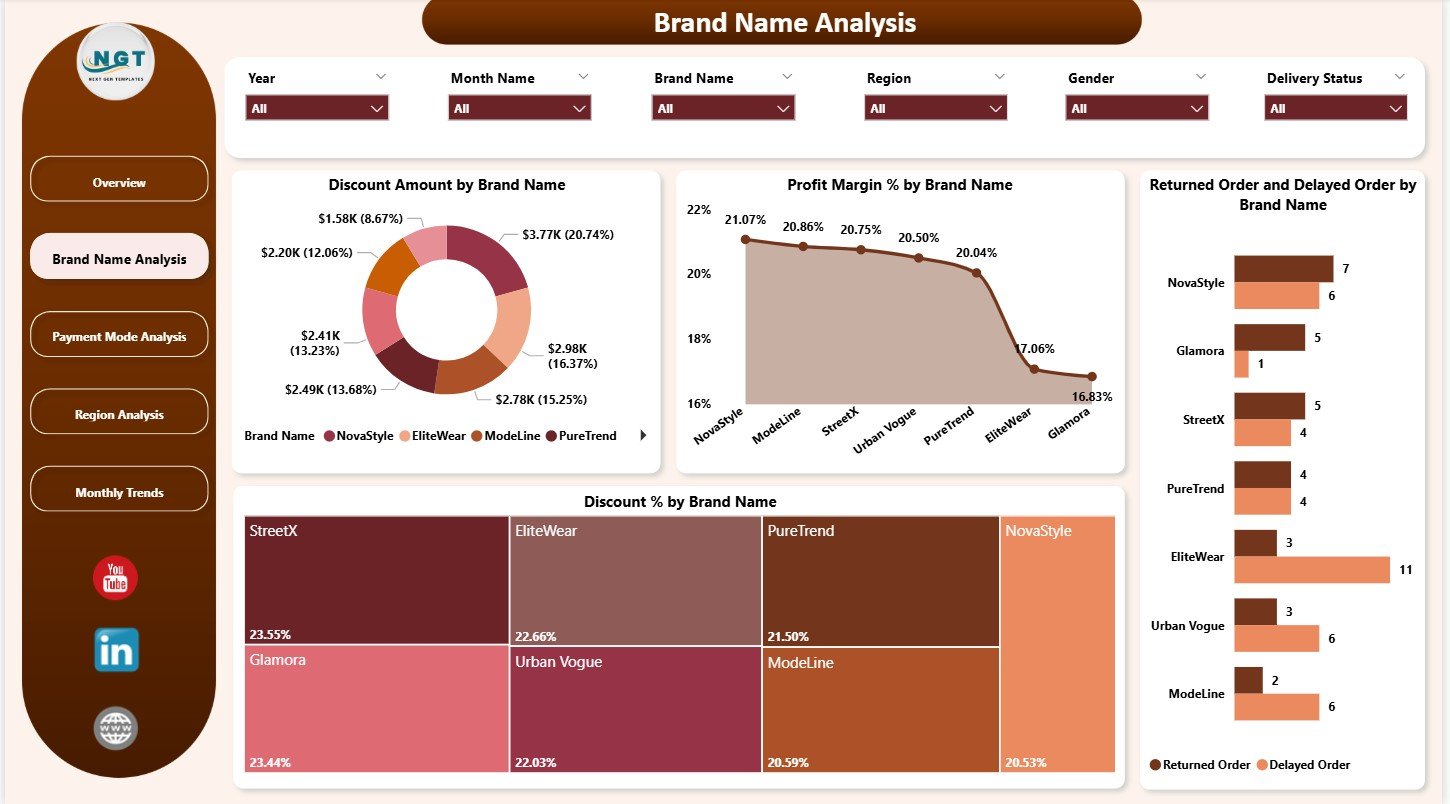
This page focuses on the performance of fashion brands listed on the platform. It helps managers identify strong brands and brands that need attention.
Charts on the Brand Name Analysis Page
-
Discount Amount by Brand Name
-
Profit Margin % by Brand Name
-
Returned Order and Delayed Order % by Brand Name
-
Discount % by Brand Name
Because fashion brands rely heavily on discounts and offers, understanding how discounts impact profit becomes essential. This page helps teams compare brands and take data-driven decisions.
3. Payment Mode Analysis – How Do Customers Choose to Pay?
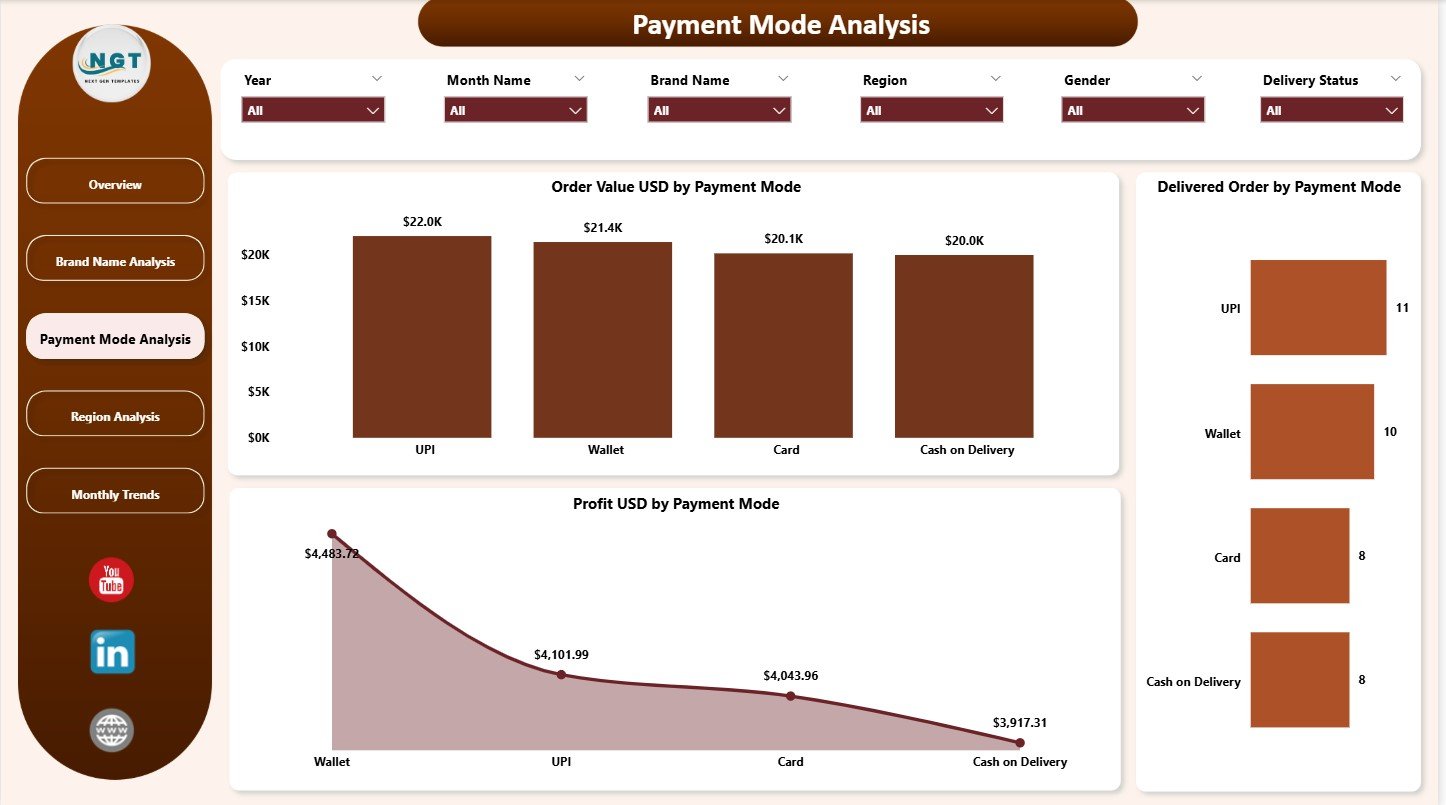
This page helps users understand how customers pay for their orders. Successful e-commerce companies track payment patterns because payment preferences affect conversion rate, trust, and operational workflow.
Charts on the Payment Mode Analysis Page
-
Order Value (USD) by Payment Mode
-
Delivered Orders by Payment Mode
-
Profit (USD) by Payment Mode
With these charts, businesses can check if customers prefer:
-
Credit/debit cards
-
Cash on delivery
-
Wallet payments
-
UPI
-
Buy Now Pay Later options
This insight helps optimize payment gateway strategies.
4. Region Analysis – Understanding Location-Based Performance
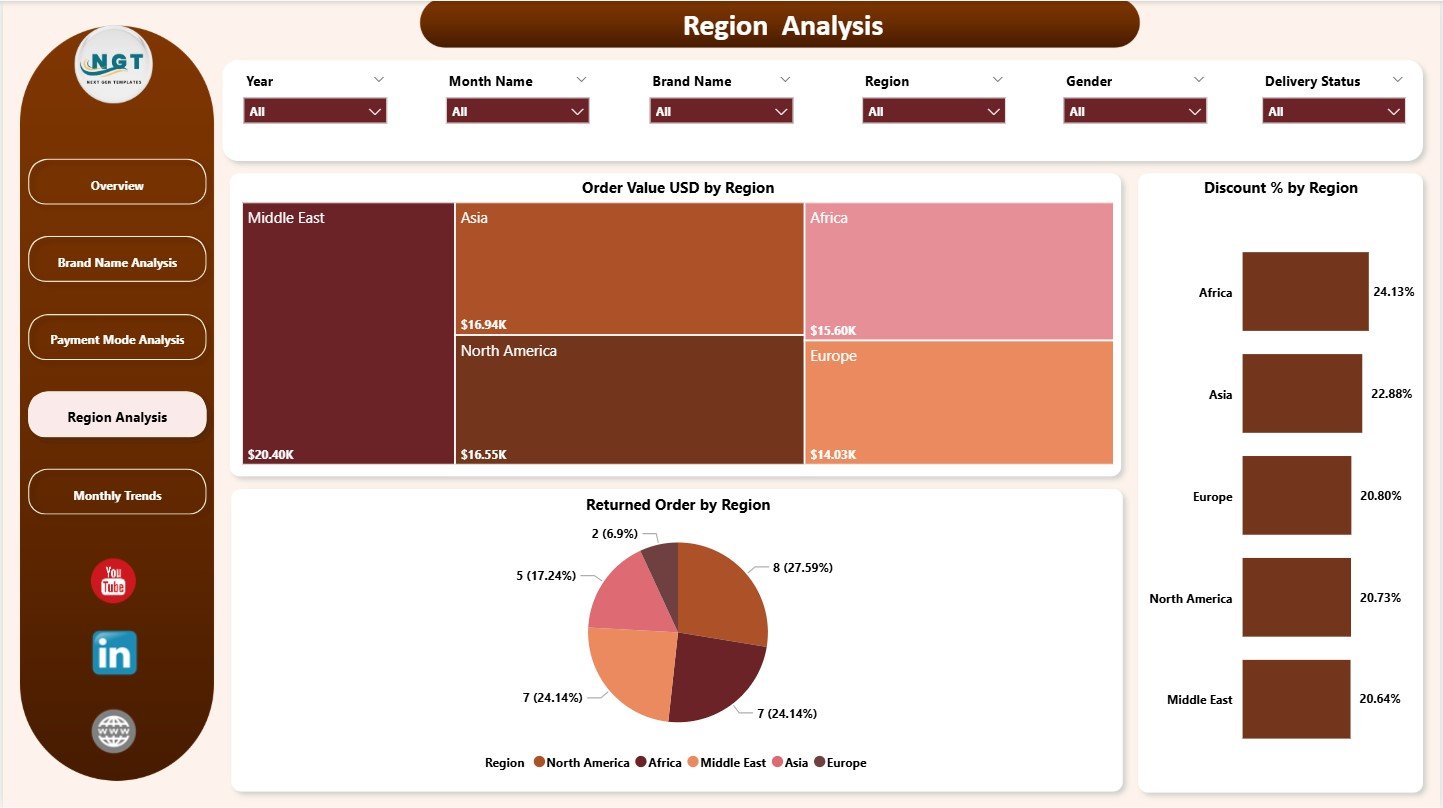
Geographical trends play a huge role in fashion e-commerce. Some locations buy more. Some locations return more. Some locations prefer heavy discounts. That is why the Region Analysis Page provides deep insights.
Charts on Region Analysis Page
-
Order Value (USD) by Region
-
Discount Amount by Region
-
Returned Orders by Region
This page helps identify:
-
High-performing regions
-
Regions with declining interest
-
Regions with high return rates
-
Regions that respond well to discount campaigns
With this knowledge, teams can plan targeted marketing and optimize delivery operations.
Click to Purchases Fashion E-commerce Dashboard in Power BI
5. Monthly Trends – Tracking Growth Month by Month
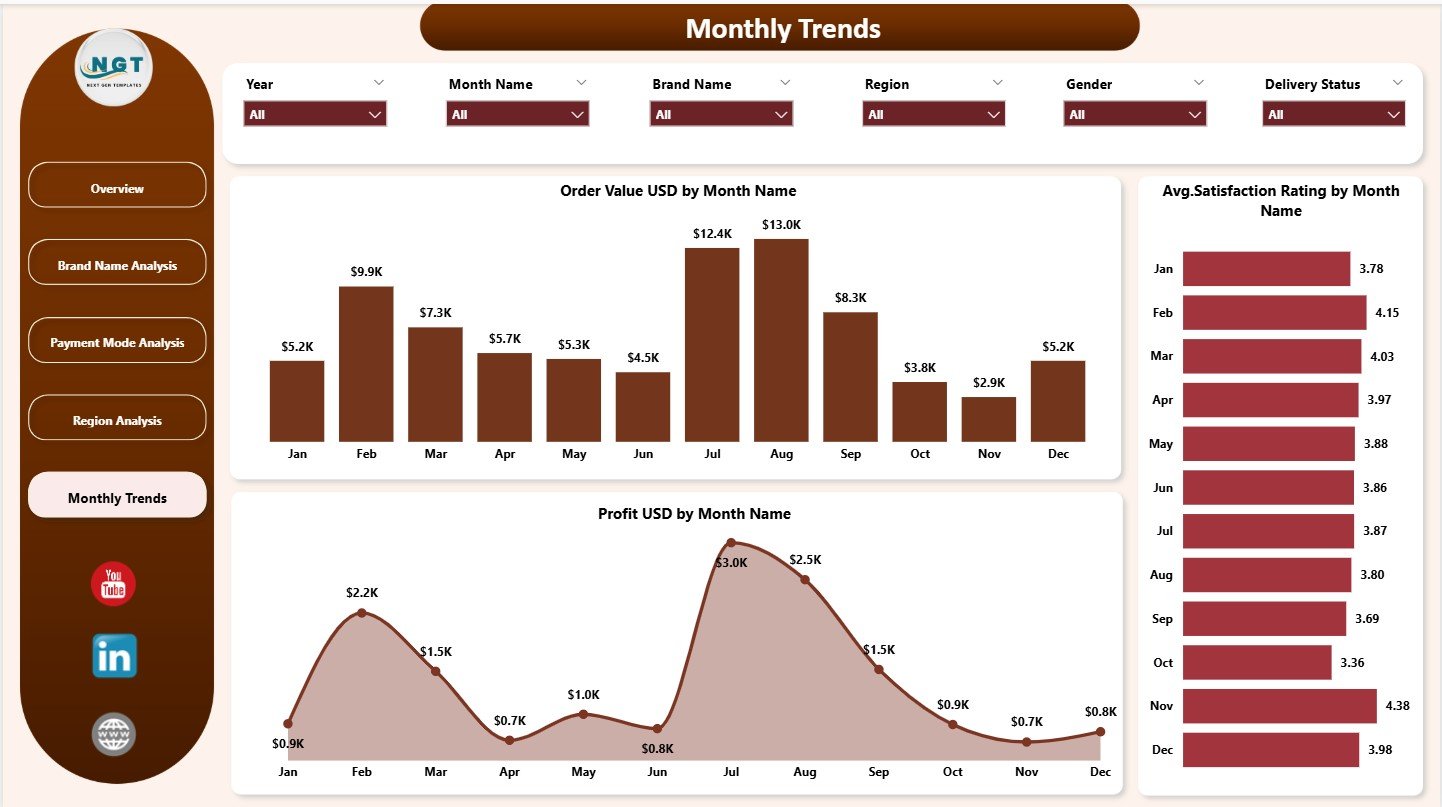
This page helps managers review long-term performance. Fashion e-commerce often works on seasonal cycles, so month-wise data becomes very important.
Charts on Monthly Trends Page
-
Order Value (USD) by Month
-
Average Satisfaction Rating by Month
-
Profit (USD) by Month
These visuals show:
-
Whether sales increase during festive months
-
If customer satisfaction improves or declines
-
How profit changes across the year
Monthly trends support forecasting, planning, budgeting, and strategy development.
Click to Purchases Fashion E-commerce Dashboard in Power BI
Why Do Fashion E-commerce Companies Need a Power BI Dashboard?
Fashion e-commerce leaders need accurate answers every day:
-
Which brand performs the best?
-
Which region buys more?
-
How much discount drives sales?
-
Why do returns increase recently?
-
Which customer group stays more loyal?
-
What payment modes increase revenue?
Without a dashboard, teams rely on manual reporting, scattered data, and slow decision-making. A Power BI dashboard solves these problems through smart visuals and automated analytics.
Advantages of Using the Fashion E-commerce Dashboard in Power BI
Using this dashboard gives many advantages for e-commerce teams. Here are the most important ones:
1. Real-Time Performance Tracking
Users get instant insights on sales, profit, discounts, and customer satisfaction. Decisions become faster and more accurate.
2. Better Understanding of Customer Behavior
Charts show what customers prefer in terms of:
-
Payment modes
-
Delivery expectations
-
Discounts
-
Brands
-
Regions
This helps brands understand customer needs better.
3. Clear Comparison of Brand Performance
Brand managers can compare profit, returns, discount usage, and delivery delays. This supports stronger brand partnerships.
4. Improved Profitability
The dashboard highlights where profit increases and where it decreases. Teams can adjust campaigns and pricing strategies accordingly.
5. Stronger Decision-Making for Marketing Teams
Monthly trends help teams choose the best time for campaigns, influencer partnerships, and new product launches.
6. Faster Reporting and Less Manual Work
Power BI eliminates manual Excel reporting. Charts update automatically, saving hours every month.
Click to Purchases Fashion E-commerce Dashboard in Power BI
Best Practices for Using the Fashion E-commerce Dashboard in Power BI
To get maximum value from this dashboard, follow these practical best practices:
1. Update Data Consistently
Make sure your sales, profit, return, and discount data remain updated. Reliable data equals reliable insights.
2. Use Filters Properly
Use slicers on every page to find deeper insights. Filter by gender, region, brand, or payment mode to identify hidden patterns.
3. Track Trends Monthly
Fashion trends change fast. Monthly trend tracking helps teams stay prepared.
4. Focus on Customer Satisfaction
The Avg. Satisfaction Rating chart reveals important behavior. Analyze dips immediately to improve service quality.
5. Watch Regional Return Rates
Returned orders affect costs. Identify high-return regions and improve delivery quality or product presentation.
6. Strengthen Brand Negotiations
Brand-level KPI charts help teams negotiate discounts, order volumes, and partnerships with clear data.
Conclusion
The Fashion E-commerce Dashboard in Power BI gives fashion brands complete control over their performance. It displays order values, customer satisfaction, profit, discounts, and brand-level insights in a clear and simple format. With five powerful pages—Overview, Brand Name Analysis, Payment Mode Analysis, Region Analysis, and Monthly Trends—teams can analyze every angle of their business.
Because the dashboard updates automatically, it saves time, improves decision-making, and boosts profitability. Fashion companies that want to understand customers, optimize operations, and grow faster benefit the most from this dashboard.
Click to Purchases Fashion E-commerce Dashboard in Power BI
Frequently Asked Questions (FAQs)
1. Who can use this dashboard?
E-commerce managers, brand partners, financial teams, customer service leaders, and marketing teams use it.
2. Is the dashboard beginner-friendly?
Yes. Power BI visuals make it simple even for non-technical users.
3. Can I customize the dashboard?
Yes. You can add new charts, KPIs, brands, regions, or customer categories.
4. How often should I update the data?
Daily or weekly updates give the best insights.
5. Does it support seasonal trend analysis?
Yes. The Monthly Trends page shows clear patterns across the year.
Click to Purchases Fashion E-commerce Dashboard in Power BI
Visit our YouTube channel to learn step-by-step video tutorials