Vendor relationships play a critical role in business success. Every organization depends on vendors for quality, cost control, delivery timelines, and service stability. However, many teams still track vendor performance using scattered spreadsheets and manual reports. Because of this, issues remain hidden, trends stay unnoticed, and corrective actions get delayed.
A Vendor Management KPI Dashboard in Power BI solves this challenge completely. It converts vendor data into meaningful insights using interactive visuals, performance indicators, and trend analysis. Moreover, it allows procurement teams, supply-chain leaders, and finance managers to monitor vendor performance with clarity and confidence.
In this comprehensive guide, you will learn what a Vendor Management KPI Dashboard in Power BI is, how it works, what pages it includes, how Excel supports the data model, and why this dashboard has become essential for modern vendor management.
Click to Purchases Vendor Management KPI Dashboard in Power BI
What Is a Vendor Management KPI Dashboard in Power BI?
A Vendor Management KPI Dashboard in Power BI is a ready-to-use analytical solution that helps organizations monitor, evaluate, and improve vendor performance. It pulls structured data from Excel files and displays it in dynamic Power BI visuals.
Instead of checking multiple reports, users see all vendor KPIs in one place. As a result, teams track targets, identify performance gaps, and compare vendor results over time.
Power BI adds strong visualization capabilities, while Excel keeps data entry simple. Together, they create a flexible and powerful vendor analytics solution.
Why Is Vendor Management Analytics Important?
Vendor performance directly affects cost, quality, compliance, and customer satisfaction. Still, many organizations manage vendors reactively rather than proactively.
Vendor analytics helps organizations:
-
Track vendor KPIs in real time
-
Compare actual performance with targets
-
Detect delivery or quality issues early
-
Monitor vendor improvement trends
-
Strengthen vendor accountability
Because analytics brings transparency, decision-makers act faster and smarter.
What Are the Key Features of the Vendor Management KPI Dashboard in Power BI?
This dashboard includes three dedicated pages, each designed to answer a specific vendor management question. Together, they provide a complete vendor performance view.
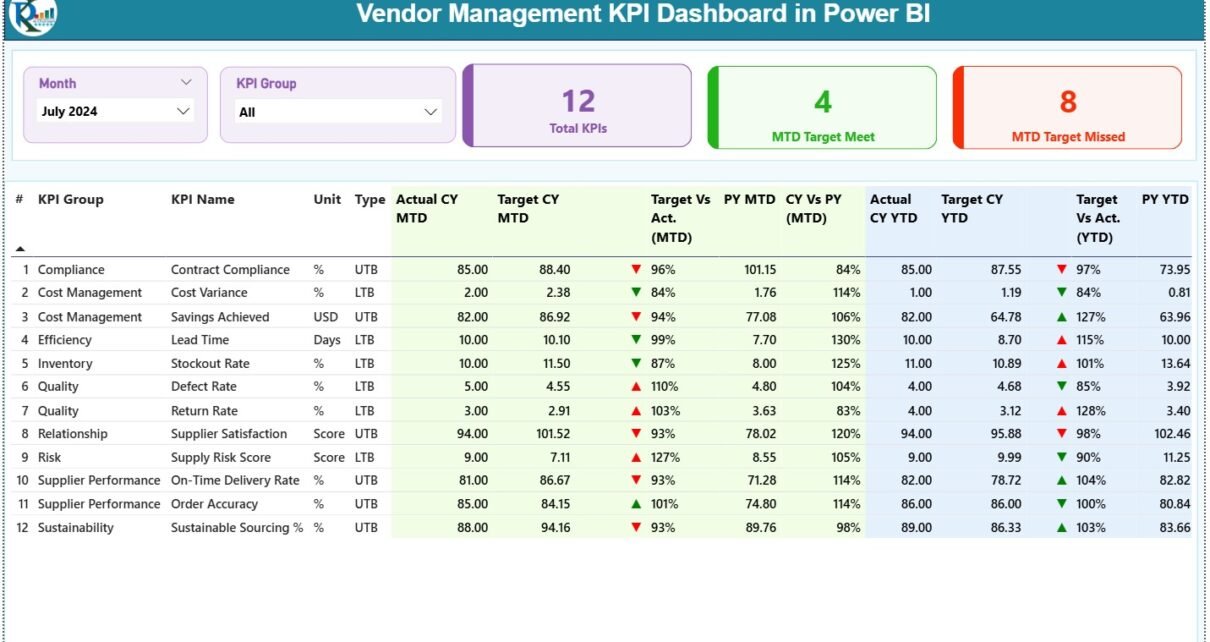
1.Summary Page
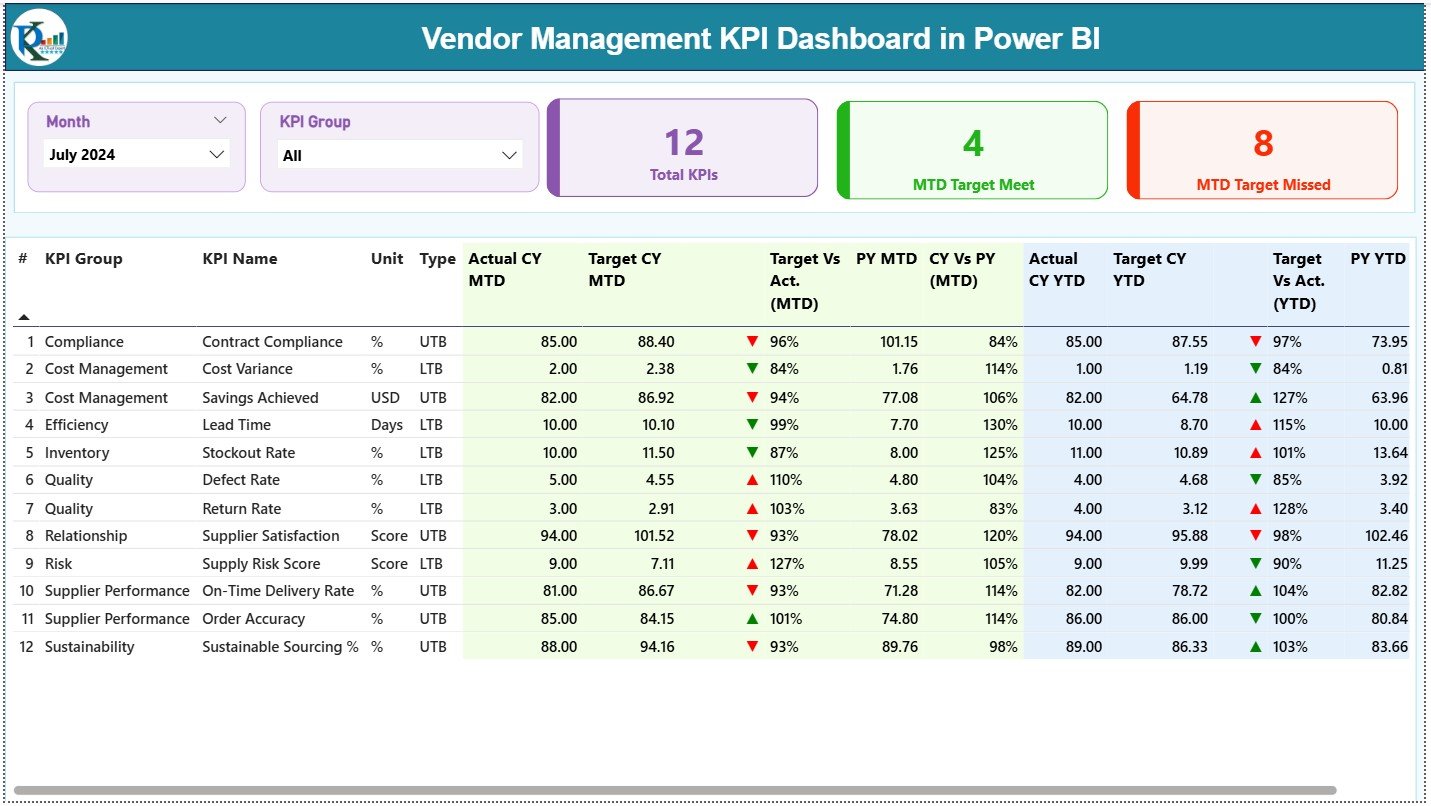
The Summary Page acts as the main dashboard page. It provides a high-level overview of all vendor KPIs while allowing users to drill deeper when needed.
How Do the Slicers Improve Vendor Analysis?
At the top of the Summary Page, the dashboard displays two slicers:
-
Month slicer to analyze vendor performance month-wise
-
KPI Group slicer to filter vendor KPIs by category
Because slicers update all visuals instantly, users explore data effortlessly.
Which KPI Cards Appear on the Summary Page?
The Summary Page includes three prominent KPI cards:
-
Total KPIs Count – Displays the total number of vendor KPIs
-
MTD Target Met Count – Shows how many KPIs meet monthly vendor targets
-
MTD Target Missed Count – Highlights KPIs that fail to meet expectations
These cards give instant insight into vendor health.
What Information Does the Vendor KPI Detailed Table Contain?
Below the KPI cards, the dashboard presents a detailed KPI table. This table explains vendor performance clearly and logically.
Each column serves a distinct purpose:
-
KPI Number – Displays the sequence number
-
KPI Group – Shows vendor KPI category
-
KPI Name – Identifies the vendor performance metric
-
Unit – Defines the measurement unit
-
Type (LTB or UTB) – Indicates whether lower or higher values represent better performance
How Does Month-to-Date (MTD) Vendor Tracking Work?
The dashboard tracks current performance using MTD values, which helps teams act quickly.
MTD columns include:
-
Actual CY MTD – Current year actual vendor performance
-
Target CY MTD – Defined vendor target
-
MTD Icon – Green ▲ or red ▼ icons showing target achievement
-
Target vs Actual (MTD) – Actual ÷ Target performance ratio
-
PY MTD – Previous year MTD performance
-
CY vs PY (MTD) – Year-over-year MTD growth or decline
Through this layout, users spot vendor issues immediately.
How Does Year-to-Date (YTD) Vendor Tracking Work?
For long-term analysis, the dashboard captures YTD values:
-
Actual CY YTD – Current year cumulative vendor performance
-
Target CY YTD – Current year cumulative target
-
YTD Icon – Visual indicator of performance
-
Target vs Actual (YTD) – Cumulative performance ratio
-
PY YTD – Previous year cumulative performance
-
CY vs PY (YTD) – Year-over-year YTD comparison
This combination ensures both short-term and strategic visibility.
Click to Purchases Vendor Management KPI Dashboard in Power BI
2. KPI Trend Page
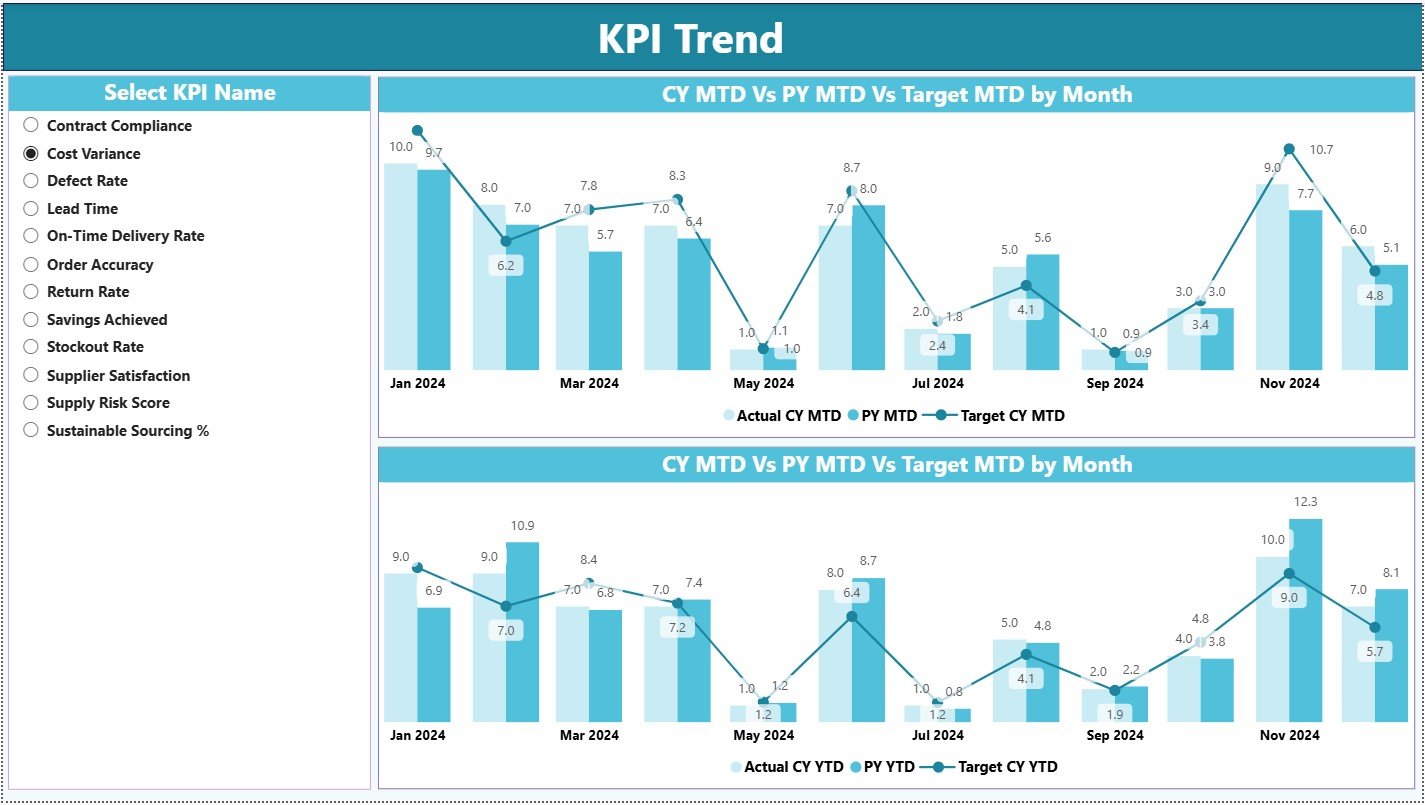
The KPI Trend Page focuses on time-based performance analysis.
How Does KPI Selection Improve Trend Analysis?
A slicer on the left allows users to choose a specific vendor KPI. Once selected, all charts update instantly.
This feature helps teams analyze one vendor metric at a time without distractions.
Which Charts Appear on the KPI Trend Page?
The page displays two combo charts:
-
MTD Trend Chart – Shows current year actuals, previous year actuals, and targets
-
YTD Trend Chart – Displays cumulative performance trends
These visuals help teams:
-
Identify seasonal vendor behavior
-
Track improvement efforts
-
Compare performance against targets
Because trends tell a story, users understand performance patterns easily.
Click to Purchases Vendor Management KPI Dashboard in Power BI
3. KPI Definition Page
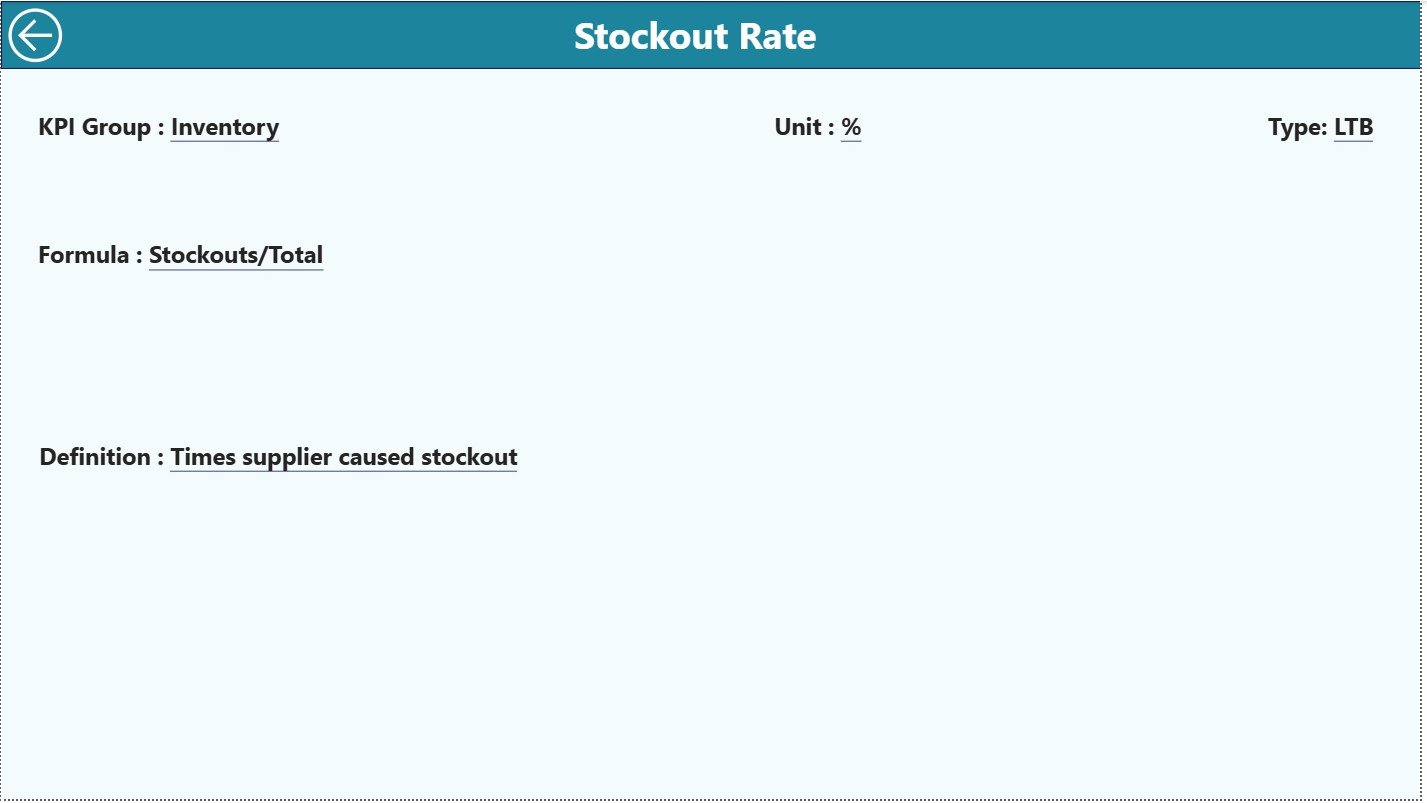
The KPI Definition Page adds transparency and removes confusion around metrics.
How Does Drill-Through Work on the KPI Definition Page?
This page works as a hidden drill-through page. Users access it by right-clicking from the Summary Page.
Here, users can review:
-
KPI Formula
-
KPI Definition
-
Measurement logic
This approach ensures everyone interprets vendor KPIs correctly.
How Do Users Return to the Main Dashboard?
A back button on the top-left corner lets users return quickly to the Summary Page, ensuring smooth navigation.
How Does Excel Power the Vendor Management Dashboard?
This dashboard uses Excel as its data source, which keeps data management flexible and user-friendly.
What Goes into the Input_Actual Sheet?
In the Input_Actual sheet, users enter:
-
KPI Name
-
Month (first date of the month)
-
MTD actual values
-
YTD actual values
Consistent monthly updates keep analytics accurate.
What Goes into the Input_Target Sheet?
The Input_Target sheet stores vendor targets:
-
KPI Name
-
Month (first date of the month)
-
MTD target values
-
YTD target values
Separating targets from actuals improves transparency.
What Does the KPI Definition Sheet Contain?
The KPI Definition sheet includes:
-
KPI Number
-
KPI Group
-
KPI Name
-
Unit
-
Formula
-
Definition
-
KPI Type (LTB or UTB)
This sheet acts as the foundation of the dashboard.
Click to Purchases Vendor Management KPI Dashboard in Power BI
Advantages of Vendor Management KPI Dashboard in Power BI
Using this dashboard delivers multiple advantages:
-
✅ Centralizes vendor performance data
-
✅ Improves vendor accountability
-
✅ Highlights underperforming vendors
-
✅ Reduces manual reporting effort
-
✅ Enhances vendor negotiation power
-
✅ Supports data-driven decisions
These benefits make vendor management strategic rather than reactive.
How Does This Dashboard Improve Vendor Decision-Making?
With real-time insights, teams can:
-
Reduce supplier risks
-
Improve service quality
-
Control costs proactively
-
Identify high-performing vendors
-
Build long-term vendor partnerships
Because decisions rely on data, outcomes improve consistently.
Best Practices for the Vendor Management KPI Dashboard in Power BI
To maximize value, follow these best practices:
-
Keep vendor KPIs measurable and actionable
-
Define targets clearly
-
Update Excel files regularly
-
Review both MTD and YTD trends
-
Use drill-through for KPI clarity
-
Train teams on KPI interpretation
Following these practices ensures strong analytics adoption.
Who Should Use a Vendor Management KPI Dashboard?
This dashboard benefits:
-
Vendor managers
-
Procurement teams
-
Supply chain professionals
-
Finance controllers
-
Operations leaders
Since Excel and Power BI require minimal learning, adoption remains fast.
Conclusion
A Vendor Management KPI Dashboard in Power BI transforms how organizations monitor vendors. It replaces fragmented reports with a unified, interactive, and reliable analytics solution. By combining Excel-based input with Power BI visuals, organizations gain both flexibility and power.
With this dashboard, vendor management becomes transparent, proactive, and performance-driven. As a result, businesses strengthen supplier relationships and achieve sustainable growth.
Click to Purchases Vendor Management KPI Dashboard in Power BI
Frequently Asked Questions (FAQs)
What is a Vendor Management KPI Dashboard in Power BI?
It is a reporting solution that tracks vendor performance using KPIs, targets, trends, and comparisons.
Can I customize vendor KPIs in this dashboard?
Yes. You can easily modify or add KPIs using the Excel KPI Definition sheet.
Does this dashboard support MTD and YTD analysis?
Yes. The dashboard tracks both MTD and YTD values for accurate performance monitoring.
Is Excel mandatory as a data source?
Yes. Excel serves as the primary data source for actuals, targets, and KPI definitions.
Who typically uses this dashboard?
Procurement teams, vendor managers, supply-chain leaders, and finance teams use it frequently.
Click to Purchases Vendor Management KPI Dashboard in Power BI
Visit our YouTube channel to learn step-by-step video tutorials