DIY home improvement stores operate in a fast-moving retail environment where pricing, discounts, suppliers, customer behavior, and regional demand change constantly. Without a structured analytics system, store managers and retail leaders often struggle to understand what drives profit, where discounts reduce margins, and which stores or regions underperform. That is exactly where the DIY Home Improvement Stores Dashboard in Power BI delivers powerful value.
A DIY Home Improvement Stores Dashboard in Power BI transforms raw retail data into clean, interactive, and decision-ready insights. Moreover, it helps retailers track sales, profitability, discounts, customer satisfaction, and trends across stores and regions in one centralized view. Since this dashboard uses Power BI’s interactive capabilities, users can drill down, filter, and analyze performance instantly.
In this comprehensive blog post, you will learn everything about the DIY Home Improvement Stores Dashboard in Power BI—what it is, why it matters, how it works, page-wise analysis, advantages, best practices, and frequently asked questions. By the end, you will clearly understand how this dashboard helps DIY retailers improve profitability and customer experience.
Click to Purchases DIY Home Improvement Stores Dashboard in Power BI
What Is a DIY Home Improvement Stores Dashboard in Power BI?
A DIY Home Improvement Stores Dashboard in Power BI is a ready-to-use analytical solution designed to monitor and analyze key retail KPIs for home improvement stores.
Instead of reviewing multiple reports for order value, discounts, profits, and customer ratings, this dashboard consolidates all critical metrics into one interactive Power BI report. As a result, decision-makers gain instant clarity on sales performance, margin health, and customer behavior.
The dashboard connects to structured data and presents insights using cards, charts, slicers, and trend visuals. Therefore, retail teams can move from raw numbers to actionable insights faster.
Why Is a DIY Home Improvement Dashboard Important for Retailers?
DIY retail involves high transaction volumes, frequent discounts, multiple payment modes, and diverse customer types. Without proper analytics, many important insights remain hidden.
This dashboard becomes crucial because:
-
It centralizes store-level performance in one place
-
It highlights profit and margin trends clearly
-
It reveals the impact of discounts and payment modes
-
It compares performance across stores and regions
-
It supports data-driven pricing and promotion decisions
As a result, DIY retailers gain better control over profitability and customer satisfaction.
Click to Purchases DIY Home Improvement Stores Dashboard in Power BI
How Does the DIY Home Improvement Stores Dashboard in Power BI Work?
The dashboard follows a simple and effective workflow:
-
Retail data is stored in structured tables
-
Power BI connects to the data model
-
Measures calculate sales, profit, margin, and ratings
-
Slicers dynamically filter all visuals
-
Charts update instantly based on selections
Therefore, store managers spend less time preparing reports and more time analyzing store performance.
What Are the Key Features of the DIY Home Improvement Stores Dashboard?
The dashboard contains five analytical pages, each designed to answer specific retail performance questions.
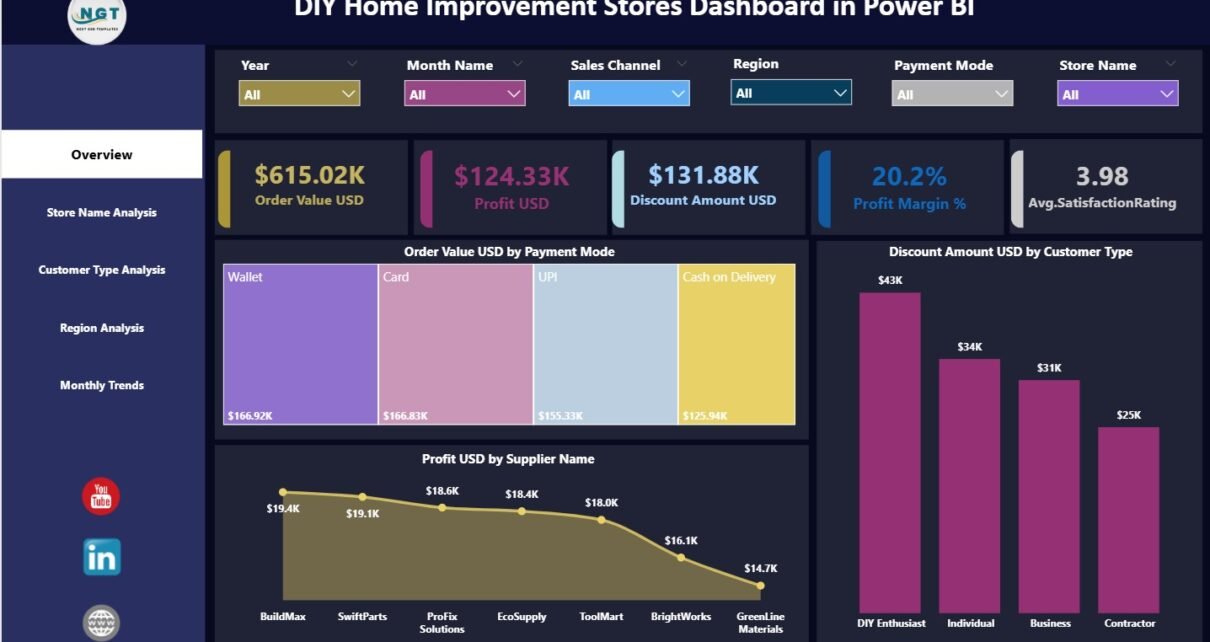
1.Overview Page: What Does the High-Level Store Performance Show?
The Overview Page acts as the main landing page of the dashboard. It provides a snapshot of overall business performance.
KPI Cards on the Overview Page
The Overview Page displays five KPI cards that summarize performance instantly:
-
Order Value USD
-
Profit USD
-
Discount Amount USD
-
Profit Margin %
-
Average Satisfaction Rating
These cards help retailers quickly assess sales health, profitability, and customer satisfaction.
Charts on the Overview Page
The Overview Page includes three insightful charts:
-
Order Value USD by Payment Mode
-
Discount Amount USD by Customer Type
-
Profit USD by Supplier Name
These visuals reveal how customers pay, where discounts concentrate, and which suppliers drive profits.
Slicers on the Overview Page
Interactive slicers (filters) allow users to focus on specific time periods, stores, or categories. As slicer selections change, all cards and charts update automatically.
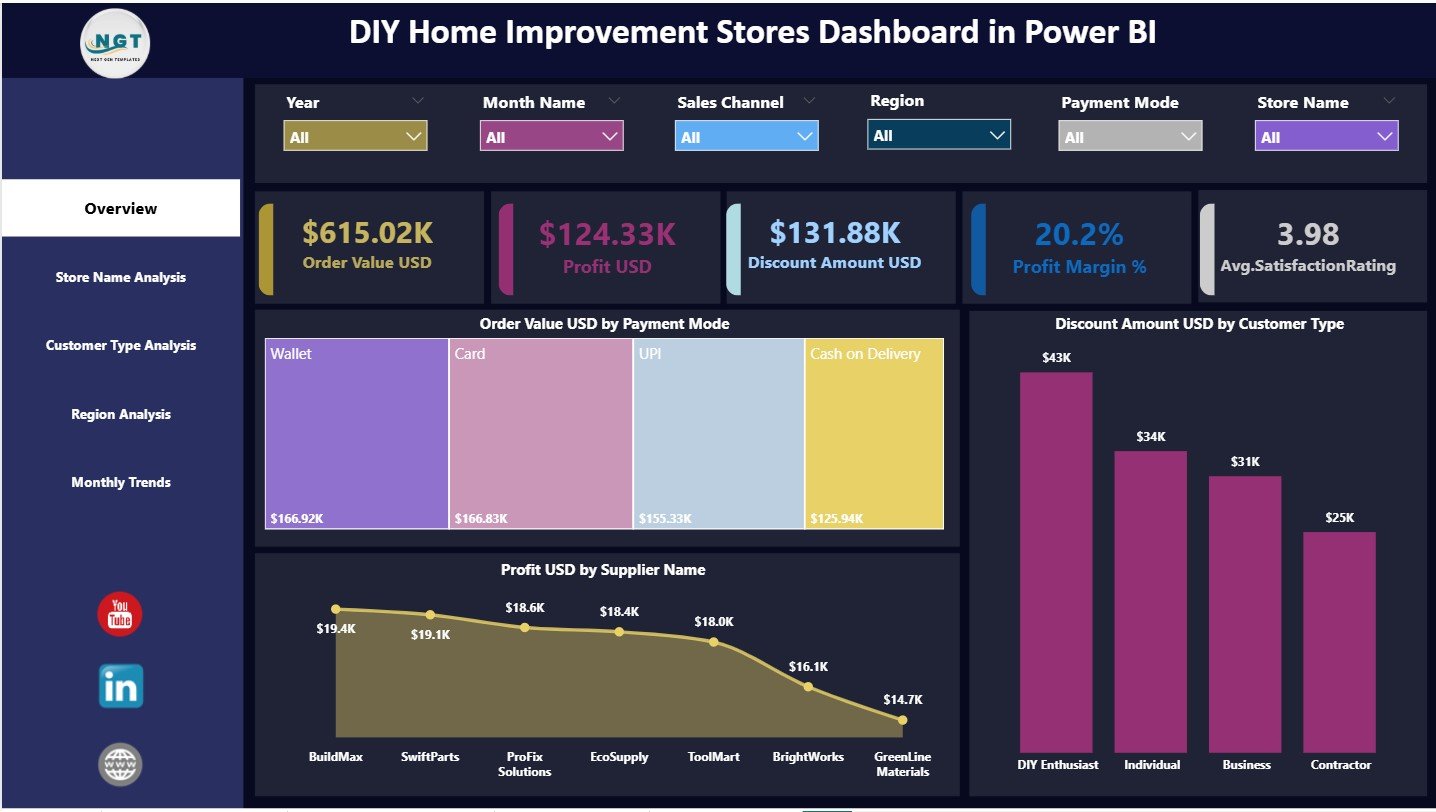
2.Store Name Analysis Page: How Do Individual Stores Perform?
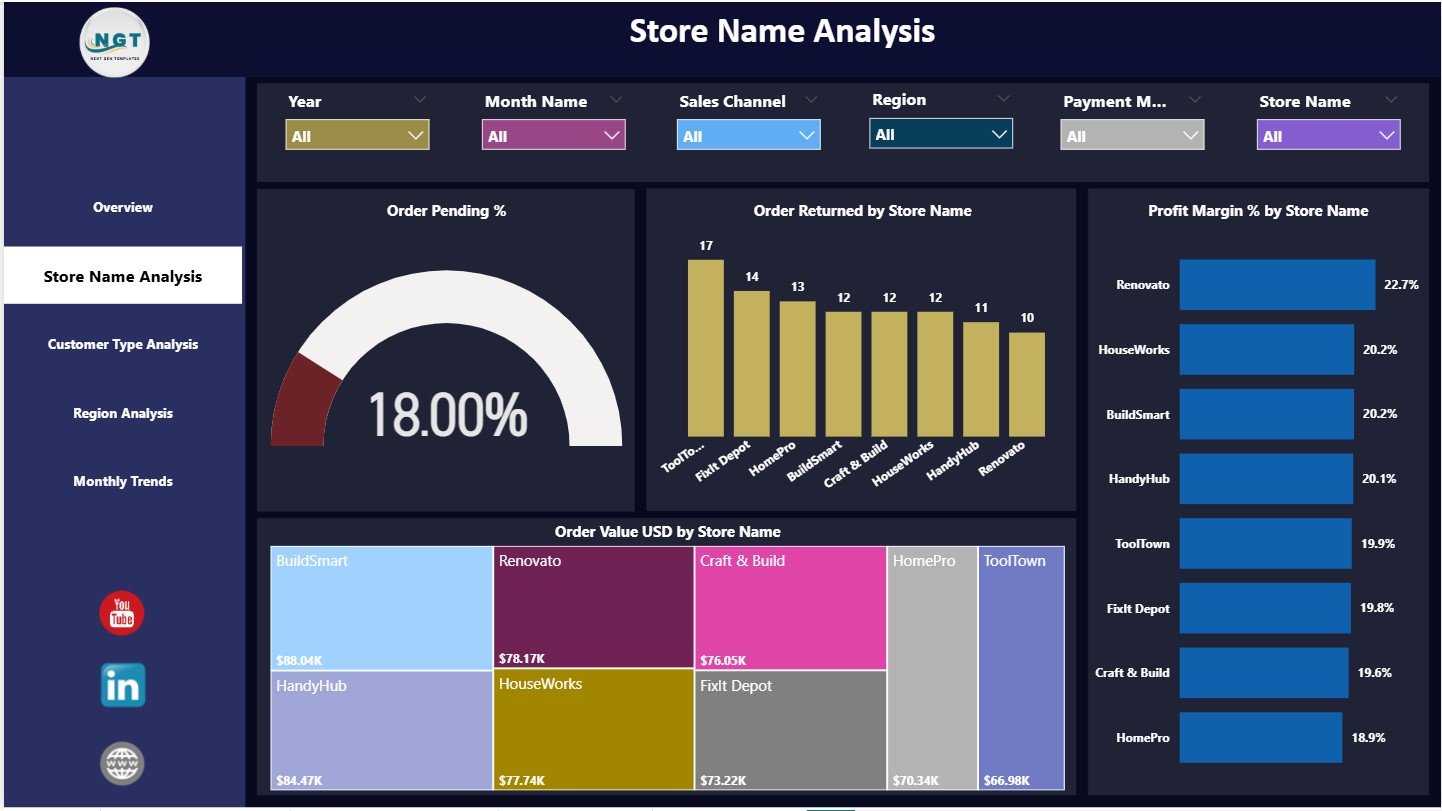
The Store Name Analysis Page focuses on comparing performance across store locations.
Charts on the Store Name Analysis Page
This page contains four critical charts:
-
Order Pending % by Store Name
-
Order Returned by Store Name
-
Profit Margin % by Store Name
-
Order Value USD by Store Name
These insights clearly show which stores perform well and which ones need operational improvement.
Why Is Store-wise Analysis Important?
-
It identifies stores with high pending orders
-
It highlights return-heavy locations
-
It compares profitability across outlets
-
It supports targeted store-level actions
As a result, management can improve underperforming stores faster.
Click to Purchases DIY Home Improvement Stores Dashboard in Power BI
3.Customer Type Analysis Page: How Do Different Customers Behave?
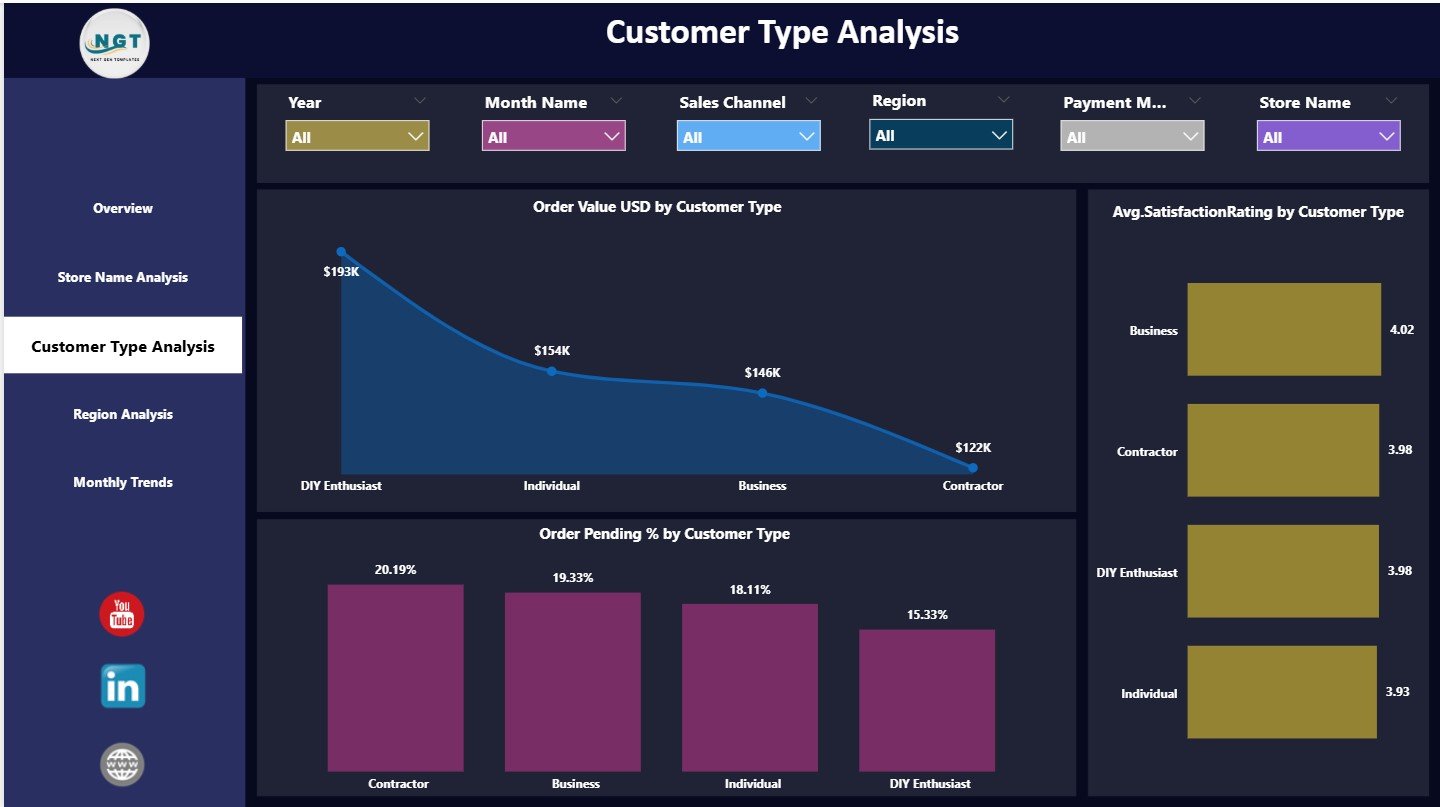
The Customer Type Analysis Page focuses on understanding customer segmentation.
Charts on the Customer Type Analysis Page
This page includes three focused charts:
-
Order Value USD by Customer Type
-
Average Satisfaction Rating by Customer Type
-
Order Pending % by Customer Type
These charts help retailers differentiate between retail, wholesale, and other customer segments.
Why Is Customer Type Analysis Valuable?
-
It highlights high-value customer segments
-
It identifies customer types with lower satisfaction
-
It helps optimize service and pricing strategies
Therefore, retailers can personalize offers and improve loyalty.
4.Region Analysis Page: How Does Performance Vary by Region?
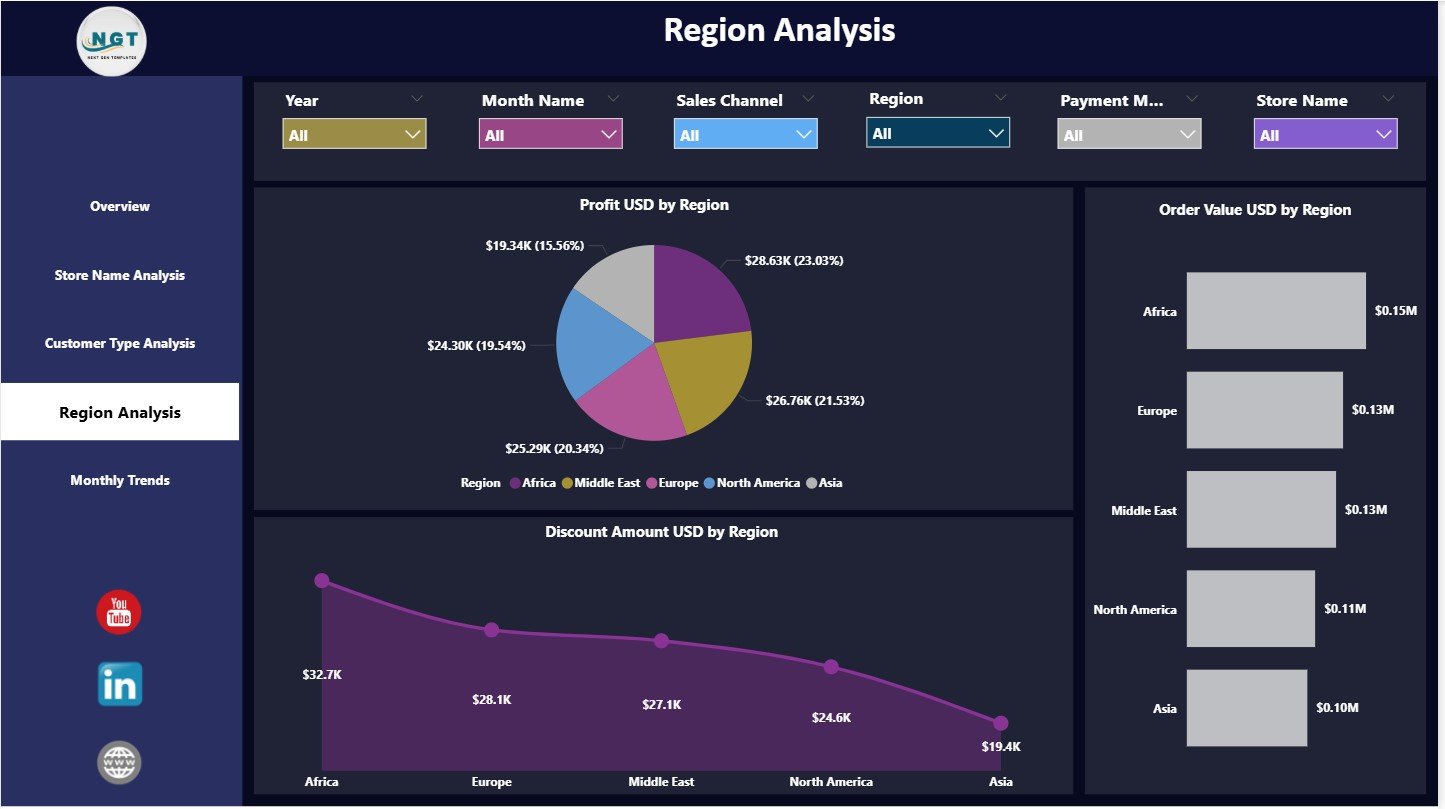
The Region Analysis Page compares performance across geographic locations.
Charts on the Region Analysis Page
This page displays three regional performance visuals:
-
Profit USD by Region
-
Order Value USD by Region
-
Discount Amount USD by Region
These charts reveal where revenue grows, where profits remain strong, and where discounts reduce margins.
Why Is Regional Analysis Important?
-
It supports regional pricing strategies
-
It identifies strong and weak markets
-
It guides inventory and promotion planning
As a result, regional managers gain actionable insights.
5.Monthly Trends Page: How Do Performance Metrics Move Over Time?
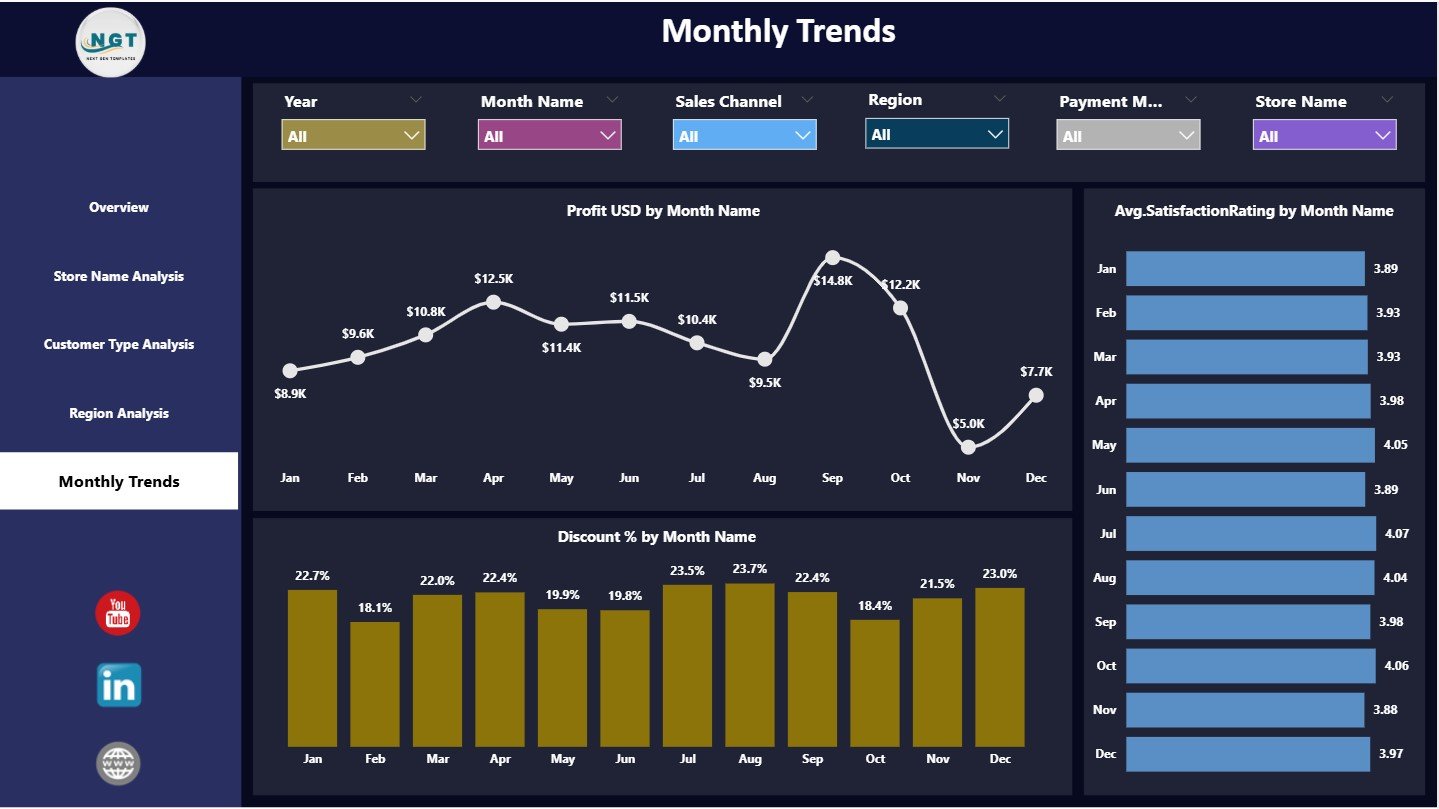
The Monthly Trends Page focuses on time-based performance analysis.
Charts on the Monthly Trends Page
This page includes three trend charts:
-
Profit USD by Month Name
-
Average Satisfaction Rating by Month Name
-
Discount % by Month Name
These trends help retailers understand seasonality, promotional impact, and customer sentiment over time.
Why Are Monthly Trends Critical?
-
They show profit consistency or volatility
-
They highlight discount-driven margin changes
-
They reveal satisfaction trends across the year
Therefore, planning and forecasting become easier.
Click to Purchases DIY Home Improvement Stores Dashboard in Power BI
Advantages of DIY Home Improvement Stores Dashboard in Power BI
Using this dashboard provides strong operational and strategic benefits:
-
✅ Centralized visibility of retail KPIs
-
✅ Clear insight into sales, profit, and discounts
-
✅ Store-wise and region-wise performance tracking
-
✅ Better understanding of customer behavior
-
✅ Faster decision-making with interactive visuals
-
✅ Scalable solution built on Power BI
Because of these advantages, retailers manage stores proactively instead of reactively.
Best Practices for Using the DIY Home Improvement Stores Dashboard in Power BI
Following best practices ensures reliable and actionable insights:
-
Keep product and store naming consistent
-
Review discount strategies regularly
-
Monitor profit margin alongside revenue
-
Analyze customer satisfaction with sales metrics
-
Use region and store filters together
-
Track monthly trends before planning promotions
When teams follow these practices, dashboard effectiveness increases significantly.
Common Mistakes to Avoid While Using the Dashboard
Avoiding common mistakes protects data accuracy and insights:
-
Avoid inconsistent region or store names
-
Do not ignore pending or return metrics
-
Avoid over-discounting without margin review
-
Do not analyze profit without volume context
-
Avoid cluttering pages with unnecessary visuals
By avoiding these errors, users maintain dashboard clarity.
Who Should Use the DIY Home Improvement Stores Dashboard?
This dashboard serves multiple retail stakeholders:
-
Store Managers
-
Regional Managers
-
Retail Operations Teams
-
Sales and Pricing Teams
-
Customer Experience Teams
-
Senior Retail Leadership
Because the dashboard uses Power BI visuals, both business and analytical users can work with it easily.
Conclusion
A DIY Home Improvement Stores Dashboard in Power BI converts complex retail data into a structured and actionable performance monitoring system. It improves transparency across stores, customers, suppliers, and regions. Moreover, it empowers retailers to control discounts, protect margins, and enhance customer satisfaction.
By analyzing orders, profit, discounts, and trends from one interactive platform, DIY retailers gain the clarity needed to grow sustainably. As a result, they make faster, smarter, and more profitable decisions.
For any DIY home improvement retailer aiming to scale operations and improve performance, this dashboard becomes an essential analytical asset.
Click to Purchases DIY Home Improvement Stores Dashboard in Power BI
Frequently Asked Questions (FAQs)
What is the main purpose of a DIY Home Improvement Stores Dashboard?
It helps retailers track sales, profit, discounts, customer satisfaction, and trends in one Power BI report.
Can this dashboard analyze multiple stores at once?
Yes. It supports multi-store and multi-region analysis using slicers.
Does the dashboard track customer satisfaction?
Yes. It includes average satisfaction rating analysis by customer type and month.
Can retailers customize KPIs and visuals?
Yes. Power BI allows full customization based on business needs.
Is this dashboard suitable for large retail chains?
Yes. Power BI handles large datasets efficiently when data is structured properly.
Do users need advanced Power BI skills to use it?
No. Basic Power BI navigation skills are sufficient for daily use.
Click to Purchases DIY Home Improvement Stores Dashboard in Power BI
Visit our YouTube channel to learn step-by-step video tutorials