Running a furniture retail business requires sharp visibility into sales, margins, inventory, customer trends, and operational efficiency. However, when managers rely on scattered Excel reports or manual summaries, decision-making becomes slow and reactive. Therefore, modern furniture retailers now depend on smart analytics solutions to stay competitive.
That is exactly where the Furniture Retail KPI Dashboard in Power BI becomes a powerful business tool.
In this detailed guide, you will learn what a Furniture Retail KPI Dashboard in Power BI is, how it works, why it matters, how to use it, and how it transforms raw Excel data into real-time insights. Moreover, you will explore dashboard pages, KPIs, data structure, advantages, best practices, and common questions—all explained clearly and practically.
Click to buy Furniture Retail KPI Dashboard in Power BI
What Is a Furniture Retail KPI Dashboard in Power BI?
A Furniture Retail KPI Dashboard in Power BI is a ready-to-use interactive analytics dashboard designed to monitor, measure, and improve key performance indicators (KPIs) for furniture retail businesses.
Instead of manually tracking performance in multiple spreadsheets, this dashboard centralizes all critical metrics into one powerful visual platform. As a result, retail managers, store owners, and analysts can make faster and more confident decisions.
Why Do Furniture Retailers Need KPI Dashboards?
Furniture retail involves long sales cycles, high inventory value, and seasonal demand. Therefore, businesses must constantly track performance to avoid losses.
A KPI dashboard helps retailers to:
- Monitor sales and profitability in real time
- Track KPI performance against targets
- Compare current performance with previous periods
- Identify problem areas early
- Improve operational efficiency
Because Power BI connects seamlessly with Excel, this solution remains simple yet extremely powerful.
How Does the Furniture Retail KPI Dashboard in Power BI Work?
The dashboard works on a well-structured Excel data source and a Power BI visualization layer.
First, users update actual and target KPI data in Excel sheets. Then, Power BI automatically refreshes visuals and calculations. As a result, users always view the latest performance without manual effort.
High-Level Workflow
- Enter KPI data in Excel
- Refresh the Power BI dashboard
- Analyze MTD and YTD performance
- Take corrective business actions
This clear workflow saves time and reduces errors significantly.
Key Features of the Furniture Retail KPI Dashboard in Power BI
The dashboard comes with three professionally designed pages, each serving a specific analytical purpose.
What Are the Pages in This Dashboard?
- Summary Page
- KPI Trend Page
- KPI Definition Page (Drill-Through)
Let us explore each page in detail.
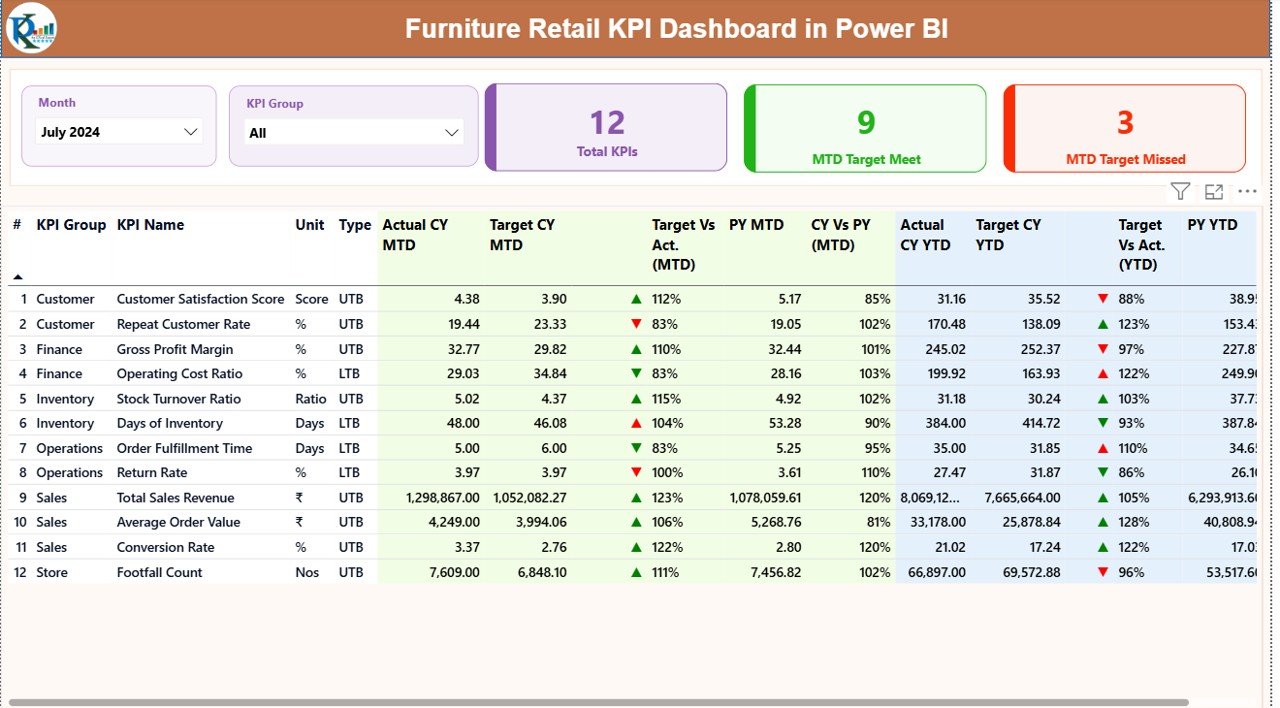
Summary Page: The Central Control Panel for KPI Monitoring
The Summary Page works as the main control center of the dashboard. Here, users get a complete snapshot of KPI performance at a glance.
What Filters Are Available on the Summary Page?
At the top of the page, users can filter data using:
- Month slicer
- KPI Group slicer
Because of these slicers, users can analyze specific periods and KPI categories easily.
What KPI Cards Are Shown on the Summary Page?
The dashboard includes three KPI cards for quick insights:
- Total KPIs Count
- MTD Target Met Count
- MTD Target Missed Count
These cards immediately show how well the business performs against defined targets.
What Information Does the Detailed KPI Table Show?
Below the cards, the dashboard displays a detailed KPI table that offers deep performance insights.
The table includes the following columns:
KPI Identification Fields
- KPI Number – Sequential number of the KPI
- KPI Group – Category such as Sales, Inventory, Operations
- KPI Name – Name of the KPI
- Unit – Measurement unit (%, USD, Days, Count)
- Type – LTB (Lower the Better) or UTB (Upper the Better)
MTD Performance Columns
- Actual CY MTD – Current Year Month-to-Date actual value
- Target CY MTD – Target value for the same period
- MTD Icon – ▼ or ▲ with red/green color to show performance status
- Target vs Actual (MTD) – Actual ÷ Target percentage
- PY MTD – Previous Year MTD value
- CY vs PY (MTD) – Current vs Previous Year comparison
YTD Performance Columns
- Actual CY YTD – Current Year actual YTD value
- Target CY YTD – Target YTD value
- YTD Icon – Performance indicator icon
- Target vs Actual (YTD) – Actual ÷ Target percentage
- PY YTD – Previous Year YTD value
- CY vs PY (YTD) – Year-over-year comparison
Because of this structured layout, users can easily identify strong and weak KPIs.
Click to buy Furniture Retail KPI Dashboard in Power BI
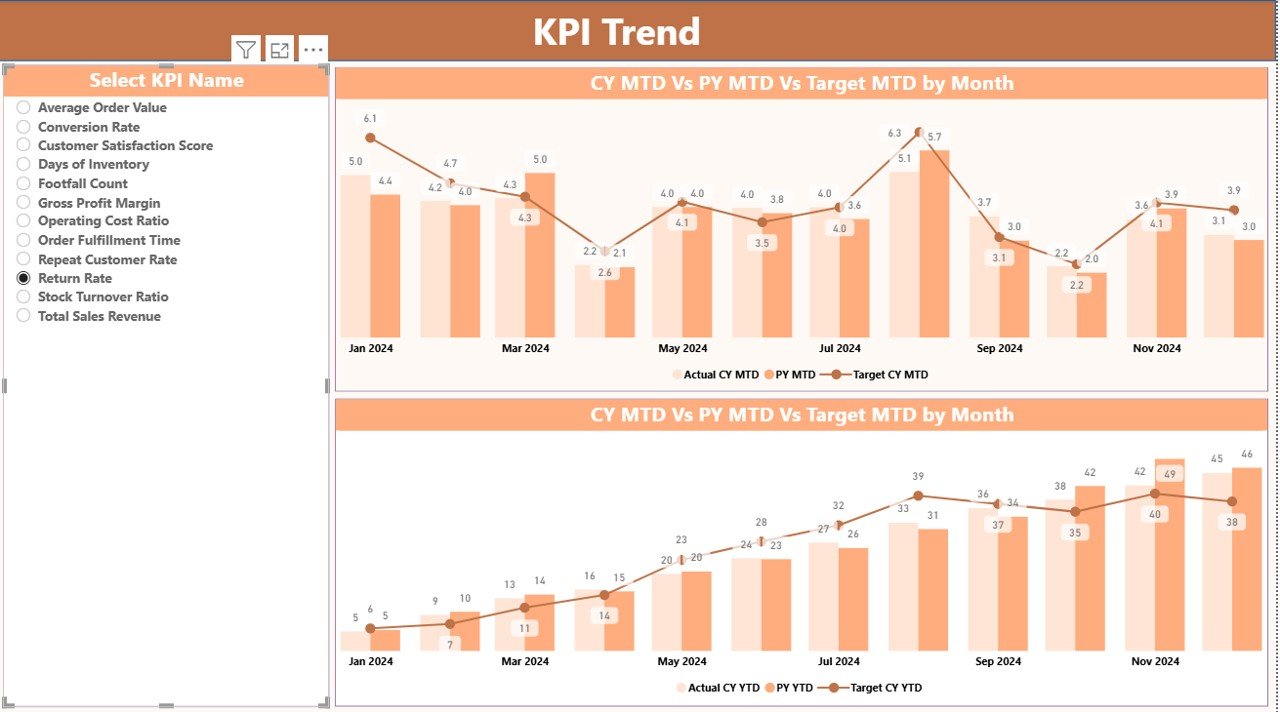
KPI Trend Page: How Do KPI Trends Help Furniture Retailers?
The KPI Trend Page helps users analyze performance movement over time.
This page focuses on benchmarking and trend analysis rather than snapshots.
What Charts Are Used on the KPI Trend Page?
The dashboard uses two combo charts to display:
- Current Year Actual values
- Previous Year Actual values
- Target values
One chart focuses on MTD trends, while the other displays YTD trends.
How Do Users Interact with the KPI Trend Page?
- Users select a KPI Name from the slicer on the left
- Charts instantly update based on the selected KPI
- Retailers easily track growth, decline, or stability
This interaction helps users identify pattern shifts early.
Click to buy Furniture Retail KPI Dashboard in Power BI
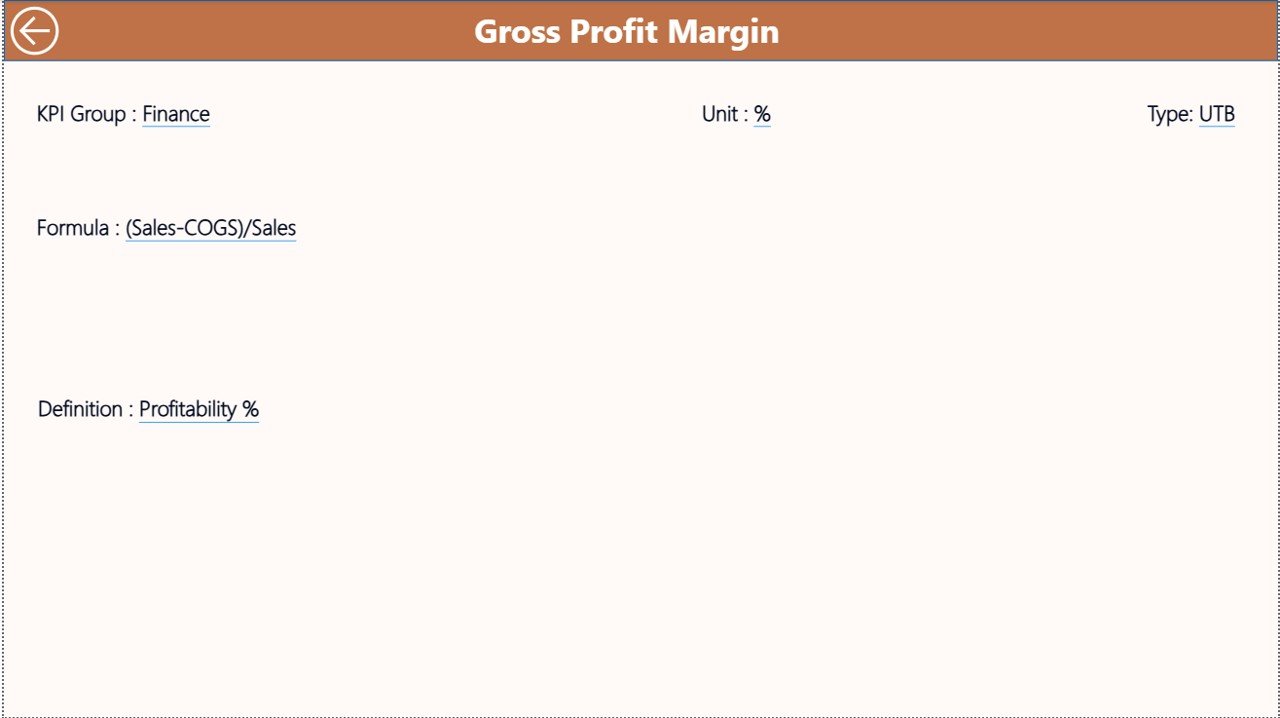
KPI Definition Page: Why Is KPI Clarity Important?
The KPI Definition Page works as a hidden drill-through page.
From the Summary Page, users can drill into this page to understand KPI logic clearly.
What Information Does the KPI Definition Page Show?
- KPI Formula
- KPI Definition
- KPI Type (LTB or UTB)
Because KPIs often confuse stakeholders, this page ensures consistency and clarity across teams.
How Do Users Navigate Back?
Users simply click the Back button located at the top-left corner.
Excel Data Structure Used in the Dashboard
The dashboard uses Excel as the data source, which keeps the solution flexible and user-friendly.
Click to buy Furniture Retail KPI Dashboard in Power BI
What Excel Sheets Does the Dashboard Use?
The Excel file contains three worksheets:
Input_Actual Sheet
This sheet captures actual KPI performance.
Users must fill:
- KPI Name
- Month (first date of the month)
- MTD actual value
- YTD actual value
Because dates remain numeric, Power BI handles time intelligence smoothly.
Input_Target Sheet
This sheet stores KPI targets.
Users must enter:
- KPI Name
- Month (first date of the month)
- MTD target value
- YTD target value
Targets drive all performance comparisons in the dashboard.
KPI Definition Sheet
This sheet defines KPI structure.
Users must fill:
- KPI Number
- KPI Group
- KPI Name
- Unit
- Formula
- Definition
- Type (LTB or UTB)
Because all KPIs remain standardized, reporting stays reliable.
Advantages of Furniture Retail KPI Dashboard in Power BI
Using this dashboard provides direct business value.
Key Advantages
- Centralized KPI monitoring in one place
- Real-time MTD and YTD performance visibility
- Clear target vs actual comparisons
- Visual alerts using icons and color coding
- Easy Excel data input without complexity
- Improved accountability across departments
- Faster and smarter decision-making
Because of these advantages, furniture retailers gain better operational control.
How Does This Dashboard Improve Furniture Retail Decision-Making?
This dashboard turns raw data into actionable insights.
It helps retailers to:
- Improve sales forecasting
- Reduce underperforming KPIs
- Optimize store and category performance
- Align teams around the same metrics
- Track year-over-year growth accurately
As a result, businesses move from reactive to proactive management.
Best Practices for the Furniture Retail KPI Dashboard in Power BI
To maximize dashboard benefits, follow these best practices:
- Define KPIs clearly before implementation
- Keep KPI targets realistic and updated
- Update Excel data consistently every month
- Use KPI Groups to segment analysis
- Review MTD KPIs weekly and YTD KPIs monthly
- Train users on KPI meanings and actions
- Drill into trends instead of relying only on summary views
Following these practices ensures long-term dashboard success.
Who Should Use a Furniture Retail KPI Dashboard in Power BI?
This dashboard suits multiple roles:
- Furniture store owners
- Regional retail managers
- Sales and operations teams
- Retail analysts
- Business consultants
Because of its flexibility, both small retailers and large furniture chains can use it effectively.
Conclusion: Why Should Furniture Retailers Invest in a KPI Dashboard?
A Furniture Retail KPI Dashboard in Power BI provides visibility, control, and clarity in today’s competitive retail environment.
Instead of relying on manual reports, businesses can monitor performance in real time, compare results with targets, and act quickly when issues arise. Because the dashboard uses Excel as the data source, it stays simple, flexible, and scalable.
Ultimately, this dashboard empowers furniture retailers to measure what matters, improve what matters, and grow with confidence.
Frequently Asked Questions (FAQs)
What is a Furniture Retail KPI Dashboard in Power BI used for?
It helps track, analyze, and improve key performance indicators for furniture retail businesses using interactive visuals.
Does this dashboard require Power BI Desktop?
Yes, users need Power BI Desktop to open and refresh the dashboard file.
Can I customize KPIs for my furniture business?
Yes, you can easily add, remove, or modify KPIs through the Excel data source.
Is Excel mandatory for this dashboard?
Yes, Excel acts as the primary data source for actuals, targets, and KPI definitions.
Can this dashboard handle multiple months and years?
Yes, the dashboard supports monthly and yearly analysis using date-based filtering.
Is this solution suitable for large furniture retail chains?
Yes, it works for both single stores and multi-store furniture retail operations.
Do I need advanced Power BI knowledge to use this dashboard?
No, basic Power BI usage knowledge and Excel data entry skills are enough.
Visit our YouTube channel to learn step-by-step video tutorials
Watch the step-by-step video tutorial:
Click to buy Furniture Retail KPI Dashboard in Power BI