Running a specialty bookstore requires much more than curating great books. Today, store owners must track orders, profits, returns, customer satisfaction, and trends across stores and categories. Because manual reports fail to provide timely insights, most bookstore managers now rely on interactive analytics tools. That is exactly why a Specialty Bookstores Dashboard in Power BI plays a vital role in modern retail management.
In this detailed article, you will learn what a Specialty Bookstores Dashboard in Power BI is, how it works, why it matters, and how each dashboard page helps bookstore owners improve performance. Moreover, this guide explains key KPIs, analytical use cases, advantages, best practices, and frequently asked questions in a clear and practical way.
Click to Purchases Specialty Bookstores Dashboard in Power BI
What Is a Specialty Bookstores Dashboard in Power BI?
A Specialty Bookstores Dashboard in Power BI is an interactive analytics solution designed to track and analyze bookstore performance across stores, book categories, customer types, and time periods.
Instead of reviewing multiple Excel files or static reports, this dashboard consolidates all critical bookstore KPIs into one dynamic Power BI file. As a result, owners, managers, and analysts can quickly identify trends, issues, and growth opportunities.
Most importantly, Power BI allows users to filter data using slicers, drill down into details, and visualize insights in real time, which supports faster and smarter decisions.
Why Do Specialty Bookstores Need a Power BI Dashboard?
Specialty bookstores face unique challenges. They usually deal with niche categories, loyal customers, and varying satisfaction levels. Therefore, simple sales reports do not provide enough clarity.
A Power BI dashboard solves this problem by:
-
Centralizing sales, profit, and customer data
-
Showing trends across stores and genres
-
Identifying high-return or low-margin categories
-
Measuring customer satisfaction by store and customer type
Because of these benefits, bookstore managers can easily move from reactive decisions to proactive strategies.
Click to Purchases Specialty Bookstores Dashboard in Power BI
What Data Does a Specialty Bookstores Dashboard Track?
Before exploring dashboard pages, it is important to understand the data structure used in this solution. The dashboard typically tracks:
-
Store Name
-
Book Category / Genre
-
Customer Type
-
Order Value (USD)
-
Profit (USD)
-
Return Rate (%)
-
Profit Margin (%)
-
Satisfaction Rating
-
Payment Mode
-
Order Status
-
Transaction Date
Since the data remains well-structured and clean, Power BI visuals update instantly when filters change.
Overview Page – How Does This Dashboard Summarize Performance?
What Is the Purpose of the Overview Page?
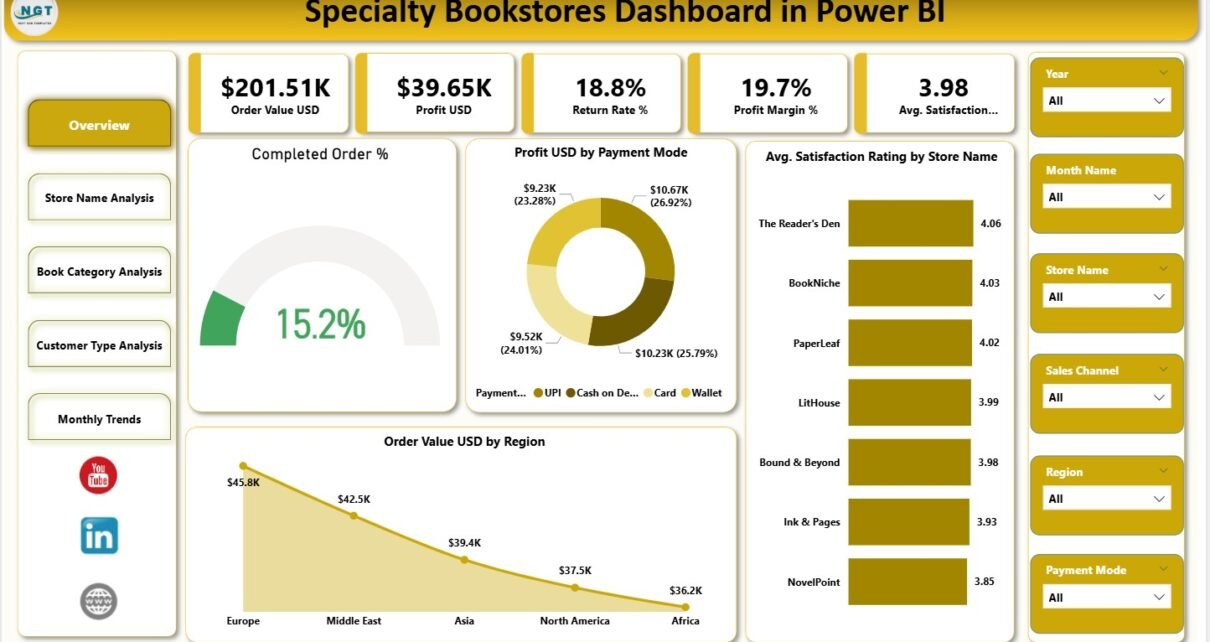
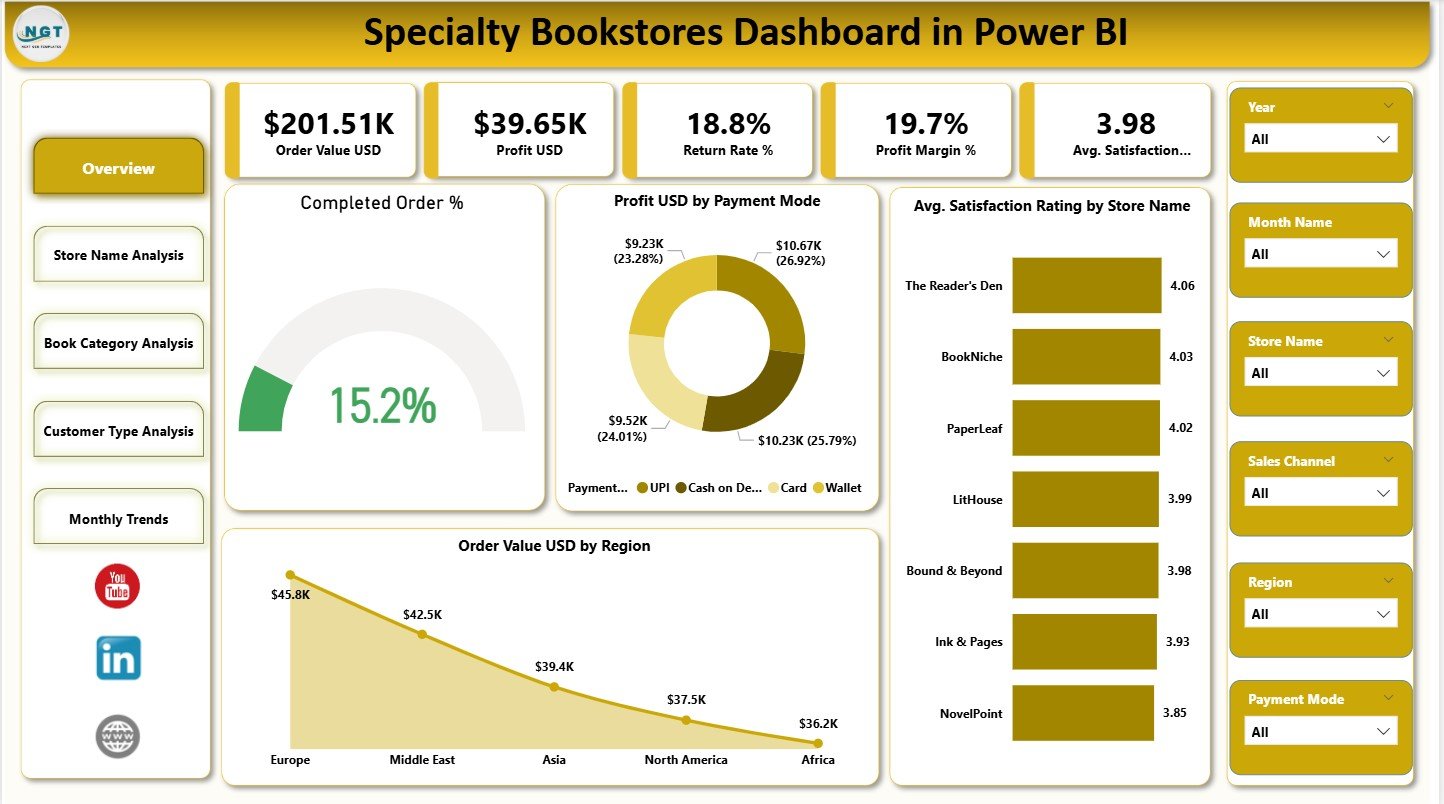
The Overview Page serves as the first and most important page of the Specialty Bookstores Dashboard in Power BI. It provides a quick snapshot of overall business health.
Because top management usually reviews this page first, it focuses on high-level KPIs and summary charts.
Key KPI Cards on the Overview Page
The dashboard includes five KPI cards, which highlight critical performance indicators:
-
Order Value (USD): Shows total sales value across all stores
-
Profit (USD): Displays overall profitability
-
Return Rate (%): Indicates the percentage of returned orders
-
Profit Margin (%): Reflects efficiency in generating profit
-
Average Satisfaction Rating: Measures customer experience
Together, these KPIs give instant clarity on sales, profitability, and customer sentiment.
Key Charts on the Overview Page
In addition to KPI cards, the Overview page includes four insightful charts:
-
Completed Order %: Shows order completion efficiency
-
Profit USD by Payment Mode: Highlights profitable payment options
-
Avg. Satisfaction Rating by Store Name: Compares store-level experience
-
Order Value USD by Region: Reveals regional sales performance
Because slicers are available on this page, users can filter results by store, category, or time period.
Click to Purchases Specialty Bookstores Dashboard in Power BI
Store Name Analysis – How Do Individual Stores Perform?
Why Is Store-Level Analysis Important?
Each specialty bookstore location operates differently. Therefore, analyzing store-wise performance becomes essential for targeted improvements.
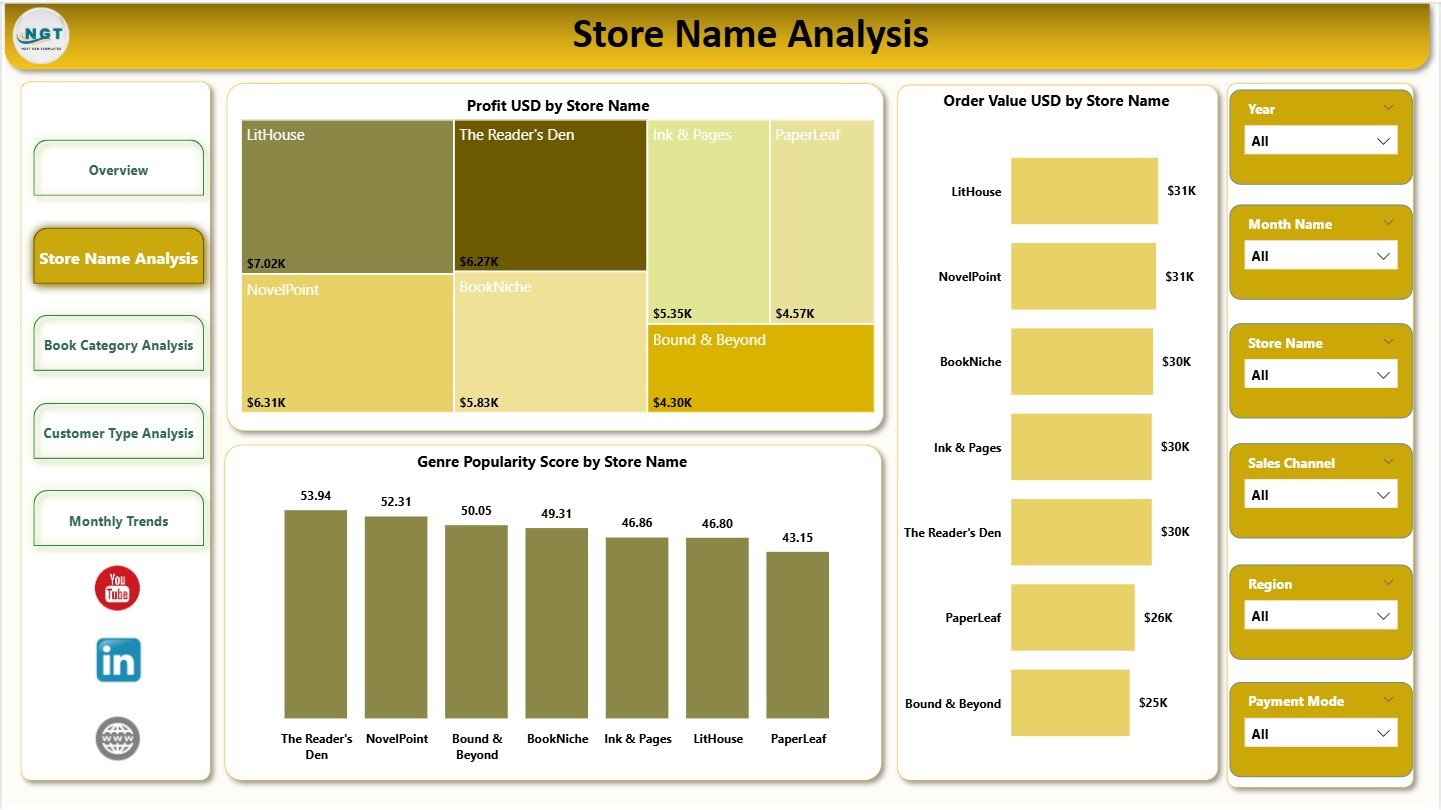
The Store Name Analysis page focuses entirely on comparing individual stores.
Key Charts on Store Name Analysis Page
This page includes three detailed visuals:
-
Profit USD by Store Name: Identifies top and low-performing stores
-
Order Value USD by Store Name: Shows sales contribution by location
-
Genre Popularity Score by Store Name: Reveals customer taste patterns per store
Because this page enables side-by-side comparisons, owners can quickly decide where to invest, promote, or optimize inventory.
Book Category Analysis – Which Genres Drive Success?
How Does Category Analysis Improve Decisions?
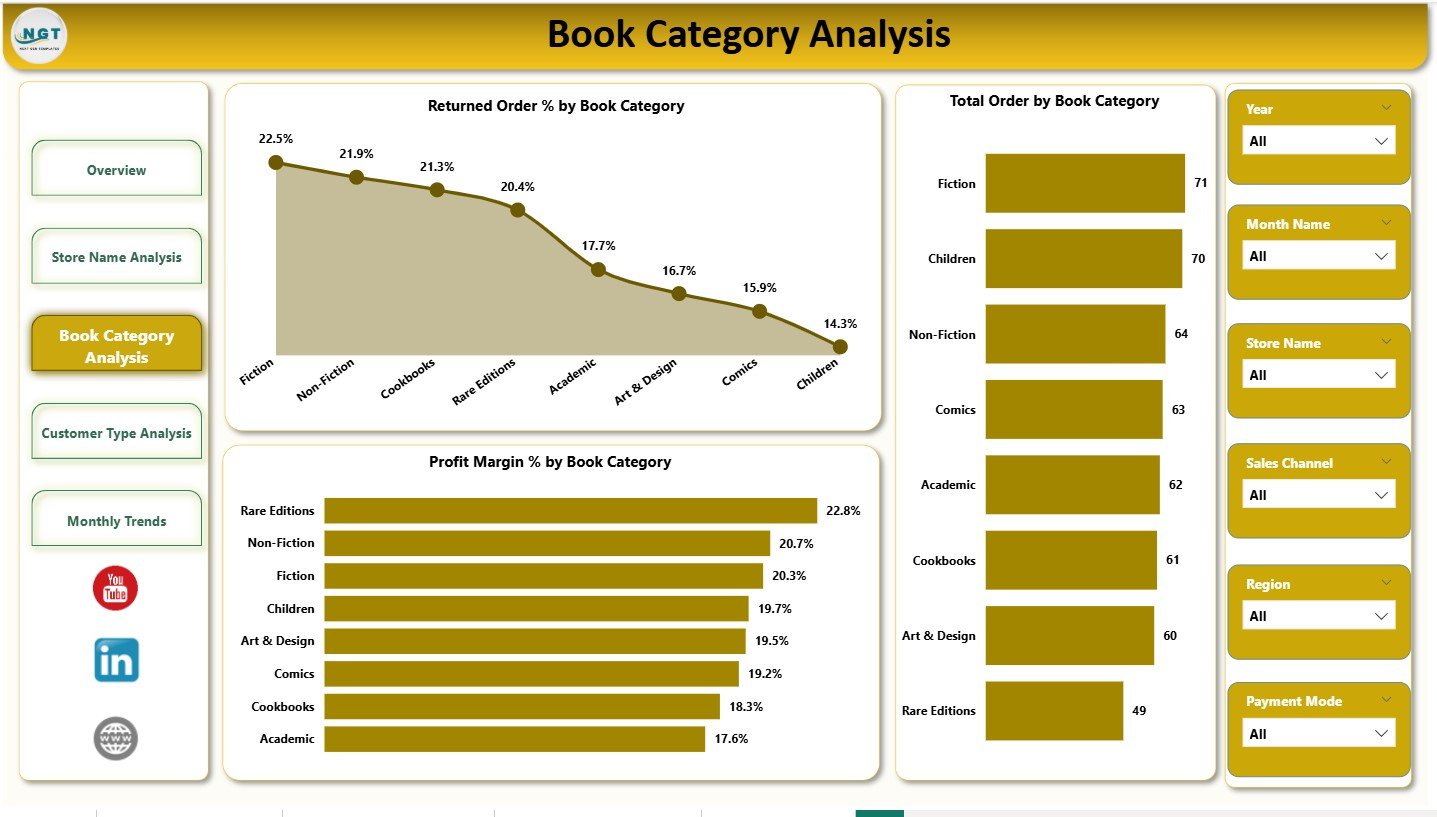
Specialty bookstores thrive on genre selection. However, not all categories perform equally. That is why Book Category Analysis becomes critical.
Key Charts on Book Category Analysis Page
This page includes three essential charts:
-
Returned Order % by Book Category: Identifies problematic genres
-
Total Orders by Book Category: Shows demand across categories
-
Profit Margin % by Book Category: Highlights high-margin genres
With these insights, bookstores can refine stock planning, reduce returns, and focus on profitable categories.
Click to Purchases Specialty Bookstores Dashboard in Power BI
Customer Type Analysis – Who Are Your Most Valuable Customers?
Why Should Bookstores Analyze Customer Types?
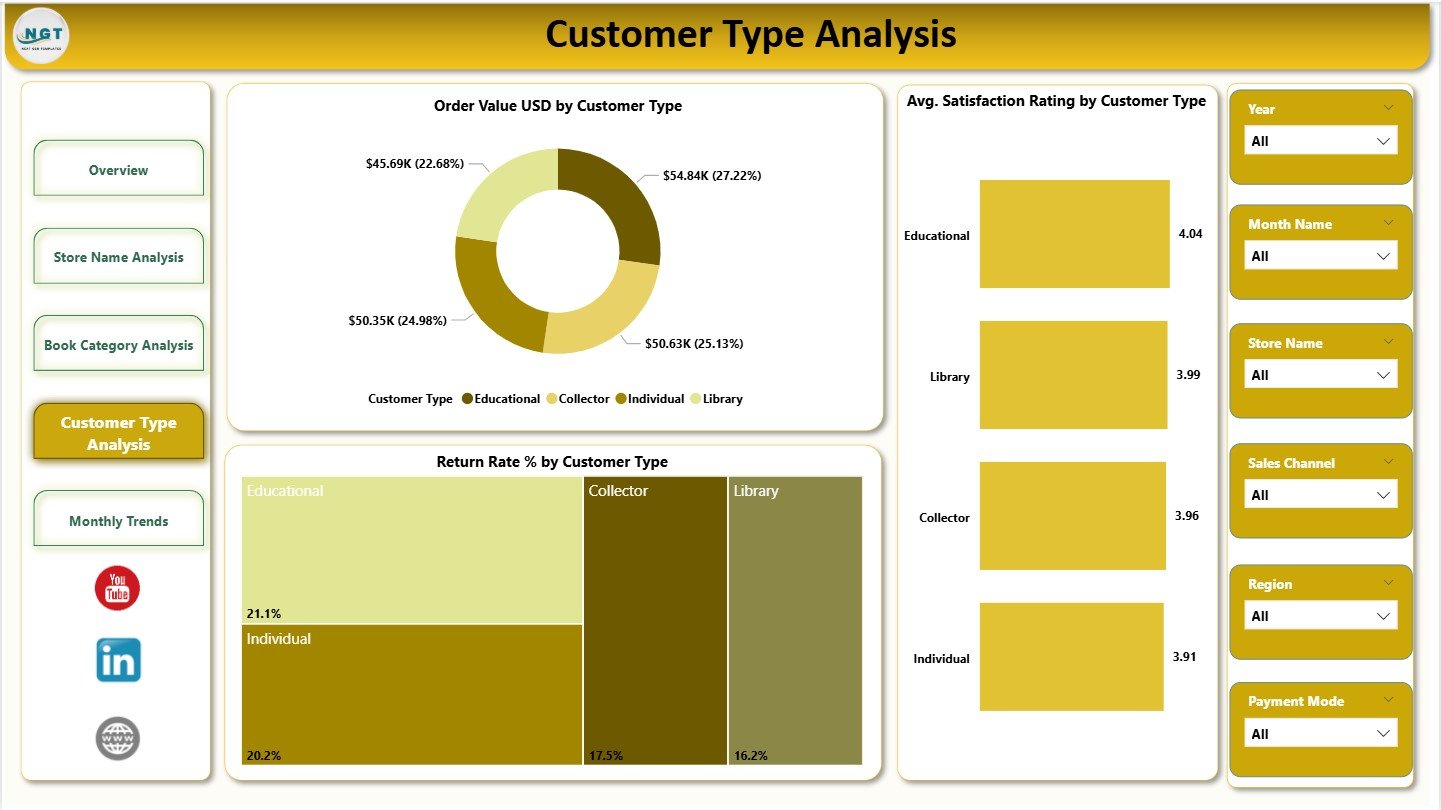
Different customer segments behave differently. For example, loyal readers may generate steady revenue, while occasional buyers may produce high returns. Therefore, understanding customer behavior helps improve marketing strategies.
Key Charts on Customer Type Analysis Page
The Customer Type Analysis page includes three focused visuals:
-
Order Value USD by Customer Type: Measures revenue by segment
-
Avg. Satisfaction Rating by Customer Type: Shows experience quality
-
Return Rate % by Customer Type: Identifies risky customer segments
By using this page, bookstore managers can design better loyalty programs, personalize offers, and improve satisfaction.
Monthly Trends – How Does Performance Change Over Time?
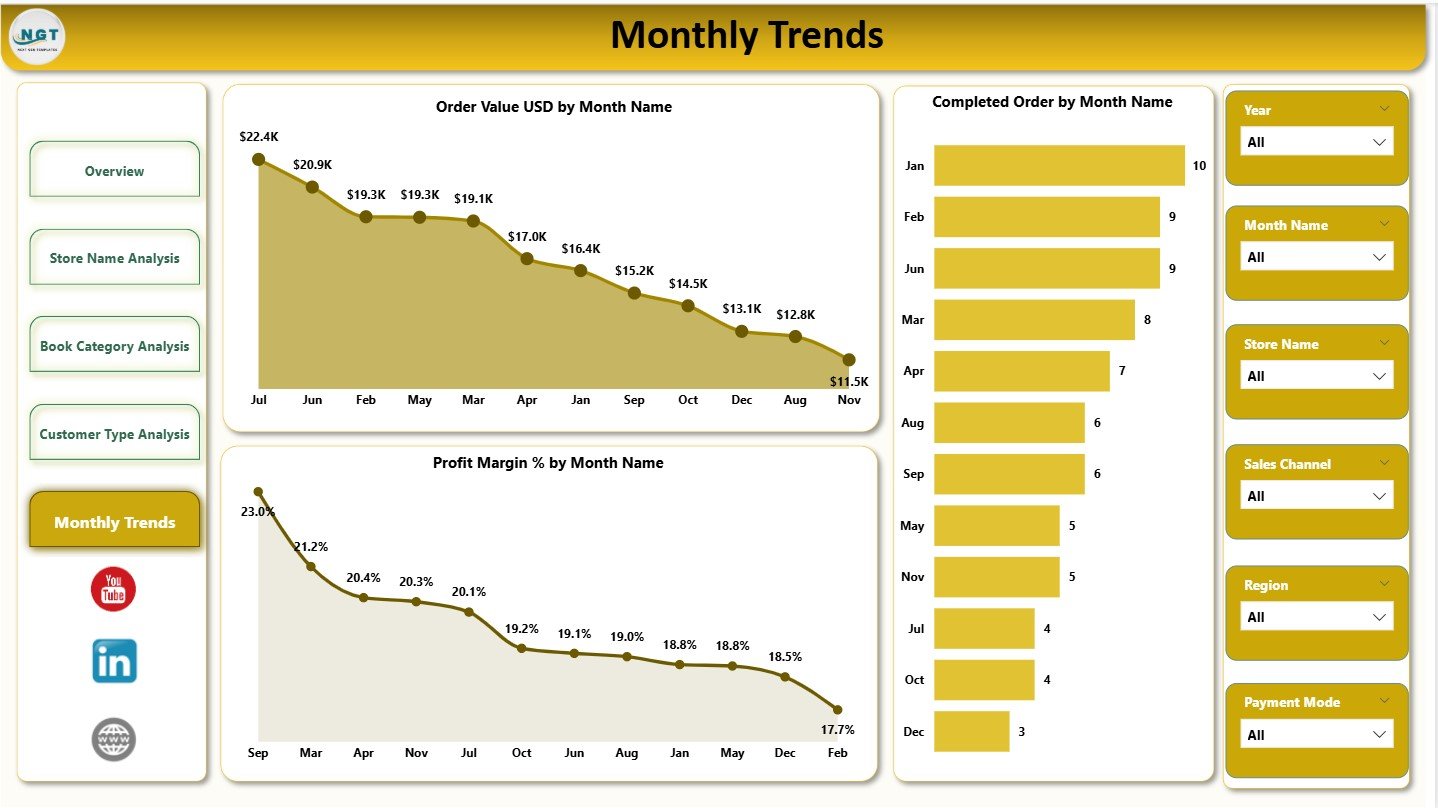
Why Are Monthly Trends Essential?
Sales and customer behavior change over time due to seasons, promotions, and events. Therefore, tracking trends helps bookstores plan effectively.
Key Charts on Monthly Trends Page
This final dashboard page includes three time-based visuals:
-
Order Value USD by Month Name: Tracks monthly sales trends
-
Completed Orders by Month Name: Shows operational consistency
-
Profit Margin % by Month Name: Reveals efficiency fluctuations
Because users can compare months easily, they gain clarity on peak and slow periods.
Click to Purchases Specialty Bookstores Dashboard in Power BI
What KPIs Can You Track Using This Dashboard?
The Specialty Bookstores Dashboard in Power BI supports several powerful KPIs, including:
-
Total Order Value
-
Total Profit
-
Return Rate (%)
-
Profit Margin (%)
-
Average Satisfaction Rating
-
Completed Order Percentage
-
Genre Popularity Score
These KPIs help bookstores align operations with financial and customer goals.
How Does This Dashboard Support Business Decisions?
This dashboard helps decision-makers in multiple ways:
-
Improve inventory planning by category insights
-
Optimize payment methods based on profitability
-
Reduce returns through category and customer analysis
-
Improve customer satisfaction using ratings data
-
Identify high-performing stores and regions
As a result, managers make faster and more confident decisions.
Advantages of Specialty Bookstores Dashboard in Power BI
Using this dashboard brings several strong advantages:
-
✅ Centralized view of bookstore performance
-
✅ Interactive slicers for deep analysis
-
✅ Real-time insights without manual reporting
-
✅ Improved customer experience tracking
-
✅ Better control over returns and margins
Because of these benefits, many specialty retailers now prefer Power BI dashboards.
Click to Purchases Specialty Bookstores Dashboard in Power BI
Best Practices for the Specialty Bookstores Dashboard in Power BI
To get maximum value from this dashboard, follow these best practices:
-
Keep source data clean and consistently updated
-
Use clear store and category naming standards
-
Review KPI trends weekly or monthly
-
Combine dashboard insights with operational actions
-
Limit slicers to meaningful dimensions only
When teams follow these practices, dashboard insights become truly actionable.
Conclusion
The Specialty Bookstores Dashboard in Power BI transforms raw bookstore data into powerful visual insights. Instead of guessing trends or relying on static reports, bookstore owners can now track performance, understand customer behavior, and improve profitability with confidence.
Because the dashboard covers overview metrics, store analysis, category insights, customer behavior, and monthly trends, it supports complete retail intelligence. Ultimately, this dashboard helps specialty bookstores stay competitive and customer-focused in a data-driven world.
Frequently Asked Questions (FAQs)
What is a Specialty Bookstores Dashboard in Power BI used for?
It helps analyze sales, profits, returns, and customer satisfaction across stores, categories, and time periods.
Can beginners use this Power BI dashboard?
Yes. The dashboard uses simple visuals, filters, and KPI cards that remain easy to understand.
Does this dashboard support multiple stores?
Yes. It compares performance across multiple bookstore locations.
Can I customize KPIs in this dashboard?
Yes. Power BI allows full customization of KPIs, charts, and filters.
How often should bookstore data be updated?
You should update data daily or weekly for accurate insights.
Is this dashboard suitable for small bookstores?
Absolutely. Both small and large specialty bookstores benefit from centralized analytics.
Click to Purchases Specialty Bookstores Dashboard in Power BI
Visit our YouTube channel to learn step-by-step video tutorials