Managing office vehicles without a structured system creates confusion, higher costs, and poor visibility. Vehicles remain unused, fuel expenses rise unexpectedly, maintenance schedules get missed, and management struggles to understand where money actually goes. Therefore, organizations that rely on office vehicles must adopt a smarter and more transparent solution.
That is exactly where the Office Vehicle Fleet Dashboard in Excel becomes a powerful and practical tool.
In this detailed article, you will learn what an Office Vehicle Fleet Dashboard in Excel is, why it matters, how it works, and how each analytical sheet supports better decisions. Moreover, you will also understand its advantages, best practices, real-world use cases, and frequently asked questions—all explained in simple and easy language.
Whether you manage a small corporate fleet or handle vehicles across regions and departments, this dashboard helps you reduce costs and improve control—using only Excel.
Click to buy Office Vehicle Fleet Dashboard in Excel
What Is an Office Vehicle Fleet Dashboard in Excel?
An Office Vehicle Fleet Dashboard in Excel is a ready-to-use, visual performance management tool that converts raw fleet data into clear insights. It tracks vehicle usage, fuel costs, maintenance expenses, insurance costs, downtime, and operating efficiency across departments, regions, vendors, and months.
Instead of maintaining multiple Excel files or manual reports, this dashboard centralizes all fleet KPIs in one interactive Excel file.
As a result, decision-makers can:
- Monitor total fleet costs instantly
- Identify high-cost vehicles or vendors
- Compare departments and regions
- Track monthly trends
- Take timely corrective actions
Because the dashboard runs inside Excel, it remains cost-effective, flexible, and easy to adopt.
Why Do Organizations Need an Office Vehicle Fleet Dashboard?
Managing vehicles manually leads to hidden expenses, delayed maintenance, and poor accountability. However, when organizations use an Excel fleet dashboard, they gain instant clarity and control.
Here is why this dashboard matters:
- Fleet costs increase every year due to fuel, insurance, and repairs
- Vehicles often stay underutilized or poorly maintained
- Management lacks department-wise and region-wise insights
- Vendors influence costs significantly without visibility
- Monthly reviews take time and effort
Therefore, the Office Vehicle Fleet Dashboard in Excel solves these problems by combining automation, accuracy, and visualization in one place.
What Sheets Are Available in the Office Vehicle Fleet Dashboard?
This dashboard contains multiple analytical sheet tabs, each designed to answer a specific business question. Let us examine each sheet in detail.
Overview Sheet Show
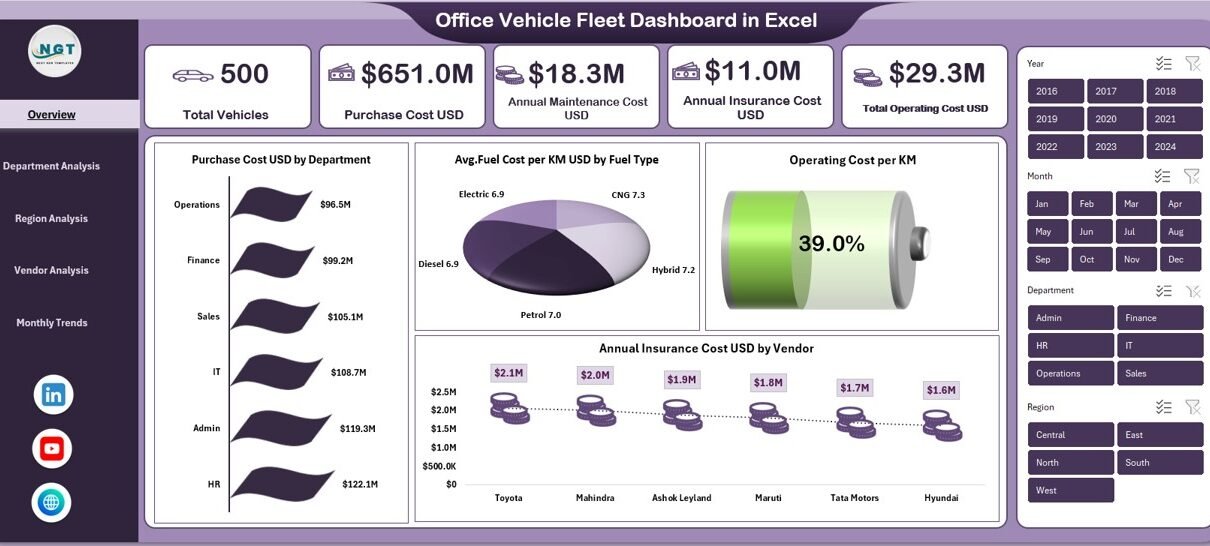
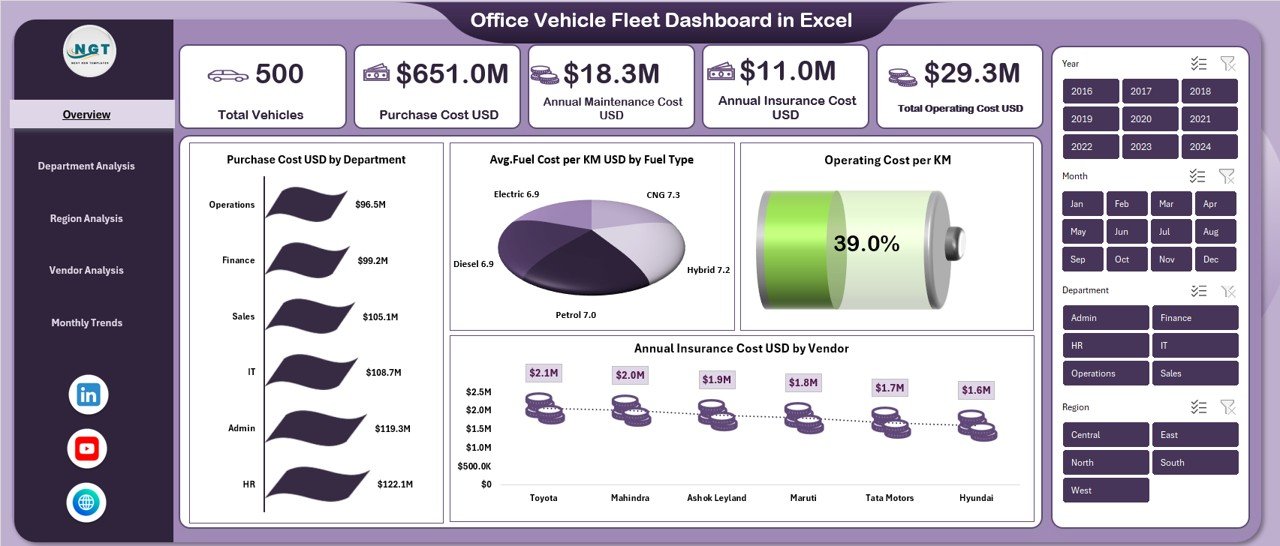
The Overview Sheet acts as the command center of the dashboard. It provides a high-level snapshot of fleet performance using KPI cards and summary charts.
Key KPIs Displayed in the Overview Sheet
- Total Vehicles
Shows the total number of office vehicles currently in operation. - Purchase Cost USD
Displays the total investment made in vehicle purchases. - Annual Maintenance Cost USD
Tracks yearly servicing and repair expenses. - Annual Insurance Cost USD
Shows the total insurance amount paid annually. - Total Operating Cost USD
Combines fuel, maintenance, and insurance costs into one metric.
Key Charts in the Overview Sheet
- Purchase Cost USD by Department
Helps identify which department holds the highest capital investment. - Avg. Fuel Cost per KM USD by Fuel Type
Compares petrol, diesel, CNG, electric, or hybrid vehicles. - Operating Cost per KM
Highlights overall cost efficiency. - Annual Insurance Cost USD by Vendor
Shows vendor-wise insurance spending distribution.
Because this sheet summarizes everything at once, decision-makers can quickly understand the overall fleet situation.
Click to buy Office Vehicle Fleet Dashboard in Excel
Department Analysis Sheet
Fleet usage varies across departments. Therefore, understanding department-level performance is critical.
The Department Analysis Sheet focuses entirely on department-wise insights.
KPIs and Charts in Department Analysis
- Total KM Run by Department
Identifies departments with heavy vehicle usage. - Annual Maintenance Cost USD by Department
Highlights departments causing higher maintenance expenses. - Avg. Mileage KM per L by Department
Measures fuel efficiency across departments. - Total Operating Cost USD by Department
Shows the full cost impact department-wise.
Using this sheet, managers can:
- Control misuse of vehicles
- Improve driver accountability
- Optimize department-wise vehicle allocation
Click to buy Office Vehicle Fleet Dashboard in Excel
Region Analysis
Regional conditions directly affect vehicle performance. Road quality, traffic conditions, and distance traveled differ drastically across locations.
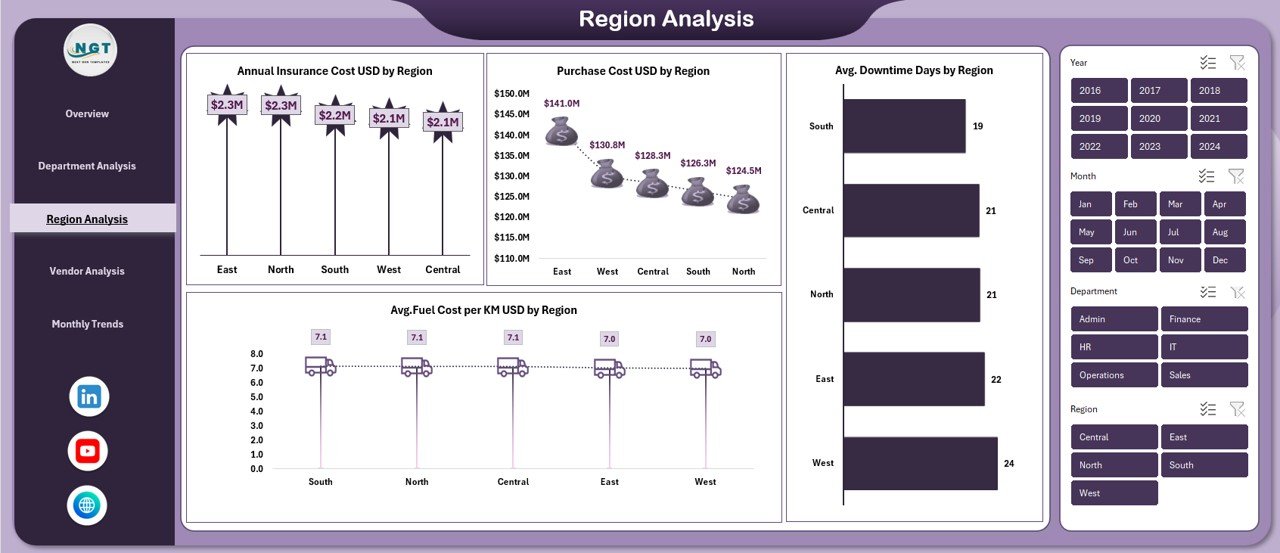
That is why the Region Analysis Sheet plays a vital role.
Key Metrics in Region Analysis
- Annual Insurance Cost USD by Region
Compares insurance expenses across geographic locations. - Purchase Cost USD by Region
Shows capital investment region-wise. - Avg. Fuel Cost per KM USD by Region
Highlights fuel cost variations. - Avg. Downtime Days by Region
Identifies regions where vehicles stay unavailable due to issues.
With this sheet, organizations can:
- Identify high-risk regions
- Improve regional fleet planning
- Reduce downtime losses
Click to buy Office Vehicle Fleet Dashboard in Excel
Vendor Analysis Sheet
Vendors strongly influence fleet expenses and service quality. Therefore, organizations must track vendor performance carefully.
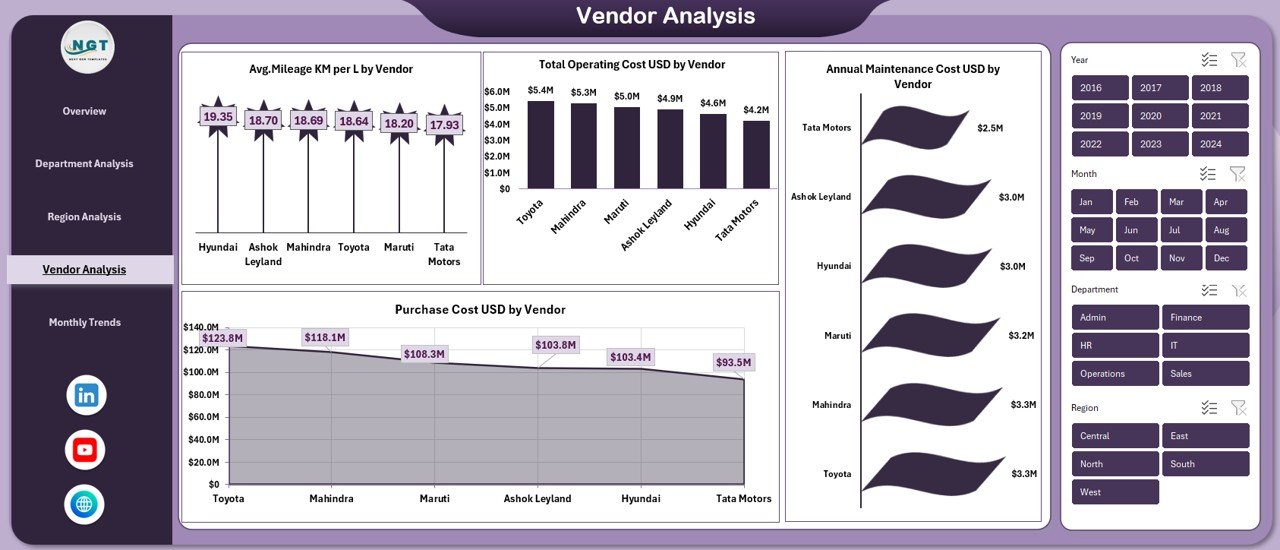
The Vendor Analysis Sheet delivers vendor-wise analytics.
Vendor Metrics Covered
- Avg. Mileage KM per L by Vendor
Evaluates vehicle efficiency supplied by each vendor. - Purchase Cost USD by Vendor
Compares vehicle procurement costs. - Total Operating Cost USD by Vendor
Identifies expensive vendors. - Annual Maintenance Cost USD by Vendor
Measures ongoing service quality.
This sheet enables organizations to:
- Renegotiate vendor contracts
- Replace underperforming suppliers
- Choose cost-efficient vendors
Click to buy Office Vehicle Fleet Dashboard in Excel
Monthly Trends
Static data does not reveal patterns. However, monthly trends help predict and control costs effectively.
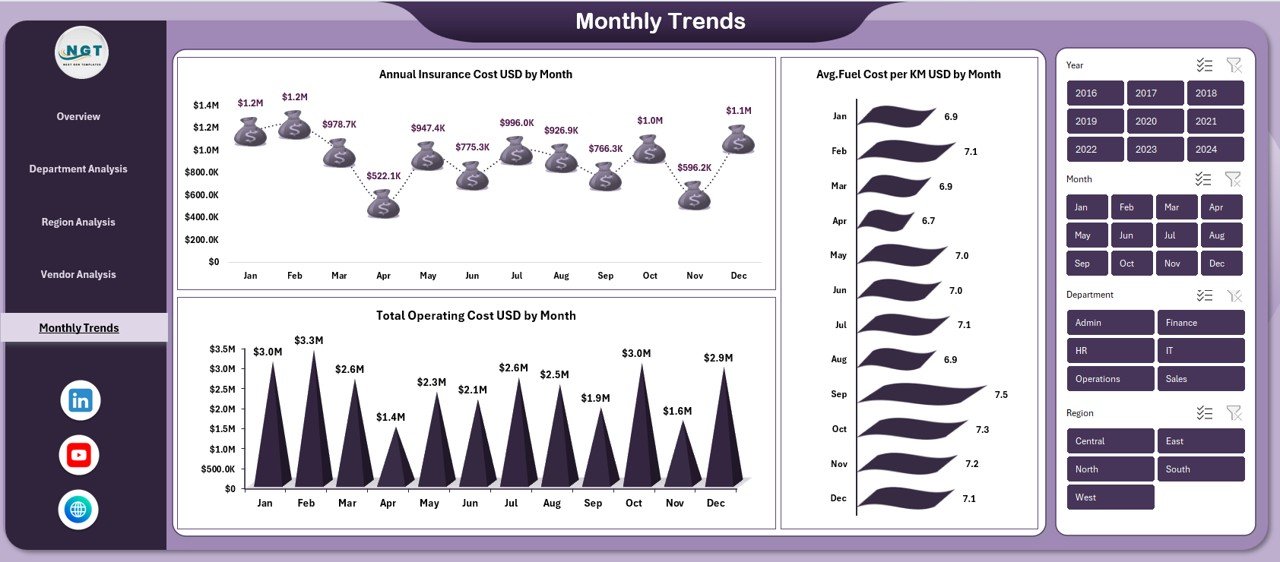
The Monthly Trends Sheet tracks time-based performance.
Monthly Trend KPIs
- Annual Insurance Cost USD by Month
Helps track renewal cycles and cost spikes. - Total Operating Cost USD by Month
Highlights seasonal cost variations. - Avg. Fuel Cost per KM USD by Month
Monitors fuel price impact over time.
Thanks to these trends, finance and operations teams can:
- Forecast future expenses
- Detect abnormal spikes
- Plan cost-saving strategies
Click to buy Office Vehicle Fleet Dashboard in Excel
Advantages of Office Vehicle Fleet Dashboard in Excel
Using this dashboard provides several business benefits. Let us explore them clearly.
Centralized Fleet Monitoring
Track vehicles, costs, mileage, and downtime from one Excel file.
Cost Optimization
Identify hidden expenses across departments, vendors, and regions.
Better Decision-Making
Make data-driven decisions instead of relying on assumptions.
Improved Accountability
Assign responsibility to departments and vendors easily.
No Expensive Software Required
Use Excel instead of costly fleet management systems.
Easy Customization
Modify KPIs, charts, and layouts as per business needs.
Time Saving
Reduce manual reporting and repetitive calculations.
Who Can Use an Office Vehicle Fleet Dashboard?
This dashboard suits multiple roles and industries.
- Corporate administration teams
- Logistics and operations managers
- Facility and asset managers
- Finance and accounts teams
- HR transport coordinators
- Manufacturing and service companies
Because Excel remains universal, teams can adopt it quickly without training overhead.
What Data Is Required to Build This Dashboard?
To run this dashboard efficiently, organizations should maintain structured fleet data.
Typical Data Points Include
- Vehicle ID and type
- Department and region
- Vendor name
- Fuel type
- KM run
- Fuel cost
- Maintenance cost
- Insurance cost
- Purchase cost
- Downtime days
- Date or month
Once this data is available, Excel automatically generates insights.
Best Practices for the Office Vehicle Fleet Dashboard in Excel
Following best practices ensures accuracy and long-term value.
Keep Data Structured
Use clean tables with consistent headers.
Update Data Regularly
Update fuel, maintenance, and usage data monthly.
Use Standard Units
Maintain consistent currency, distance, and fuel units.
Review Dashboards Monthly
Conduct monthly cost and performance reviews.
Set Benchmarks
Define acceptable operating cost and mileage targets.
Track Downtime Closely
Reduce productivity losses caused by vehicle unavailability.
Limit Manual Overrides
Rely on formulas instead of manual editing.
How Does This Dashboard Support Business Growth?
Fleet expenses directly affect operational efficiency. When businesses control these costs, profitability improves.
With this dashboard:
- Finance teams control budgets
- Operations teams optimize routes
- Management improves ROI on vehicle investments
- Organizations reduce unnecessary asset growth
As a result, companies scale their operations sustainably.
Conclusion: Why Every Organization Needs an Office Vehicle Fleet Dashboard in Excel
Managing office vehicles manually no longer works in a data-driven world. Costs rise silently, inefficiencies stay hidden, and reporting takes too much time.
The Office Vehicle Fleet Dashboard in Excel solves these challenges by providing:
- Complete visibility
- Cost control
- Operational clarity
- Easy adoption
Because it works entirely in Excel, organizations avoid expensive software and still gain powerful insights.
If your organization uses multiple vehicles, this dashboard becomes a must-have performance management tool.
Frequently Asked Questions (FAQs)
What is an Office Vehicle Fleet Dashboard in Excel?
It is a ready-to-use Excel dashboard that tracks vehicle costs, usage, performance, and efficiency across departments, regions, vendors, and time periods.
Is this dashboard suitable for small organizations?
Yes. Small and medium businesses benefit greatly because Excel remains affordable and flexible.
Do I need advanced Excel skills to use it?
No. Basic Excel knowledge works fine since the dashboard is already built and automated.
Can I customize the dashboard KPIs?
Yes. You can modify KPIs, add charts, or adjust formulas as per your business requirements.
How often should I update the data?
You should update data monthly for accurate trend analysis and cost control.
Can this dashboard replace fleet management software?
For many organizations, yes. It offers strong reporting and cost tracking without licensing costs.
Does the dashboard support multiple fuel types?
Yes. It supports petrol, diesel, CNG, electric, and hybrid fuel categories.
Can I use this dashboard for multiple regions?
Absolutely. The dashboard includes region-wise analysis and scaling capability.
Visit our YouTube channel to learn step-by-step video tutorials
Watch the step-by-step video tutorial:
Click to buy Office Vehicle Fleet Dashboard in Excel