Running a home décor store involves more than selling beautiful products. Store owners must track sales, margins, inventory, customer behavior, and operational efficiency every single month. However, when data stays scattered across multiple Excel files, decision-making becomes slow and inaccurate. That is why businesses now rely on a Home Decor Stores KPI Dashboard in Excel.
A Home Decor Stores KPI Dashboard in Excel helps store owners, managers, and retail analysts monitor performance using clear KPIs, visuals, and trend analysis. Moreover, because this dashboard works entirely in Microsoft Excel, it remains affordable, easy to use, and highly flexible.
In this detailed article, you will learn what a Home Decor Stores KPI Dashboard in Excel is, how it works, why it matters, its structure, advantages, best practices, and frequently asked questions. Additionally, the article expands your existing content creatively while keeping it practical and SEO-friendly.
Click to Purchases Home Decor Stores KPI Dashboard in Excel
What Is a Home Decor Stores KPI Dashboard in Excel?
A Home Decor Stores KPI Dashboard in Excel is a ready-to-use Excel-based reporting tool designed to track and analyze key performance indicators for home décor retail stores.
Instead of checking multiple worksheets manually, this dashboard consolidates sales, targets, trends, and year-over-year comparisons into one interactive view. As a result, store managers can instantly understand performance without spending hours on calculations.
Most importantly, since the dashboard uses Excel formulas, dropdowns, and conditional formatting, users do not need advanced technical skills.
Why Do Home Decor Stores Need a KPI Dashboard in Excel?
Home décor retail operates in a highly competitive environment. Therefore, store owners must track performance continuously to stay profitable.
A Home Decor Stores KPI Dashboard in Excel helps businesses:
-
Monitor MTD and YTD sales performance
-
Compare actual results against targets
-
Track previous year performance
-
Identify underperforming KPIs quickly
-
Improve planning and forecasting
-
Make faster, data-driven decisions
Moreover, Excel dashboards eliminate guesswork and bring clarity to retail operations.
How Does the Home Decor Stores KPI Dashboard in Excel Work?
The dashboard works using a structured worksheet design. Users enter data in dedicated input sheets, while the dashboard automatically updates calculations and visuals.
Simple Working Flow
-
Enter KPI definitions once
-
Update actual, target, and previous year numbers monthly
-
Select the month from a dropdown
-
Review MTD and YTD performance instantly
-
Analyze trends and take action
Because of this flow, the dashboard stays easy to maintain and reliable.
Click to Purchases Home Decor Stores KPI Dashboard in Excel
What Worksheets Are Included in the Home Decor Stores KPI Dashboard?
This dashboard contains 7 well-organized worksheets, each serving a specific purpose.
What Is the Role of the Home Sheet?
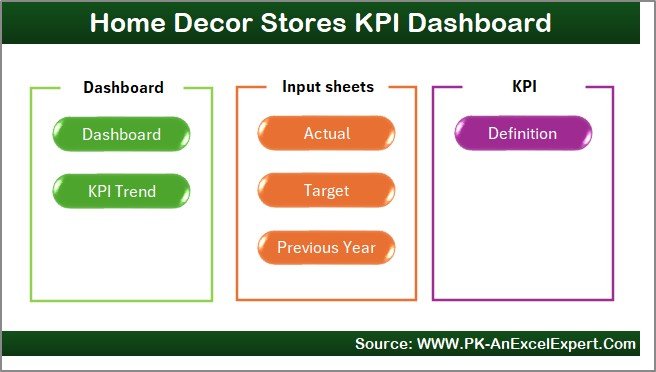
The Home Sheet acts as an index page for the dashboard.
Key Features of the Home Sheet
-
Clean and simple layout
-
6 navigation buttons
-
One-click access to all major sheets
This design improves usability and saves time.
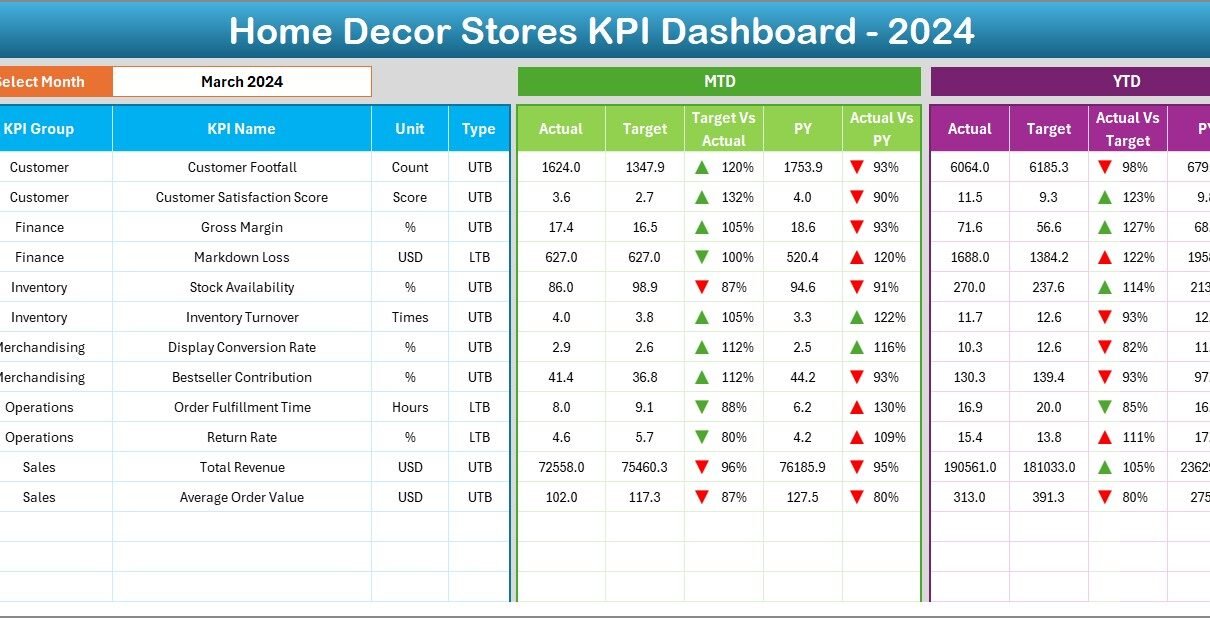
What Does the Dashboard Sheet Show?
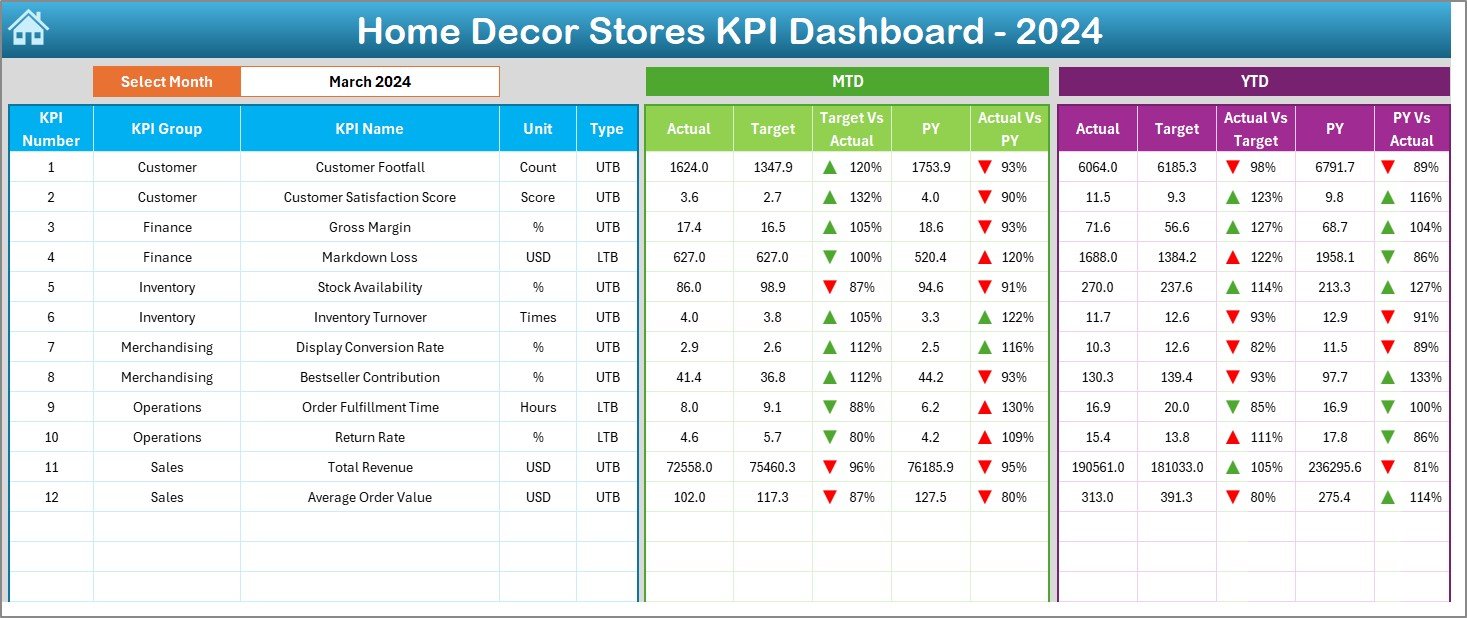
The Dashboard Sheet is the main analysis page.
Month Selection Feature
-
Month dropdown available at cell D3
-
Selecting a month updates the entire dashboard automatically
This dynamic behavior ensures accurate monthly analysis.
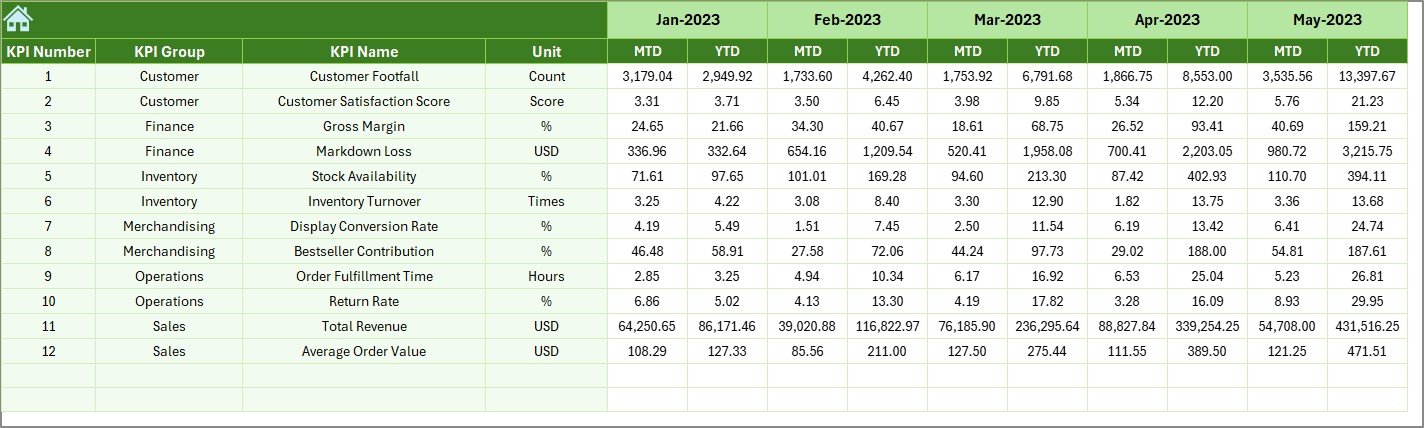
KPI Performance Analysis on Dashboard Sheet
On this sheet, you can see:
-
MTD Actual
-
MTD Target
-
MTD Previous Year
-
Target vs Actual (MTD) with up/down arrows
-
PY vs Actual (MTD) with indicators
-
YTD Actual
-
YTD Target
-
YTD Previous Year
-
Target vs Actual (YTD)
-
PY vs Actual (YTD)
Because of conditional formatting arrows, users can immediately spot positive or negative performance.
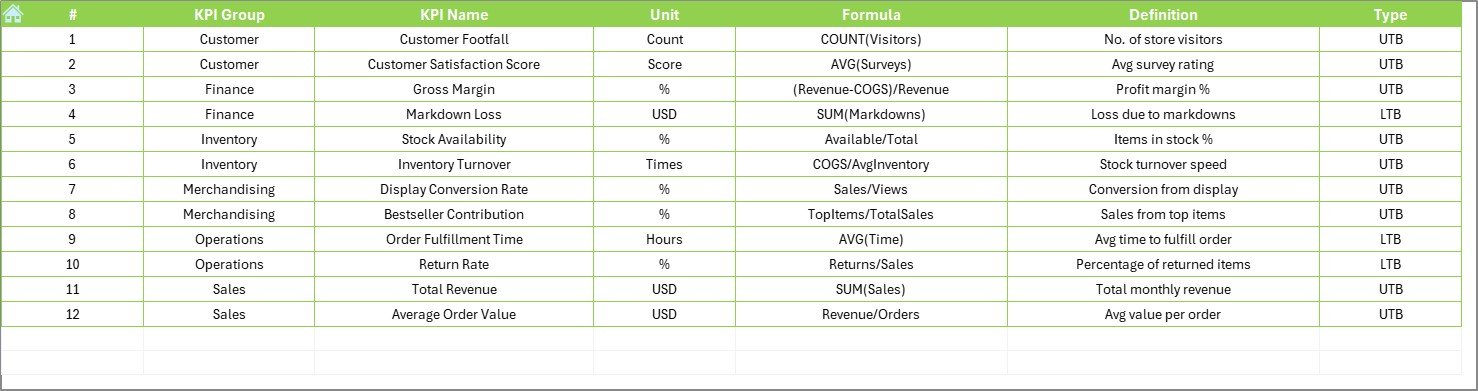
How Does the KPI Trend Sheet Help Store Analysis?
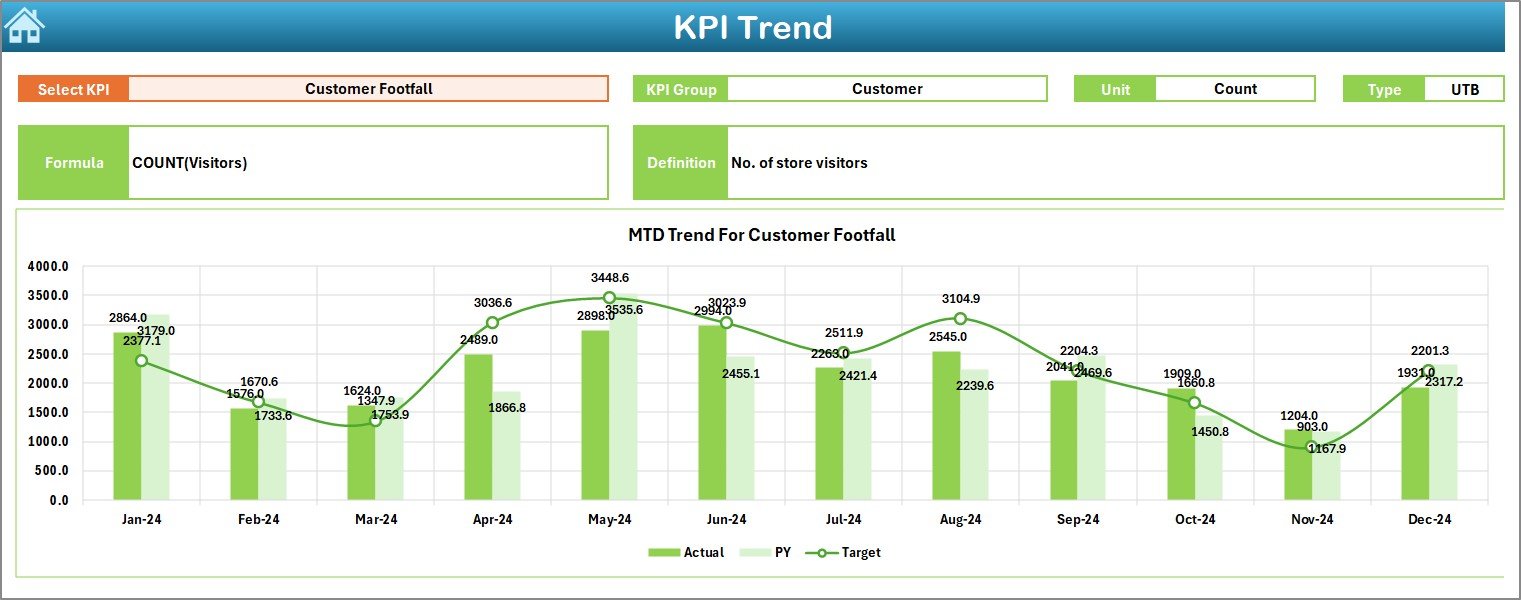
The KPI Trend Sheet focuses on deeper KPI understanding.
Dropdown-Based KPI Selection
-
KPI Name dropdown at cell C3
-
Selecting a KPI updates all details dynamically
KPI Details Displayed
-
KPI Group
-
Unit of KPI
-
KPI Type (Upper the Better / Lower the Better)
-
KPI Formula
-
KPI Definition
This section ensures clarity and avoids misinterpretation.
Trend Charts on KPI Trend Sheet
The sheet displays:
-
MTD Trend Chart (Actual, Target, PY)
-
YTD Trend Chart (Actual, Target, PY)
These charts help identify growth patterns, seasonality, and performance gaps.
What Is the Purpose of the Actual Numbers Input Sheet?
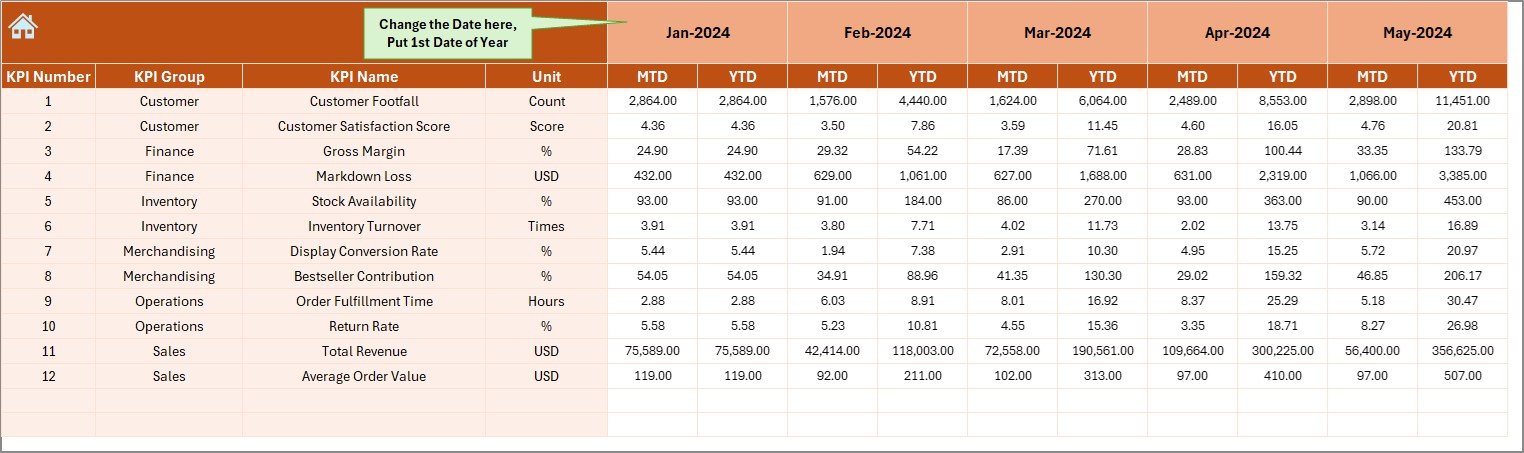
The Actual Numbers Input Sheet captures real performance data.
How to Use This Sheet
-
Enter MTD and YTD actual values
-
Change the reporting month from cell E1
-
Always enter the first month of the year in cell E1
This structure ensures accurate month-based calculations.
How Does the Target Sheet Support Performance Tracking?
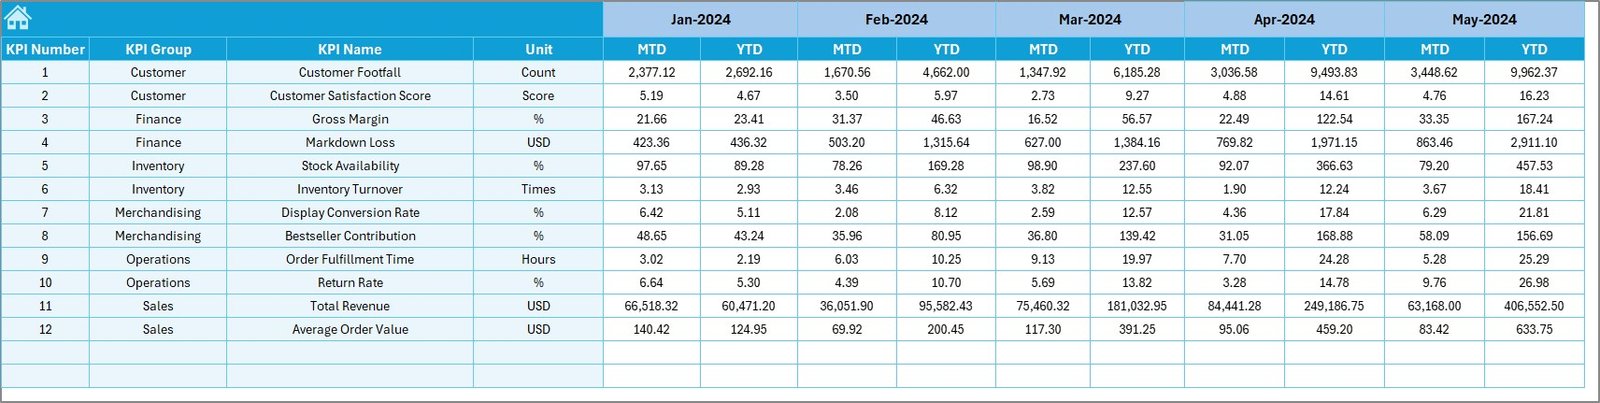
The Target Sheet stores planned KPI values.
What to Enter in Target Sheet
-
KPI-wise MTD targets
-
KPI-wise YTD targets
-
Monthly target planning
This sheet allows clear comparison between expected and actual performance.
Why Is the Previous Year Number Sheet Important?
The Previous Year Number Sheet enables year-over-year analysis.
Key Benefits
-
Tracks last year’s MTD values
-
Tracks last year’s YTD values
-
Supports growth and decline analysis
Because of this sheet, stores can measure improvement realistically.
What Information Goes into the KPI Definition Sheet?
The KPI Definition Sheet acts as a master reference.
Columns Included
-
KPI Name
-
KPI Group
-
Unit
-
Formula
-
KPI Definition
This sheet ensures consistency and standard understanding across the organization.
Click to Purchases Home Decor Stores KPI Dashboard in Excel
Advantages of Home Decor Stores KPI Dashboard in Excel
Using a Home Decor Stores KPI Dashboard in Excel offers multiple benefits.
Key Advantages
✅ Centralized KPI tracking in one file
✅ Clear MTD and YTD performance visibility
✅ Target vs actual comparison
✅ Previous year performance analysis
✅ Easy Excel-based data entry
✅ No additional software required
✅ Faster retail decision-making
✅ Improved store profitability
Because of these advantages, store owners gain control and confidence.
How Does This Dashboard Improve Retail Decision-Making?
This dashboard turns raw data into actionable insights.
For example:
-
Store managers can identify slow months early
-
Owners can adjust promotions based on trends
-
Teams can focus on underperforming KPIs
-
Planning becomes more accurate and structured
As a result, decisions become proactive instead of reactive.
Click to Purchases Home Decor Stores KPI Dashboard in Excel
Best Practices for the Home Decor Stores KPI Dashboard in Excel
To maximize dashboard value, follow these best practices.
Best Practices You Should Follow
-
🔹 Define KPIs clearly before use
-
🔹 Update data monthly without delay
-
🔹 Use consistent KPI units and formulas
-
🔹 Avoid unnecessary KPIs
-
🔹 Validate data before analysis
-
🔹 Review trends, not just totals
-
🔹 Train staff on dashboard usage
Following these practices ensures long-term success.
Who Can Use a Home Decor Stores KPI Dashboard in Excel?
This dashboard suits many retail roles.
Ideal Users
-
Home décor store owners
-
Retail store managers
-
Sales and operations teams
-
Business analysts
-
Franchise managers
Because it runs on Excel, anyone can use it easily.
Why Choose Excel for Home Decor KPI Dashboards?
Excel remains one of the most trusted tools for retail analytics.
Excel Benefits
-
Widely available
-
Easy to customize
-
Powerful formulas and charts
-
No recurring software cost
-
Quick learning curve
Therefore, Excel dashboards remain practical and effective.
Conclusion: Why Every Home Decor Store Needs a KPI Dashboard in Excel
A Home Decor Stores KPI Dashboard in Excel provides clarity, control, and consistency in retail performance tracking. It transforms scattered data into meaningful insights using a structured and easy-to-use approach.
Moreover, it helps store owners track sales, monitor targets, analyze trends, and improve profitability without complexity. In today’s competitive retail environment, this dashboard becomes an essential business tool.
Click to Purchases Home Decor Stores KPI Dashboard in Excel
Frequently Asked Questions (FAQs)
What is a Home Decor Stores KPI Dashboard in Excel?
It is an Excel-based dashboard designed to track and analyze retail KPIs using MTD, YTD, target, and previous year data.
Can small home decor stores use this dashboard?
Yes, the dashboard works perfectly for both small and large stores.
How often should data be updated?
You should update the dashboard monthly for accurate analysis.
Do I need advanced Excel skills?
No, basic Excel knowledge is enough to use this dashboard.
Can I add new KPIs?
Yes, you can easily add or modify KPIs using the KPI Definition sheet.
Does the dashboard support year-over-year analysis?
Yes, it includes a dedicated Previous Year Number sheet.
Is this dashboard customizable?
Yes, you can customize KPIs, layouts, and formulas as needed.
Click to Purchases Home Decor Stores KPI Dashboard in Excel
Visit our YouTube channel to learn step-by-step video tutorials