Academic publishing plays a vital role in spreading knowledge, supporting research growth, and maintaining scholarly standards. However, managing publishing data using scattered spreadsheets often creates confusion, delays, and reporting gaps. Therefore, institutions, publishers, and research managers need a structured and analytical solution.
An Academic Publishing Dashboard in Excel solves this challenge effectively. It transforms raw publishing data into meaningful insights using interactive charts, KPI cards, and slicers. Moreover, it helps stakeholders track submissions, reviews, costs, revenue, and profitability from a single place.
In this detailed and SEO-friendly article, you will learn what an Academic Publishing Dashboard in Excel is, why it matters, how it works, its page-wise structure, key features, advantages, best practices, and frequently asked questions. The language remains simple, practical, and business-focused throughout.
Click to Purchases Academic Publishing Dashboard in Excel
What Is an Academic Publishing Dashboard in Excel?
An Academic Publishing Dashboard in Excel is a ready-to-use analytical tool designed to monitor and evaluate academic publishing performance. It consolidates data related to manuscript submissions, review acceptance, publication types, access models, costs, revenue, and profit margins into a single Excel file.
Instead of manually analyzing multiple reports, users can rely on dynamic visuals and slicers. As a result, decision-makers can quickly identify trends, compare performance, and improve publishing strategies.
Because it runs in Microsoft Excel, the dashboard remains accessible, flexible, and cost-effective for institutions of all sizes.
Why Is an Academic Publishing Dashboard Important?
Academic publishing involves multiple stakeholders, complex workflows, and financial considerations. However, without structured reporting, organizations often struggle to answer critical questions.
An Academic Publishing Dashboard helps because:
-
It centralizes publishing data in one place
-
It improves visibility across journals, publishers, and publication types
-
It tracks profitability and cost efficiency clearly
-
It supports data-driven editorial and financial decisions
Therefore, publishers and academic institutions gain control, transparency, and confidence in their publishing operations.
How Does an Academic Publishing Dashboard in Excel Work?
The dashboard works by connecting structured data from a backend Data Sheet and presenting insights through pivot-based charts and KPI cards. Moreover, slicers allow users to filter data instantly by publisher, journal type, publication type, region, access type, or month.
Because Excel recalculates charts automatically, users only need to update the data sheet. As a result, the entire dashboard refreshes without manual intervention.
Key Features of the Academic Publishing Dashboard in Excel
Before exploring each page, it is important to understand the overall design philosophy of this dashboard.
Page Navigator for Easy Navigation
The Page Navigator, located on the left side, allows users to switch between analytical pages instantly. Therefore, users do not waste time scrolling through sheets. Instead, they can jump directly to the required analysis.
Dashboard Structure: Page-Wise Explanation
The Academic Publishing Dashboard in Excel consists of 5 interactive pages, each designed for a specific analytical purpose.
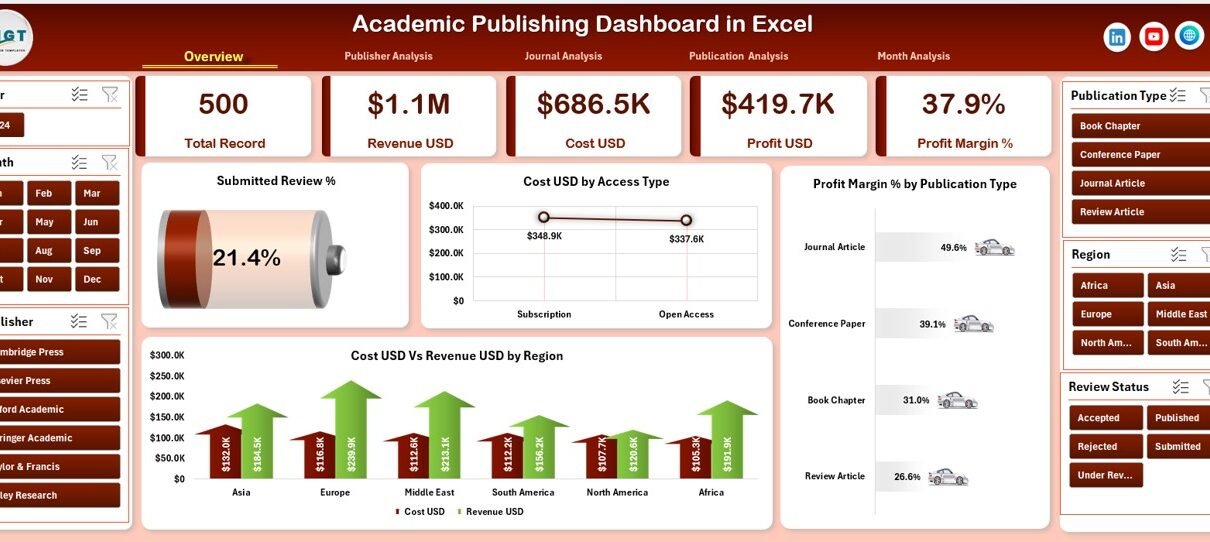
1. Overview Page: How Does It Summarize Publishing Performance?
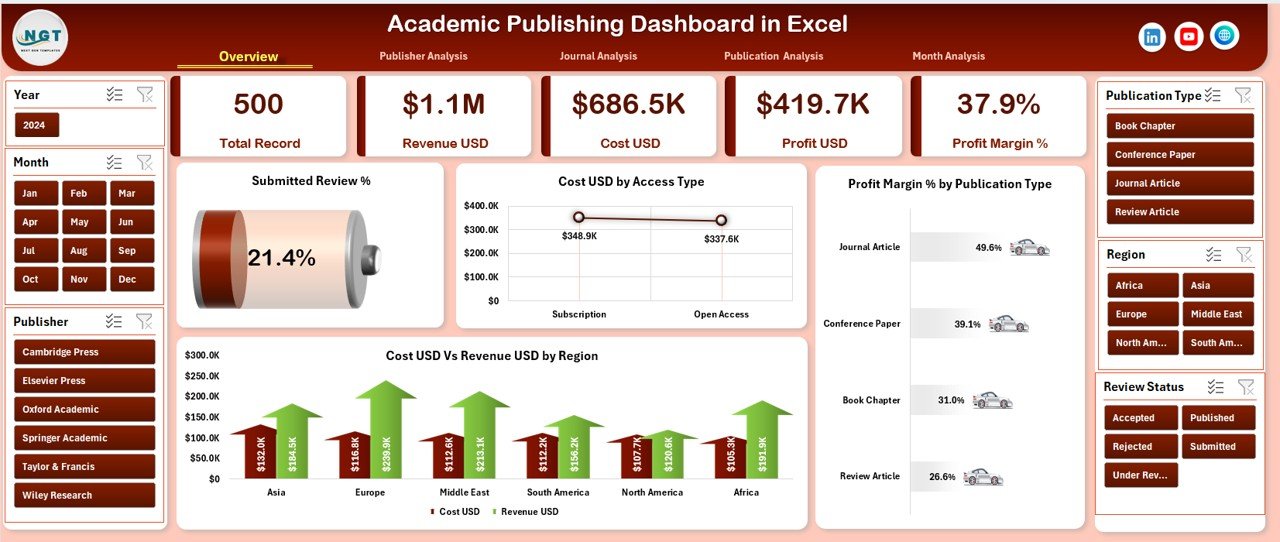
The Overview Page serves as the main landing page of the dashboard. It provides a high-level snapshot of academic publishing performance.
Key Elements of the Overview Page
Interactive Slicer
-
Located on the right side
-
Allows filtering by time, region, publisher, or publication type
KPI Cards (5 Cards)
These cards display key summary metrics at a glance, such as:
-
Total submissions
-
Accepted reviews
-
Total cost
-
Total revenue
-
Overall profit or margin
Charts on the Overview Page
-
Submitted Review %
Shows the percentage of submitted manuscripts that went through review, helping evaluate editorial throughput. -
Cost USD by Access Type
Compares publishing costs across open access and subscription-based models. -
Profit Margin % by Publication Type
Highlights profitability differences across journals, books, conferences, or articles. -
Cost USD vs Revenue USD by Region
Provides a regional comparison of expenses and earnings.
Because this page aggregates all key metrics, it helps leadership understand overall performance instantly.
Click to Purchases Academic Publishing Dashboard in Excel
2. Publisher Analysis: How Are Individual Publishers Performing?
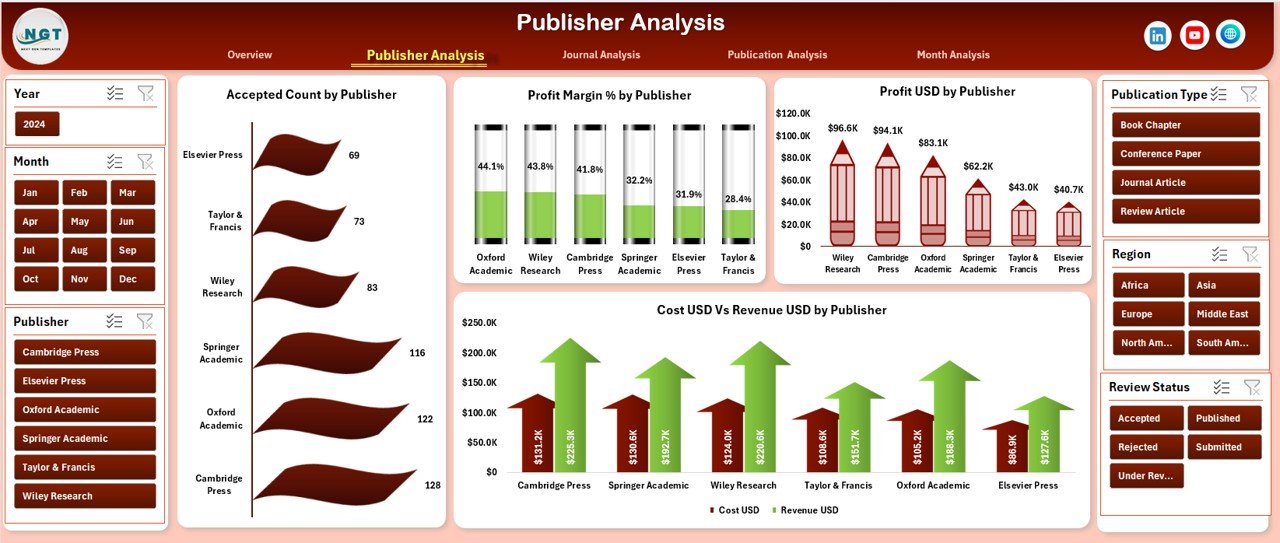
The Publisher Analysis Page focuses on performance comparison across publishers.
Key Components
Right-Side Slicer
Users can filter data by month, region, or publication category.
Charts Included
-
Accepted Count by Publisher
Displays how many manuscripts each publisher accepts. -
Profit Margin % by Publisher
Compares publisher-wise profitability. -
Profit USD by Publisher
Shows total profit contribution from each publisher. -
Cost USD vs Revenue USD by Publisher
Highlights cost efficiency and revenue generation side by side.
Therefore, this page helps identify high-performing and underperforming publishers clearly.
3. Journal Analysis: Which Journal Types Deliver Better Results?
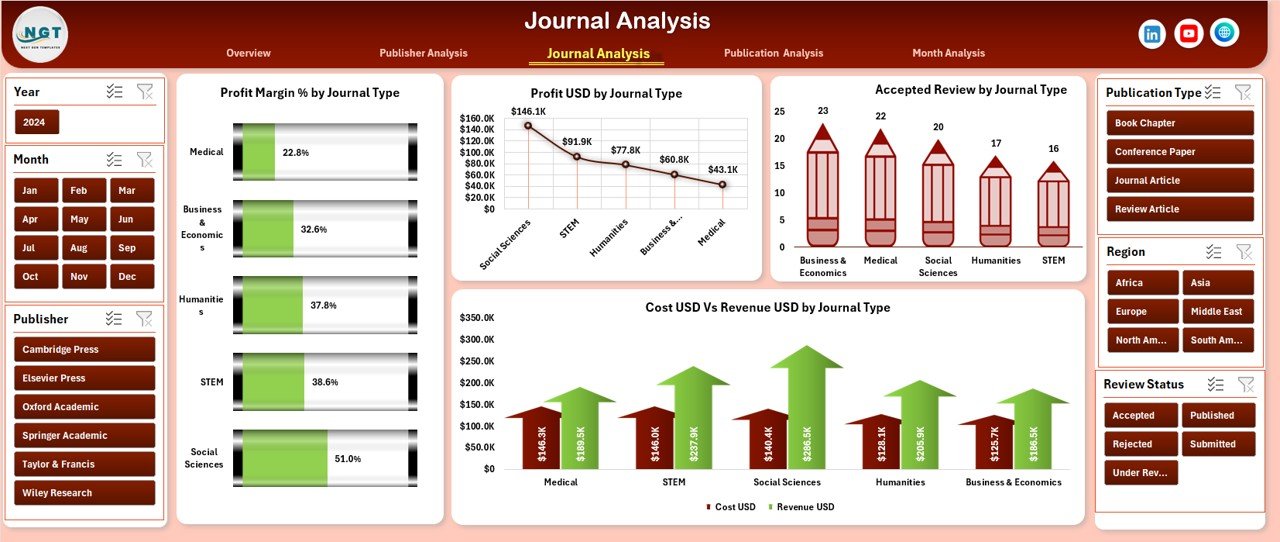
The Journal Analysis Page evaluates performance based on journal categories.
Right-Side Slicer
Allows filtering by period, publisher, or access type.
Charts on Journal Analysis Page
-
Profit Margin % by Journal Type
Compares margins across different journal categories. -
Profit USD by Journal Type
Highlights which journal types generate maximum profit. -
Accepted Review by Journal Type
Shows acceptance volume for each journal type. -
Cost USD vs Revenue USD by Journal Type
Helps analyze cost-to-revenue balance.
As a result, academic institutions can optimize their journal portfolio effectively.
4. Publication Analysis: Which Publication Types Are Most Profitable?
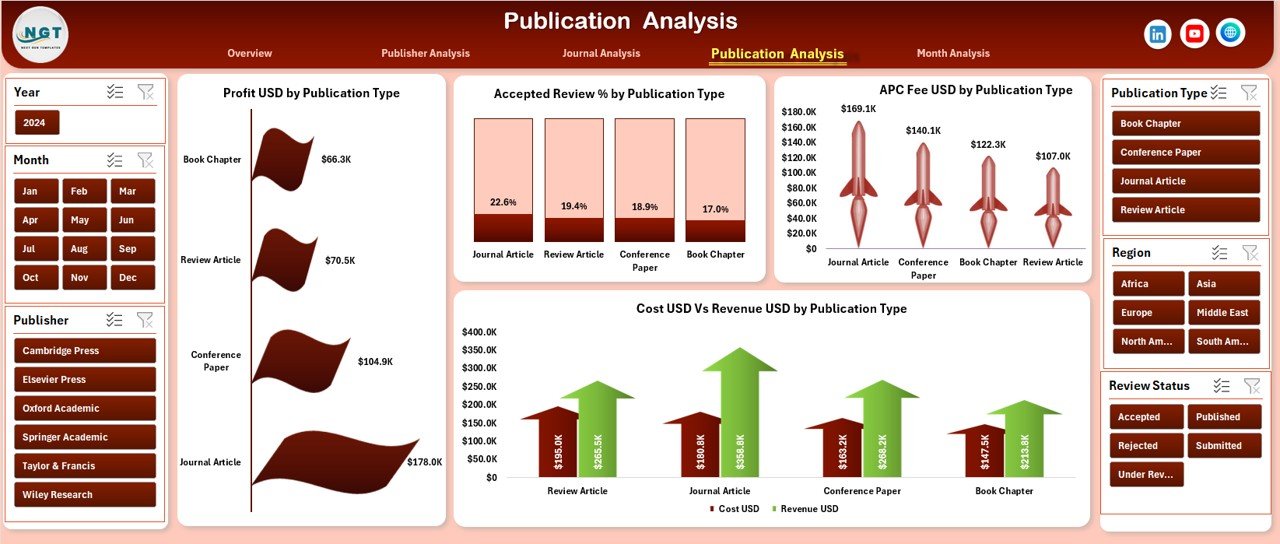
The Publication Analysis Page focuses on publication formats.
Slicer on the Right Side
Filters data dynamically by month, publisher, or region.
Charts Included
-
Profit USD by Publication Type
Shows profit contribution from articles, journals, books, or proceedings. -
Accepted Review % by Publication Type
Highlights acceptance efficiency across formats. -
APC Fee USD by Publication Type
Compares article processing charges by publication format. -
Cost USD vs Revenue USD by Publication Type
Provides a clear cost-revenue comparison.
Therefore, this page supports strategic pricing and publication planning.
Click to Purchases Academic Publishing Dashboard in Excel
5. Month Analysis: How Does Publishing Performance Change Over Time?
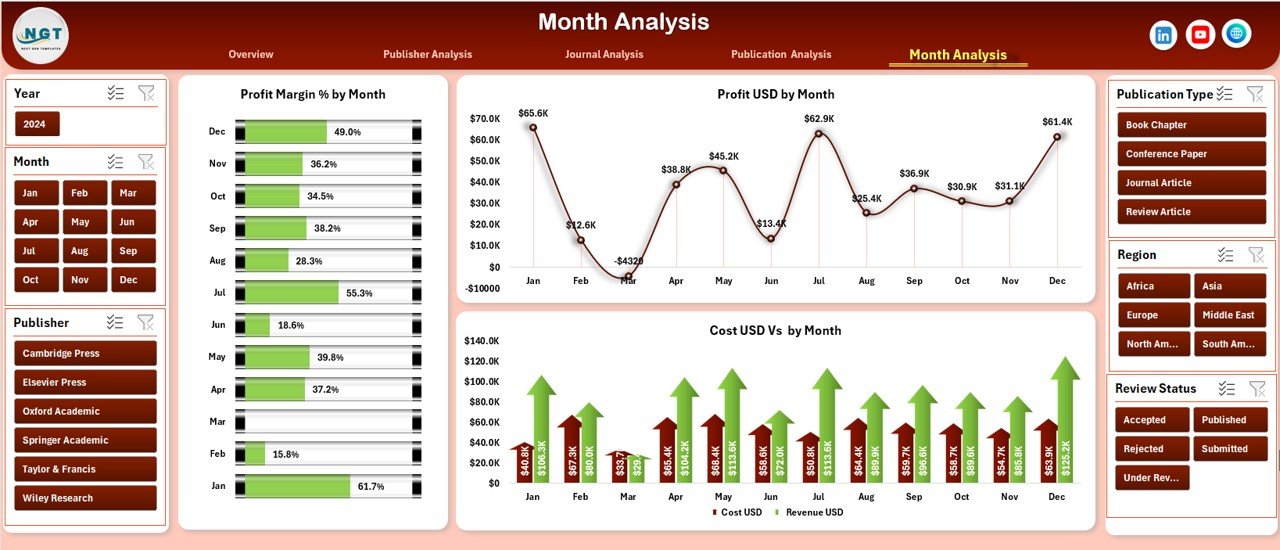
The Month Analysis Page tracks trends over time.
Right-Side Slicer
Allows filtering by year, publisher, or publication type.
Charts on Month Analysis Page
-
Profit Margin % by Month
Shows monthly profitability trends. -
Profit USD by Month
Highlights seasonal revenue or profit patterns. -
Cost USD vs Revenue USD by Month
Compares monthly expenses and earnings.
Because trends matter in academic publishing, this page supports forecasting and planning.
Support Sheets in the Dashboard
Data Sheet
The Data Sheet acts as the backbone of the dashboard. It stores all transactional and master data, such as:
-
Submission date
-
Publisher name
-
Journal type
-
Publication type
-
Access type
-
Cost USD
-
Revenue USD
-
Profit USD
-
Month and year fields
Once users update this sheet, all charts refresh automatically.
Advantages of Academic Publishing Dashboard in Excel
Using an Academic Publishing Dashboard in Excel offers several benefits.
Key Advantages
-
✅ Centralized publishing analytics in one file
-
✅ Easy to use and update without technical skills
-
✅ Real-time performance tracking
-
✅ Improved cost and profit visibility
-
✅ Faster editorial and financial decisions
-
✅ No need for expensive BI tools
-
✅ Fully customizable based on organizational needs
Therefore, it becomes an ideal solution for universities, publishers, and research organizations.
Who Should Use an Academic Publishing Dashboard in Excel?
This dashboard is useful for multiple stakeholders.
Ideal Users Include
-
Academic publishers
-
University research offices
-
Editorial boards
-
Finance and revenue teams
-
Research administrators
-
Scholarly publishing consultants
Because the dashboard remains flexible, it adapts easily to different organizational sizes and publishing models.
Best Practices for the Academic Publishing Dashboard in Excel
To get maximum value from the dashboard, follow these best practices.
1. Maintain Clean and Consistent Data
Always ensure consistent naming for publishers, journals, and publication types. Otherwise, charts may show inaccurate results.
2. Update the Data Sheet Regularly
Frequent updates ensure real-time insights. Therefore, assign responsibility to a specific team.
3. Use Slicers Strategically
Apply slicers to compare specific periods, publishers, or publication types quickly.
4. Review Profitability Monthly
Monthly analysis helps detect early cost overruns or revenue drops.
5. Customize KPIs as Needed
Adjust KPIs based on institutional goals, such as acceptance rate, APC recovery, or regional growth.
6. Protect Key Formulas
Lock calculation cells to avoid accidental changes.
Opportunities for Improvement in Academic Publishing Dashboards
Although Excel dashboards work efficiently, organizations can enhance them further.
Possible Improvements
-
Adding forecast and trend projections
-
Integrating automated data imports
-
Including reviewer turnaround time metrics
-
Adding author satisfaction scores
-
Linking dashboards with Power BI for scalability
These enhancements further improve analytical depth.
Conclusion
An Academic Publishing Dashboard in Excel is a powerful, practical, and cost-effective solution for managing publishing performance. It simplifies complex data, improves transparency, and supports informed decision-making.
By using structured pages like Overview, Publisher Analysis, Journal Analysis, Publication Analysis, and Month Analysis, stakeholders gain complete visibility into costs, revenue, profit margins, and acceptance trends. Moreover, Excel’s flexibility ensures easy customization and long-term usability.
For academic institutions and publishers aiming to optimize performance without investing in complex tools, this dashboard remains an excellent choice.
Frequently Asked Questions (FAQs)
1. What is an Academic Publishing Dashboard in Excel used for?
It is used to analyze submissions, acceptance rates, costs, revenue, and profitability of academic publishing activities in one place.
2. Can non-technical users use this dashboard?
Yes, because it works entirely in Excel and uses slicers and charts, non-technical users can operate it easily.
3. Can I customize the dashboard for my institution?
Absolutely. You can modify KPIs, charts, slicers, and layouts based on your publishing requirements.
4. How often should the data be updated?
Ideally, update the data weekly or monthly to maintain accurate insights.
5. Does this dashboard support multiple publishers and journals?
Yes, it supports multiple publishers, journal types, publication types, regions, and access models.
6. Is Excel sufficient for academic publishing analytics?
For small to medium-scale operations, Excel dashboards provide excellent performance, flexibility, and affordability.
Visit our YouTube channel to learn step-by-step video tutorials