In today’s unpredictable business environment, disruptions can happen at any time. Natural disasters, cyberattacks, system failures, supply chain breakdowns, or even regional shutdowns can stop operations instantly. Therefore, organizations must prepare in advance to protect people, processes, and profits. That is exactly where a Business Continuity Planning Dashboard in Power BI becomes a critical decision-making tool.
This detailed, SEO-friendly guide explains what a Business Continuity Planning Dashboard in Power BI is, why it matters, how it works, its page-wise structure, key advantages, best practices, and frequently asked questions. Moreover, the language remains simple, clear, and practical so that business leaders, risk managers, IT teams, and analysts can apply it easily.
Click to Purchases Business Continuity Planning Dashboard in Power BI
What Is a Business Continuity Planning Dashboard in Power BI?
A Business Continuity Planning (BCP) Dashboard in Power BI is an interactive analytics solution that helps organizations monitor, analyze, and manage continuity readiness from a single centralized dashboard.
Instead of reviewing scattered Excel files, PDFs, or static reports, decision-makers can instantly view:
-
Business continuity preparedness
-
Recovery performance
-
Downtime impact
-
Financial loss exposure
-
Risk-wise and region-wise continuity status
Because Power BI provides interactive visuals and slicers, users can filter data by region, business unit, risk type, or time period and gain real-time insights quickly.
As a result, organizations improve response time, reduce operational risk, and strengthen resilience.
Why Do Organizations Need a Business Continuity Planning Dashboard?
Business continuity planning does not work effectively without visibility. However, many organizations still track BCP activities manually. Consequently, they struggle during actual incidents.
A Business Continuity Planning Dashboard in Power BI solves this problem by offering clarity and control.
Common Challenges Without a BCP Dashboard
-
Lack of centralized continuity data
-
Delayed recovery during incidents
-
Poor visibility into downtime and financial impact
-
Inconsistent BCP implementation across regions
-
Difficulty tracking risk exposure over time
Therefore, organizations need a structured, data-driven dashboard to stay prepared at all times.
How Does a Business Continuity Planning Dashboard in Power BI Work?
The dashboard typically uses Excel or database tables as data sources and Power BI Desktop for visualization. Once the data is loaded, Power BI transforms raw records into meaningful KPIs, charts, and trends.
Key Data Elements Used
-
Incident date
-
Business unit
-
Region
-
Risk type
-
Recovery time (hours)
-
Downtime hours
-
Financial impact (USD)
-
BCP status (Active / Planned)
-
Impact level
-
Month and year
After that, Power BI visuals automatically update based on slicer selections.
As a result, users gain instant insights without manual calculations.
What Are the Key Pages in a Business Continuity Planning Dashboard in Power BI?
Click to Purchases Business Continuity Planning Dashboard in Power BI
A well-designed Business Continuity Planning Dashboard in Power BI typically contains five structured pages, each focusing on a specific analysis area.
Let us explore each page in detail.
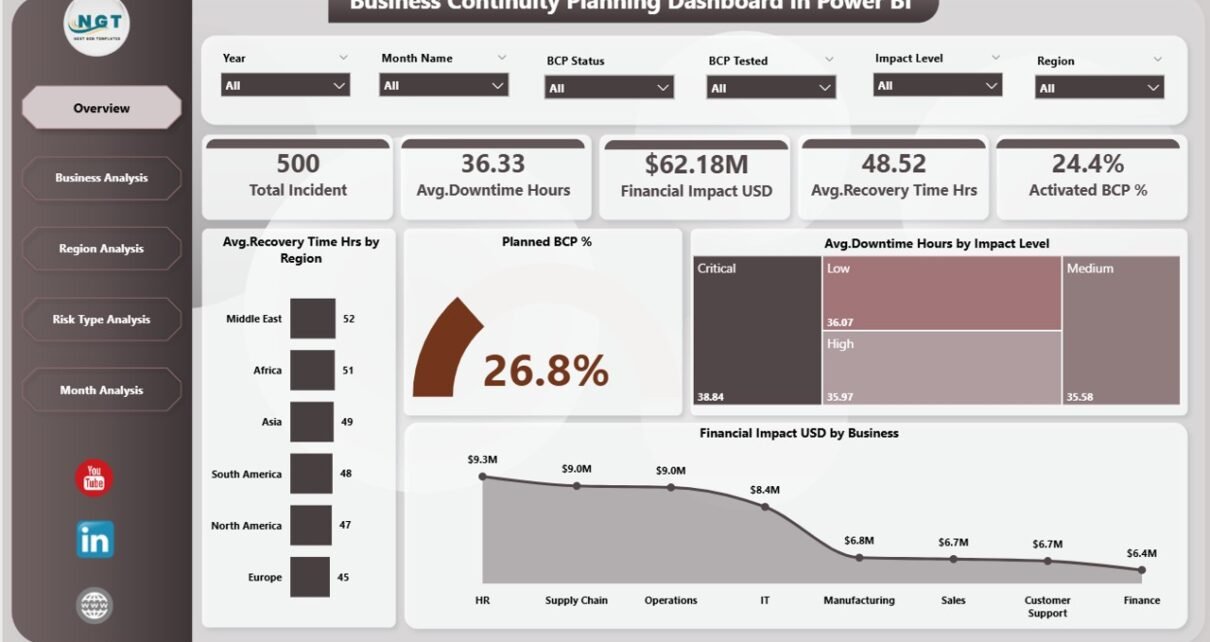
1. What Is Included in the Overview Page?
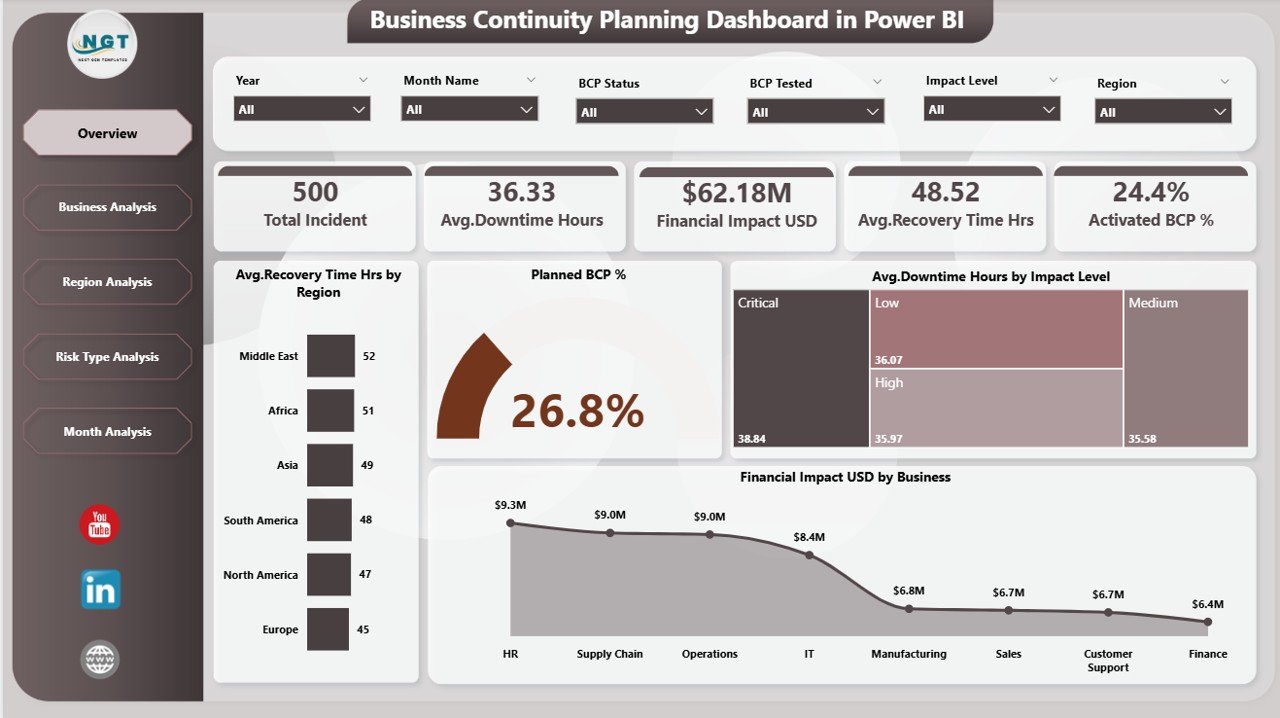
The Overview Page acts as the command center of the dashboard. It provides a high-level snapshot of business continuity performance.
Key Elements on the Overview Page
Slicers
-
Region
-
Business
-
Risk Type
-
Time Period
KPI Cards
-
Average Recovery Time (Hours)
-
Planned BCP Percentage
-
Average Downtime Hours
-
Total Financial Impact (USD)
Charts
-
Average Recovery Time (Hours) by Region
-
Planned BCP %
-
Average Downtime Hours by Impact Level
-
Financial Impact (USD) by Business
Why the Overview Page Matters
Because leaders need quick answers, this page helps them:
-
Identify high-risk regions instantly
-
Track continuity preparedness at a glance
-
Spot businesses causing major financial exposure
Therefore, the overview page supports fast and confident decision-making.
2. What Does the Business Analysis Page Show?
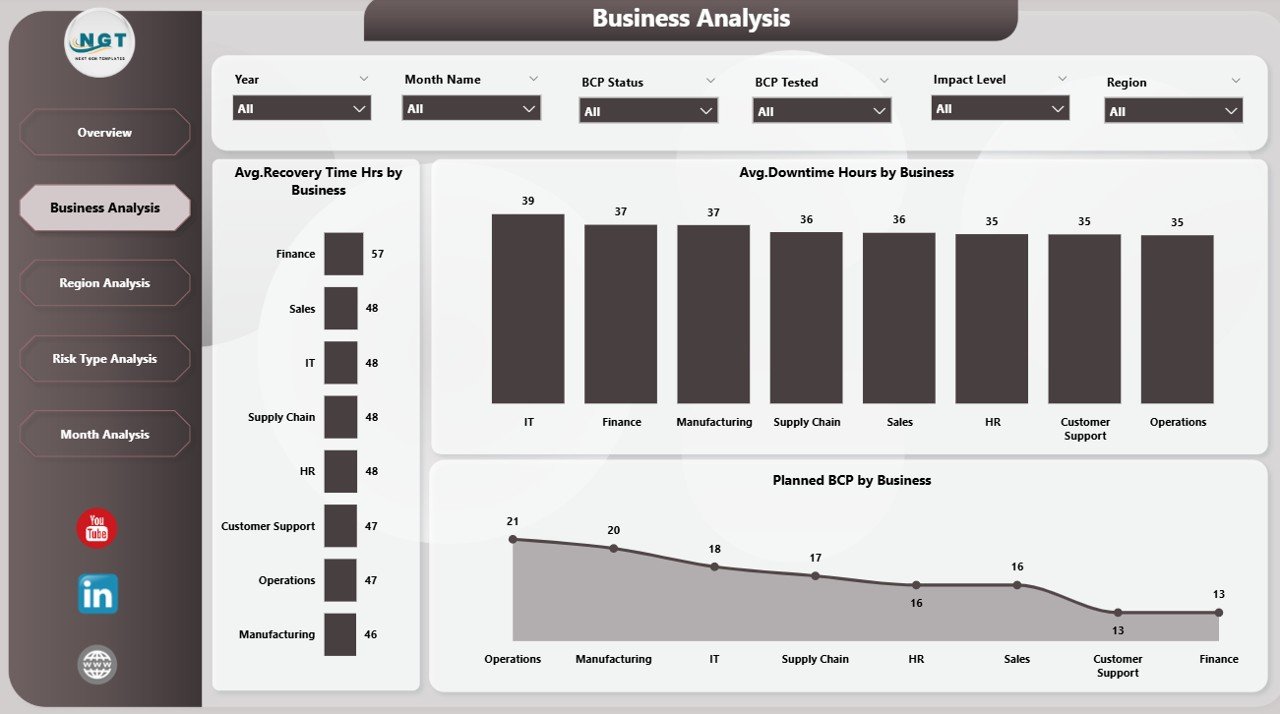
The Business Analysis Page focuses on continuity performance across different business units.
Charts on the Business Analysis Page
-
Average Recovery Time (Hours) by Business
-
Planned BCP % by Business
-
Average Downtime Hours by Business
Key Insights from Business Analysis
This page helps organizations:
-
Compare recovery performance between departments
-
Identify business units with weak continuity planning
-
Prioritize investments in high-risk functions
As a result, leadership can allocate resources strategically instead of guessing.
Click to Purchases Business Continuity Planning Dashboard in Power BI
3. How Does the Region Analysis Page Help Decision-Makers?
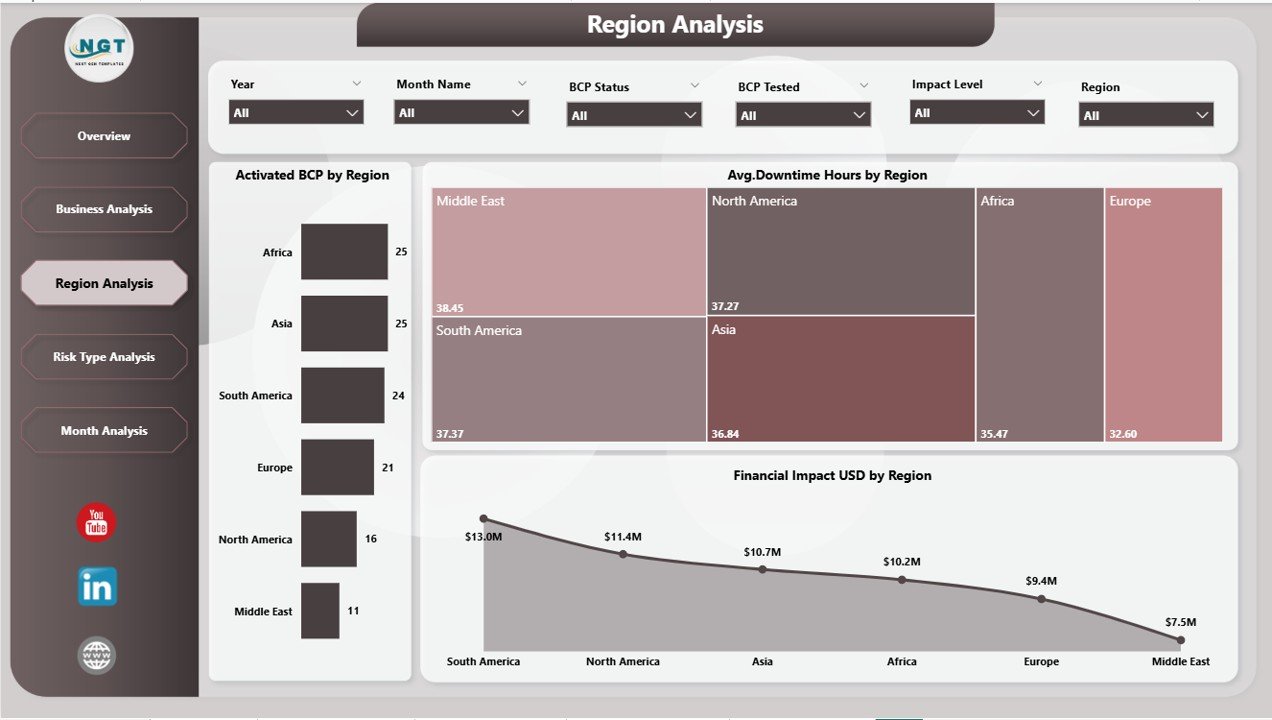
The Region Analysis Page provides a geographical view of business continuity readiness.
Charts on the Region Analysis Page
-
Active BCP by Region
-
Average Downtime Hours by Region
-
Financial Impact (USD) by Region
Why Region Analysis Is Important
Disruptions affect regions differently. Therefore, this page helps organizations:
-
Identify regions with frequent incidents
-
Monitor financial exposure by geography
-
Improve regional continuity planning
Consequently, organizations strengthen resilience across all locations.
4. What Is the Purpose of the Risk Type Analysis Page?
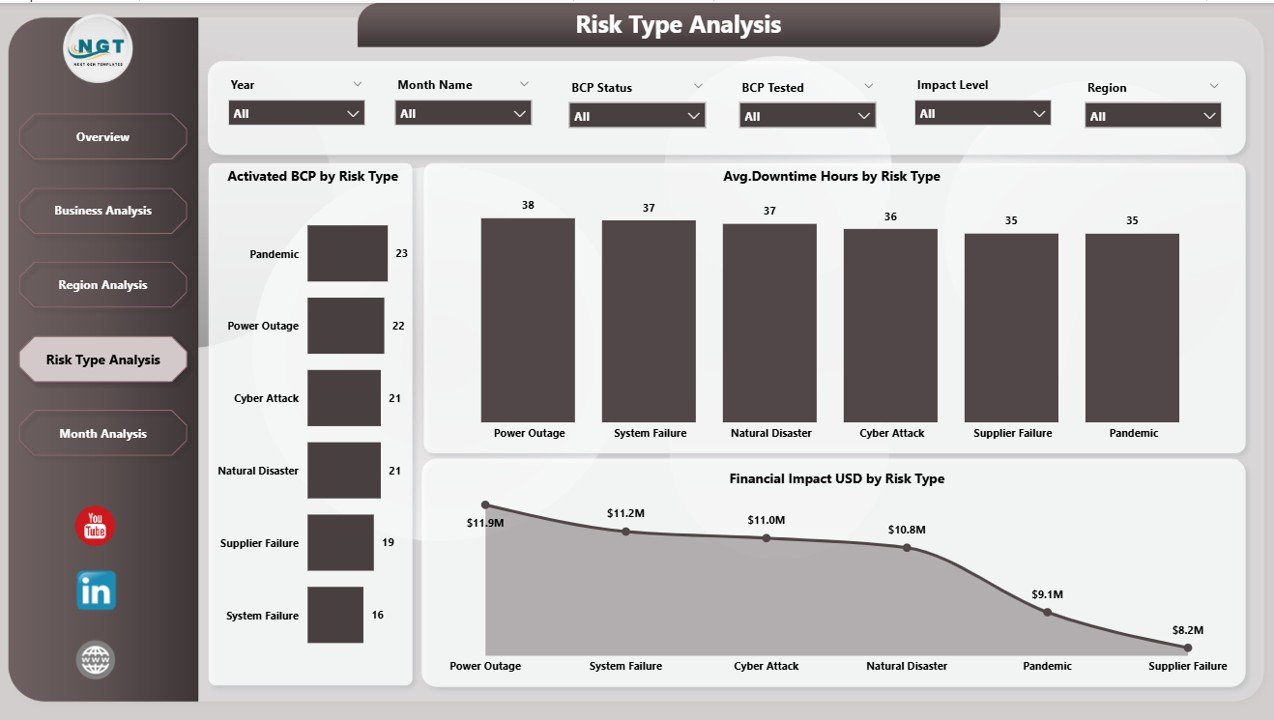
The Risk Type Analysis Page analyzes continuity performance based on different risk categories.
Common Risk Types
-
Cybersecurity
-
Natural disasters
-
System failures
-
Supply chain disruptions
-
Human errors
Charts on the Risk Type Analysis Page
-
Active BCP by Risk Type
-
Average Downtime Hours by Risk Type
-
Financial Impact (USD) by Risk Type
Value of Risk Type Analysis
This page enables organizations to:
-
Identify high-impact risk categories
-
Strengthen mitigation strategies
-
Improve risk-specific recovery planning
As a result, businesses reduce exposure before disruptions occur.
5. Why Is the Monthly Trends Page Critical?
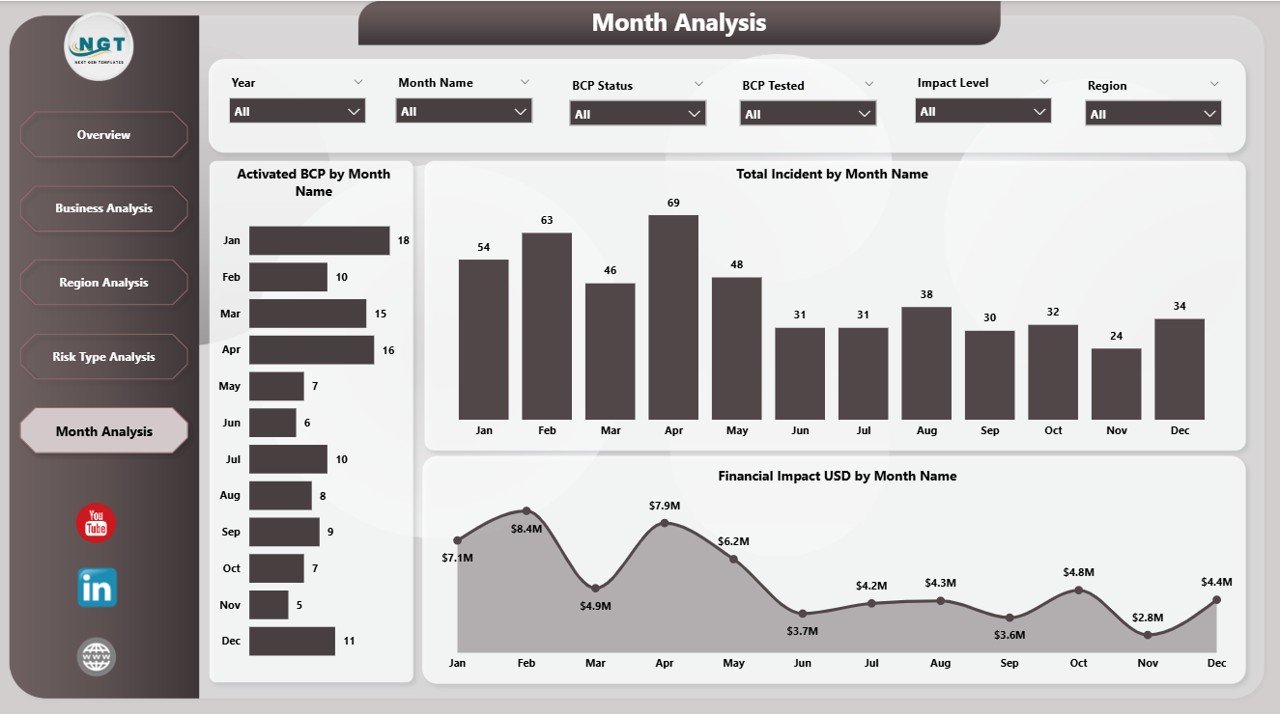
The Monthly Trends Page focuses on performance over time.
Charts on the Monthly Trends Page
-
Active BCP by Month
-
Total Incidents by Month
-
Financial Impact (USD) by Month
Benefits of Trend Analysis
With monthly trends, organizations can:
-
Identify seasonal risk patterns
-
Monitor improvement or decline in preparedness
-
Track financial impact trends over time
Therefore, leadership can take proactive action instead of reacting to incidents.
Advantages of Business Continuity Planning Dashboard in Power BI
Click to Purchases Business Continuity Planning Dashboard in Power BI
A Business Continuity Planning Dashboard in Power BI delivers measurable value across the organization.
Key Advantages
-
✅ Centralized continuity visibility
-
✅ Faster recovery decision-making
-
✅ Reduced downtime and financial loss
-
✅ Improved risk awareness
-
✅ Better regulatory and audit readiness
-
✅ Data-driven continuity planning
-
✅ Scalable for large enterprises
Moreover, Power BI makes the dashboard interactive, user-friendly, and visually appealing.
Who Should Use a Business Continuity Planning Dashboard?
This dashboard benefits multiple stakeholders.
Ideal Users
-
Business Continuity Managers
-
Risk Management Teams
-
IT Disaster Recovery Teams
-
Compliance and Audit Teams
-
Senior Leadership
-
Operations Managers
Because the dashboard uses clear visuals, even non-technical users can understand insights easily.
What KPIs Should You Track in a Business Continuity Planning Dashboard?
Choosing the right KPIs ensures meaningful analysis.
Common BCP KPIs
-
Average Recovery Time (Hours)
-
Downtime Hours
-
Planned BCP Percentage
-
Active BCP Count
-
Incident Count
-
Financial Impact (USD)
-
Risk Exposure Level
-
Region-wise Preparedness
When organizations track these KPIs consistently, they strengthen resilience significantly.
Best Practices for the Business Continuity Planning Dashboard in Power BI
To maximize value, organizations must follow best practices while building and using the dashboard.
1. Keep Data Clean and Consistent
Always standardize risk types, business names, and regions to avoid confusion.
2. Update Data Regularly
Frequent updates ensure the dashboard reflects real preparedness.
3. Use Clear KPI Definitions
Define each KPI clearly so all stakeholders interpret results correctly.
4. Limit Visual Clutter
Use only meaningful charts to maintain clarity and focus.
5. Leverage Slicers Smartly
Slicers improve interactivity and enable faster analysis.
6. Align Dashboard with BCP Objectives
Ensure visuals support recovery, mitigation, and preparedness goals.
7. Review Trends Periodically
Monthly and quarterly reviews help organizations stay proactive.
How Does Power BI Improve Business Continuity Planning?
Power BI adds intelligence to continuity planning.
Power BI Benefits
-
Interactive filtering
-
Real-time data refresh
-
Dynamic visuals
-
Easy sharing across teams
-
Secure access control
Because of these capabilities, Power BI becomes an ideal platform for continuity dashboards.
What Makes This Dashboard Business-Ready?
A Business Continuity Planning Dashboard in Power BI becomes business-ready when it:
-
Uses real operational data
-
Supports quick decisions
-
Aligns with risk frameworks
-
Works without complex IT dependency
As a result, organizations gain confidence during crises.
Conclusion: Why Every Organization Needs a Business Continuity Planning Dashboard in Power BI
Disruptions remain unavoidable. However, poor preparation is avoidable. A Business Continuity Planning Dashboard in Power BI transforms scattered continuity data into actionable insights.
By using structured pages such as Overview, Business Analysis, Region Analysis, Risk Type Analysis, and Monthly Trends, organizations gain full visibility into preparedness, recovery, and financial impact.
Therefore, businesses that adopt this dashboard strengthen resilience, protect revenue, and maintain operational stability even during uncertainty.
Frequently Asked Questions (FAQs)
1. What is the main purpose of a Business Continuity Planning Dashboard in Power BI?
The main purpose is to monitor preparedness, recovery performance, downtime, and financial impact from a centralized interactive dashboard.
2. Can small organizations use this dashboard?
Yes, small and medium organizations can scale the dashboard based on their data size and complexity.
3. Does the dashboard require live data connections?
Not necessarily. Organizations can use Excel, databases, or automated feeds depending on their setup.
4. How often should BCP data be updated?
Ideally, organizations should update data monthly or after every major incident.
5. Can the dashboard support audits and compliance?
Yes, because it provides documented metrics, trends, and evidence of continuity planning.
6. Is Power BI suitable for non-technical users?
Yes, Power BI dashboards use intuitive visuals and slicers that non-technical users can easily navigate.
7. What industries benefit most from this dashboard?
Industries such as banking, healthcare, manufacturing, IT, logistics, retail, and energy benefit significantly.
Visit our YouTube channel to learn step-by-step video tutorials