Science and technology parks play a vital role in innovation ecosystems. They connect startups, research institutions, universities, investors, and government bodies under one structured environment. However, managing such complex ecosystems without clear performance visibility often creates confusion, delays, and missed opportunities. Therefore, leaders increasingly rely on analytics-driven dashboards to monitor costs, funding, revenue, and satisfaction metrics in one place.
That is exactly where the Science & Technology Parks Dashboard in Power BI delivers powerful value.
Built using Microsoft Power BI, this dashboard transforms raw operational and financial data into meaningful, visual insights. As a result, decision-makers gain clarity, speed, and control over park operations, funding performance, and innovation outcomes.
Click to Purchases Science & Technology Parks Dashboard in Power BI
A Science & Technology Parks Dashboard in Power BI is a centralized performance monitoring system designed to track operational costs, funding flows, revenues, and satisfaction metrics across innovation parks.
Instead of relying on disconnected spreadsheets, manual reports, and static presentations, this dashboard brings everything into one interactive Power BI file. Consequently, stakeholders can analyze performance across departments, regions, research domains, funding sources, and time periods.
Moreover, the dashboard supports dynamic filtering, drill-down analysis, and visual storytelling. Therefore, leaders can quickly identify trends, risks, and growth opportunities.
Why Do Science & Technology Parks Need a Dashboard?
Science and technology parks manage diverse programs, tenants, funding sources, and research domains. However, complexity often increases as parks expand. As a result, leadership teams struggle to answer basic questions clearly.
For example:
-
Which technology sectors incur the highest costs?
-
Which regions attract the most funding?
-
How satisfied are participants across programs?
-
How does monthly performance change throughout the year?
A Power BI dashboard answers these questions instantly. Additionally, it supports data-driven planning, transparent reporting, and strategic decision-making.
Key Objectives of the Science & Technology Parks Dashboard
This dashboard focuses on clear, measurable goals. Therefore, it helps stakeholders achieve the following:
-
📊 Monitor annual costs, funding, and revenue in one place
-
🎯 Evaluate program-level and departmental performance
-
🌍 Compare regional and sector-wise outcomes
-
📈 Track monthly trends and growth patterns
-
😊 Measure satisfaction ratings across programs and sectors
Because of these objectives, the dashboard becomes an essential management and reporting tool.
Page-Wise Structure of the Science & Technology Parks Dashboard in Power BI
This dashboard includes five structured pages, each designed for a specific analytical purpose. Let us explore each page in detail.
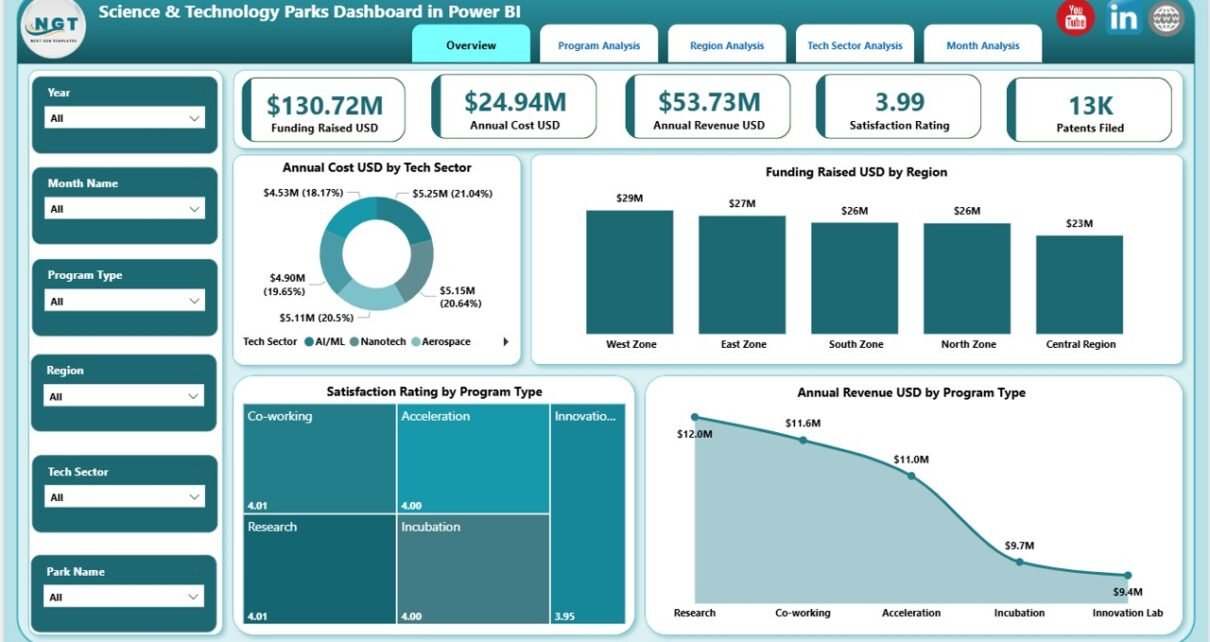
1. Overview Page: How Can You See the Big Picture Instantly?
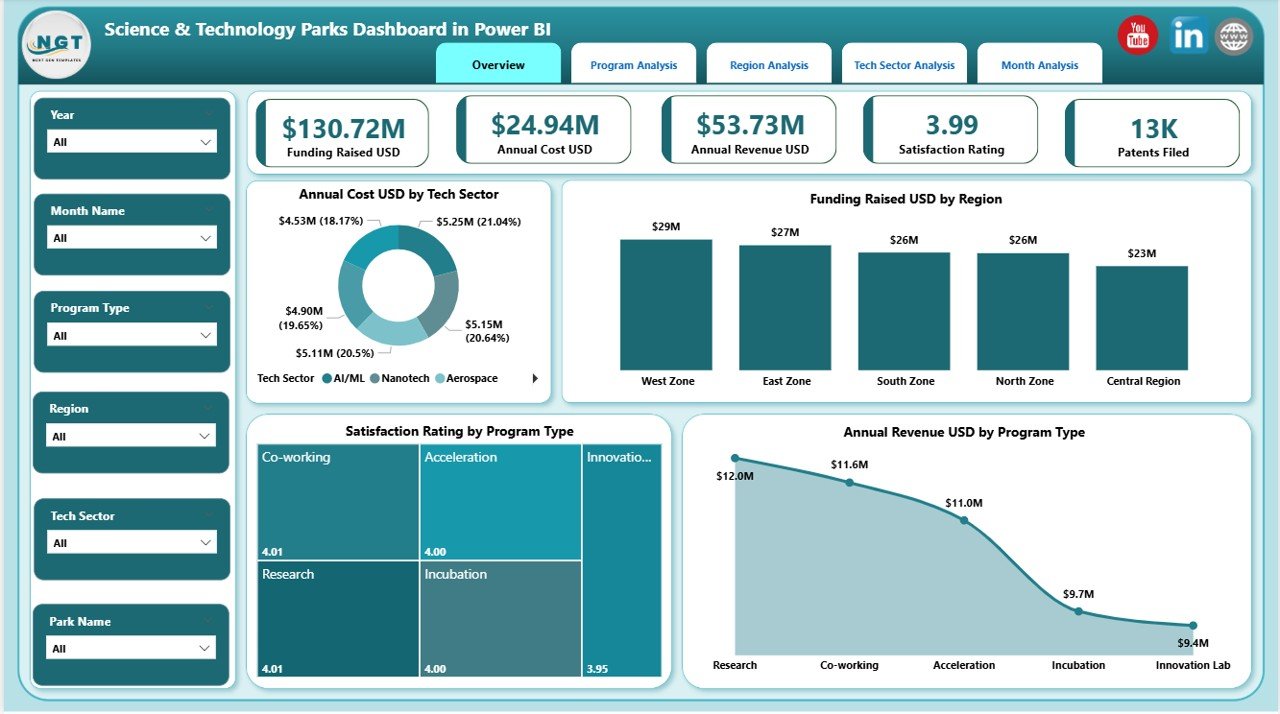
The Overview Page acts as the executive summary of the entire dashboard. As soon as users open the file, they see high-level insights that guide strategic discussions.
Key Elements on the Overview Page
Interactive Slicers
-
Filter data by key dimensions such as year, region, sector, or program
-
Instantly update all visuals across the page
-
Click to Purchases Science & Technology Parks Dashboard in Power BI
KPI Cards
-
Display critical summary metrics at a glance
-
Help leaders quickly assess overall performance
Charts on the Overview Page
-
Annual Cost USD by Tech Sector – Understand where operational spending concentrates
-
Funding Raised USD by Region – Identify high-performing innovation regions
-
Satisfaction Rating by Program Type – Measure participant and stakeholder satisfaction
-
Annual Revenue USD by Program Type – Track revenue contribution across programs
Because this page provides instant clarity, leaders can align quickly before diving deeper into details.
2. Department Analysis Page: How Do Departments Perform Individually?

The Department Analysis Page focuses on internal performance evaluation. It helps administrators compare departments and optimize resource allocation.
What This Page Shows
Slicers
-
Filter by department, program type, or time period
-
Analyze specific operational units in detail
Key Charts
-
Annual Cost USD by Program Type – Identify cost-intensive programs
-
Funding Raised USD by Program Type – Measure funding success by department
-
Funding Rated USD by Program Type – Evaluate funding efficiency and effectiveness
Because departments operate differently, this page highlights strengths, gaps, and improvement areas clearly.
3. Research Domain Analysis Page: Which Domains Deliver the Best Results?
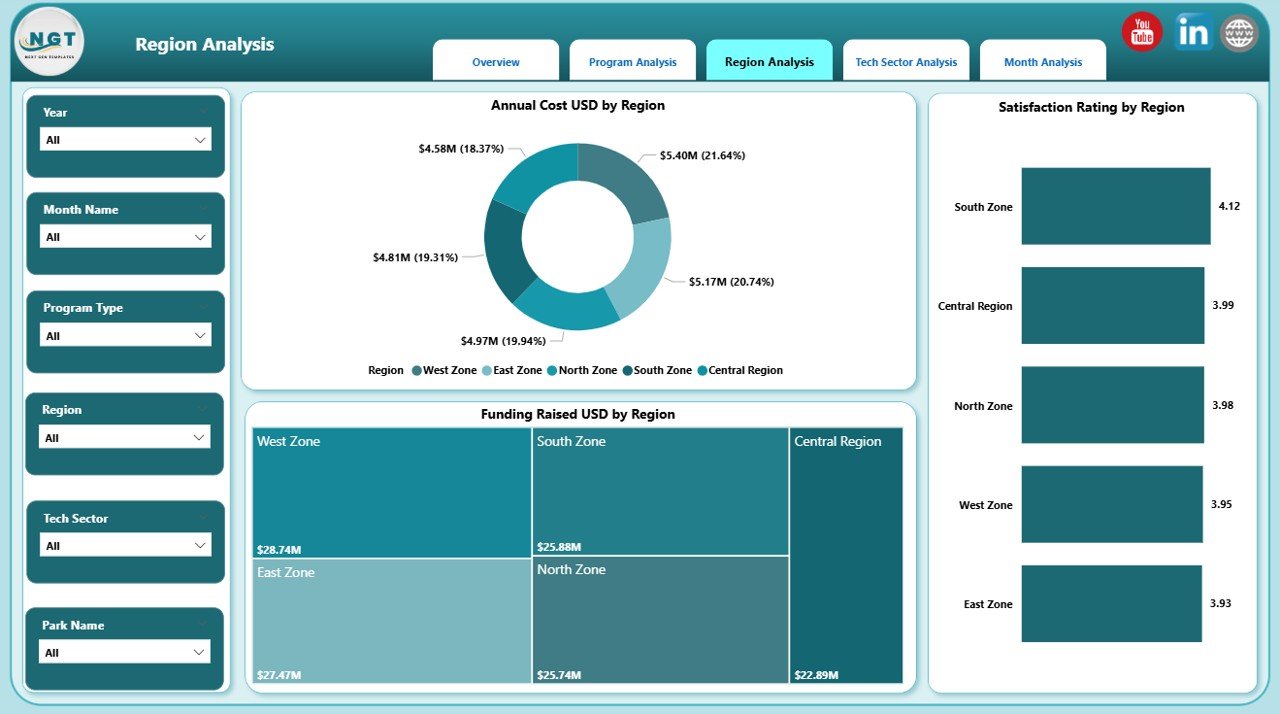
Research domains define the innovation focus of science parks. Therefore, analyzing domain-level performance becomes critical.
Insights from the Research Domain Analysis Page
Dynamic Slicers
-
Filter by research domain and region
-
Compare performance across innovation focus areas
Charts Included
-
Annual Cost USD by Region – Understand cost distribution across regions
-
Funding Raised USD by Region – Identify funding hotspots
-
Satisfaction Rating by Region – Measure regional program success
As a result, decision-makers can prioritize high-impact research domains and regions.
4. Funding Source Analysis Page: Where Does the Money Come From?

Funding sustainability defines the long-term success of science and technology parks. Therefore, the Funding Source Analysis Page plays a crucial role.
Key Visuals on This Page
Slicers
-
Filter by funding source and technology sector
-
Focus on specific investor or grant categories
Charts Displayed
-
Annual Cost USD by Tech Sector – Match costs with funding availability
-
Funding Raised USD by Tech Sector – Track funding contribution by sector
-
Satisfaction Rating by Tech Sector – Measure stakeholder confidence
Because funding sources vary widely, this page helps leaders strengthen investor relations and funding strategies.
Click to Purchases Science & Technology Parks Dashboard in Power BI
5. Monthly Trends Page: How Does Performance Change Over Time?
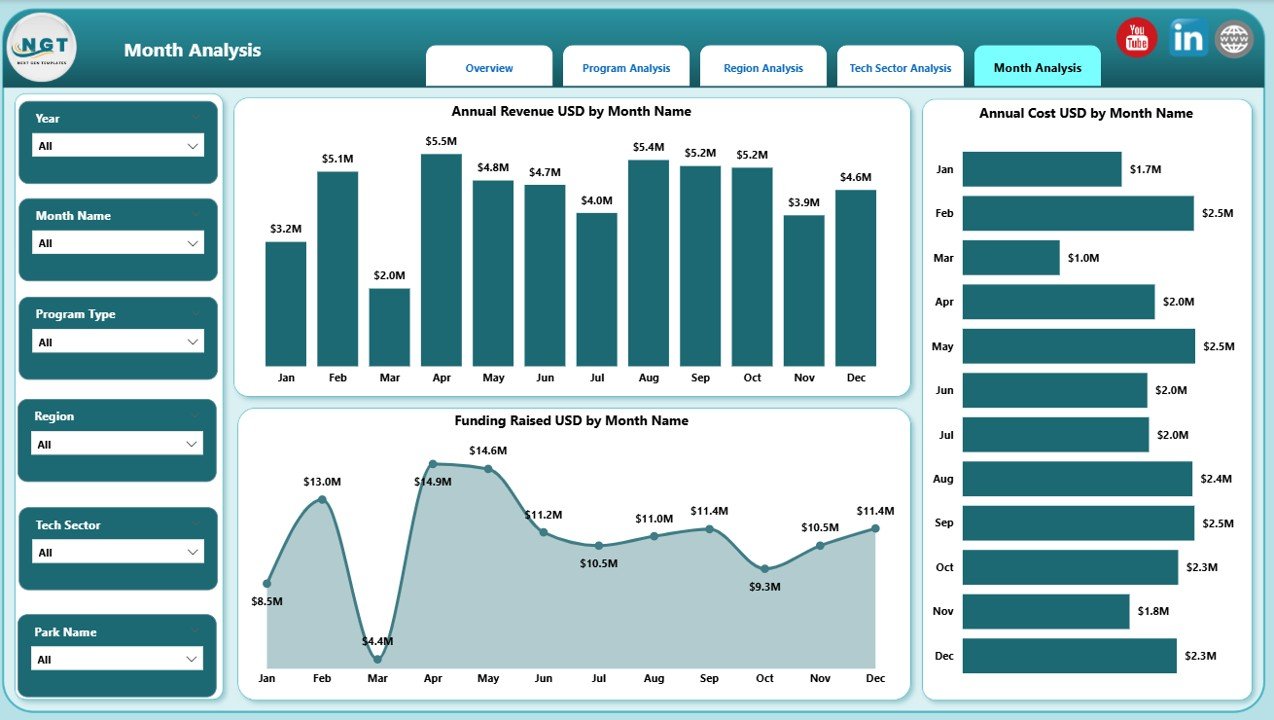
The Monthly Trends Page reveals time-based patterns. It helps users understand seasonality, growth cycles, and performance volatility.
Monthly Metrics Tracked
-
Annual Cost USD by Month – Monitor spending patterns
-
Funding Raised USD by Month – Track funding inflows
-
Annual Revenue USD by Month – Analyze revenue growth and stability
Since trends drive forecasting, this page supports budgeting, planning, and future projections.
Advantages of the Science & Technology Parks Dashboard in Power BI
Using this dashboard delivers significant operational and strategic advantages.
🚀 Centralized Performance Monitoring
-
Combine costs, funding, revenue, and satisfaction in one platform
-
Reduce dependency on multiple reports
📊 Data-Driven Decision Making
-
Use real-time visuals for faster insights
-
Support leadership discussions with evidence
⏱ Time Savings
-
Eliminate manual data consolidation
-
Automate reporting and analysis
🌍 Multi-Dimensional Analysis
-
Analyze performance by region, department, sector, and domain
-
Identify hidden patterns easily
🔍 Transparency & Accountability
-
Improve reporting clarity for stakeholders and funders
-
Strengthen governance and trust
Best Practices for the Science & Technology Parks Dashboard in Power BI
To maximize dashboard value, organizations should follow proven best practices.
✅ Standardize Data Inputs
Use consistent definitions for cost, funding, and revenue metrics. As a result, analysis stays accurate and reliable.
✅ Update Data Regularly
Schedule monthly or quarterly refresh cycles. Therefore, insights remain current and actionable.
✅ Use Clear KPI Definitions
Document KPI logic clearly. Consequently, users interpret visuals correctly.
✅ Limit Visual Overload
Use only meaningful charts. Because clarity improves usability, decisions become faster.
✅ Enable Role-Based Access
Provide access based on user roles. Thus, sensitive data remains secure.
How Does This Dashboard Support Strategic Planning?
This dashboard aligns operational performance with long-term strategy. For example:
-
Leadership teams identify high-performing sectors for expansion
-
Administrators optimize budgets using cost trend analysis
-
Funding teams strengthen proposals using performance evidence
-
Policy makers evaluate impact using satisfaction and revenue metrics
As a result, the dashboard becomes more than a reporting tool—it becomes a strategic asset.
Click to Purchases Science & Technology Parks Dashboard in Power BI
Who Can Benefit from a Science & Technology Parks Dashboard?
This dashboard serves multiple stakeholders, including:
-
Science park administrators
-
Innovation and incubation managers
-
Government and regulatory bodies
-
Investors and funding agencies
-
University and research institution leaders
Because of its flexibility, the dashboard adapts easily to different operational models.
Conclusion: Why Is a Science & Technology Parks Dashboard Essential Today?
Science and technology parks operate at the intersection of innovation, investment, and research. However, without structured performance tracking, complexity often hides critical insights. The Science & Technology Parks Dashboard in Power BI solves this challenge by transforming scattered data into clear, visual intelligence.
By combining financial metrics, funding analysis, satisfaction scores, and trends across five dedicated pages, this dashboard empowers leaders to act confidently. Therefore, organizations gain transparency, efficiency, and strategic clarity in one powerful solution.
Frequently Asked Questions (FAQs)
❓ What data sources does the dashboard use?
The dashboard typically uses structured Excel, database, or cloud-based data sources integrated into Power BI.
❓ Can the dashboard support multiple science parks?
Yes. You can scale the data model to include multiple parks, regions, or programs.
❓ Does this dashboard require advanced Power BI skills?
No. Users can interact with slicers and visuals easily without technical expertise.
❓ How often should the dashboard be updated?
Most organizations update it monthly. However, you can refresh it weekly or quarterly based on data availability.
❓ Can we customize KPIs and visuals?
Absolutely. Power BI allows full customization of metrics, visuals, and layouts.
❓ Is this dashboard suitable for government reporting?
Yes. It supports transparent, auditable, and visual reporting required by public institutions.
Visit our YouTube channel to learn step-by-step video tutorials