Managing performance in microfinance institutions requires clarity, accuracy, and speed. However, many microfinance teams still rely on scattered Excel sheets, manual reports, and delayed summaries. As a result, decision-making becomes slow and risky.
Therefore, a Microfinance Institutions KPI Dashboard in Excel plays a critical role. It converts raw operational and financial data into clear insights. Moreover, it helps management track growth, portfolio quality, efficiency, and sustainability from a single dashboard.
In this detailed guide, you will learn what a Microfinance Institutions KPI Dashboard in Excel is, how it works, its structure, key features, advantages, best practices, and frequently asked questions. Additionally, the article uses simple language, smooth transitions, and practical explanations to ensure easy understanding.
Click to buy Microfinance Institutions KPI Dashboard in Excel
What Is a Microfinance Institutions KPI Dashboard in Excel?
A Microfinance Institutions KPI Dashboard in Excel is a professionally designed, ready-to-use analytical template. It allows microfinance institutions to monitor key performance indicators (KPIs) related to lending, repayment, outreach, efficiency, and profitability.
Instead of managing multiple Excel files, teams can track all KPIs in one structured workbook. As a result, managers gain better visibility, while analysts reduce reporting effort.
Moreover, Excel makes this dashboard flexible, cost-effective, and easy to customize for different microfinance models.
Why Do Microfinance Institutions Need a KPI Dashboard?
Microfinance institutions operate with thin margins, high volumes, and social impact goals. Therefore, they must track performance carefully.
A KPI dashboard becomes essential because:
- It improves transparency across operations
- It supports faster and data-driven decisions
- It reduces manual reporting effort
- It helps identify risks early
- It improves accountability at all levels
Consequently, leadership teams stay proactive rather than reactive.
How Does the Microfinance Institutions KPI Dashboard in Excel Work?
This dashboard uses structured Excel sheets, formulas, drop-down controls, and charts. Together, these elements create an interactive performance-tracking system.
Additionally, users only need to update data once. After that, the dashboard updates automatically.
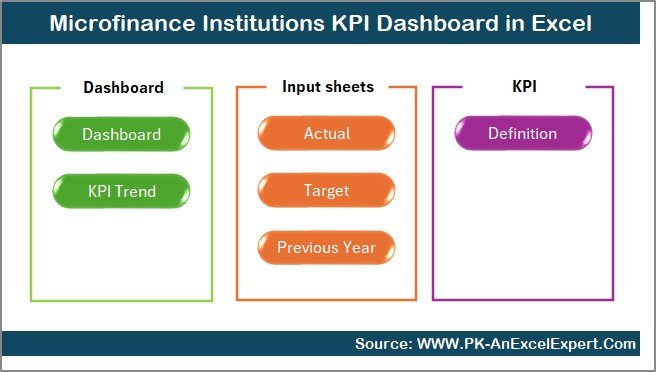
Overview of Worksheets in the Microfinance Institutions KPI Dashboard in Excel
This KPI dashboard includes 7 well-structured worksheets, each designed for a specific purpose. Together, they form a complete performance-monitoring system.
Summary Page – Your Navigation Control Center
The Summary Page acts as an index sheet. It improves usability and navigation.
Key Highlights of the Summary Page
- Clean and professional layout
- Six navigation buttons to jump instantly to other sheets
- Easy access to all dashboard sections
- User-friendly design for non-technical users
As a result, users save time and navigate confidently.
Click to buy Microfinance Institutions KPI Dashboard in Excel
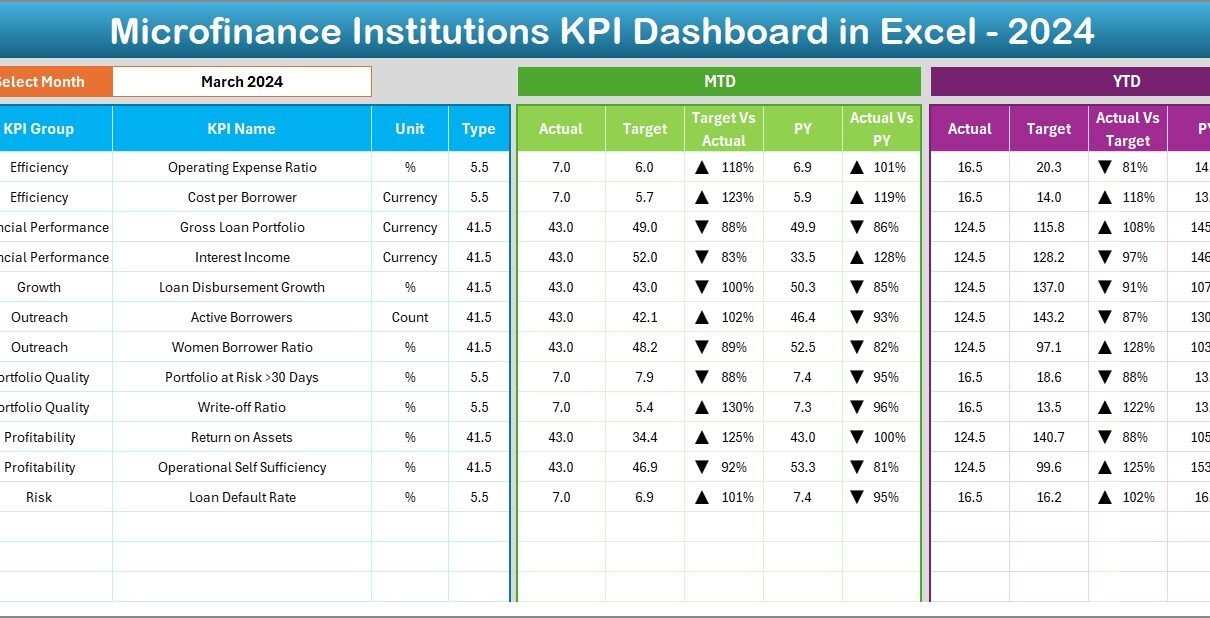
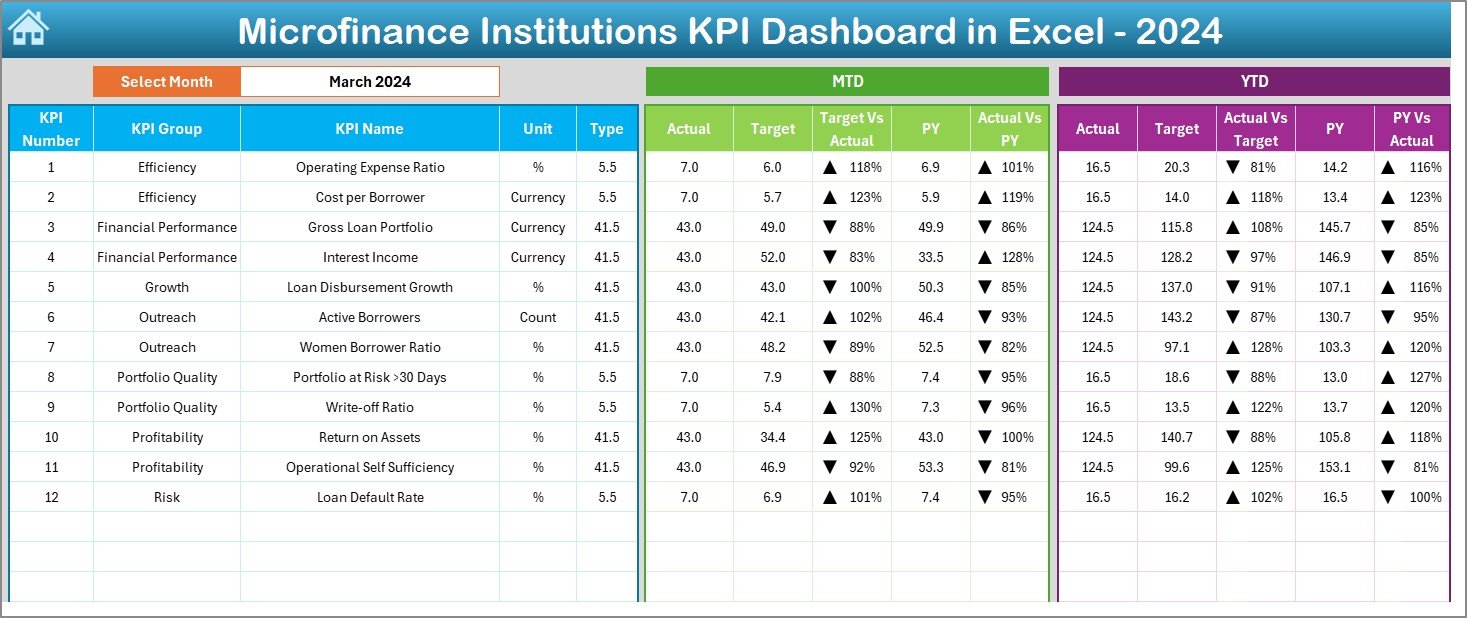
Dashboard Sheet – The Core Performance View
The Dashboard sheet serves as the heart of the Microfinance Institutions KPI Dashboard in Excel.
Month Selection Control
- Cell D3 contains a month drop-down
- Selecting a month updates the entire dashboard instantly
Therefore, users can analyze performance month by month without changing formulas.
KPIs Displayed on the Dashboard
The dashboard displays both MTD (Month-to-Date) and YTD (Year-to-Date) metrics.
MTD Metrics Shown
- Actual
- Target
- Previous Year
- Target vs Actual (%)
- Previous Year vs Actual (%)
YTD Metrics Shown
- Actual
- Target
- Previous Year
- Target vs Actual (%)
- Previous Year vs Actual (%)
Additionally, conditional formatting arrows highlight performance direction clearly.
Why Conditional Formatting Matters
Conditional arrows help users:
- Spot underperformance instantly
- Identify improvement trends
- Reduce analysis time
- Focus on critical KPIs
As a result, dashboards become actionable, not just visual.
Click to buy Microfinance Institutions KPI Dashboard in Excel
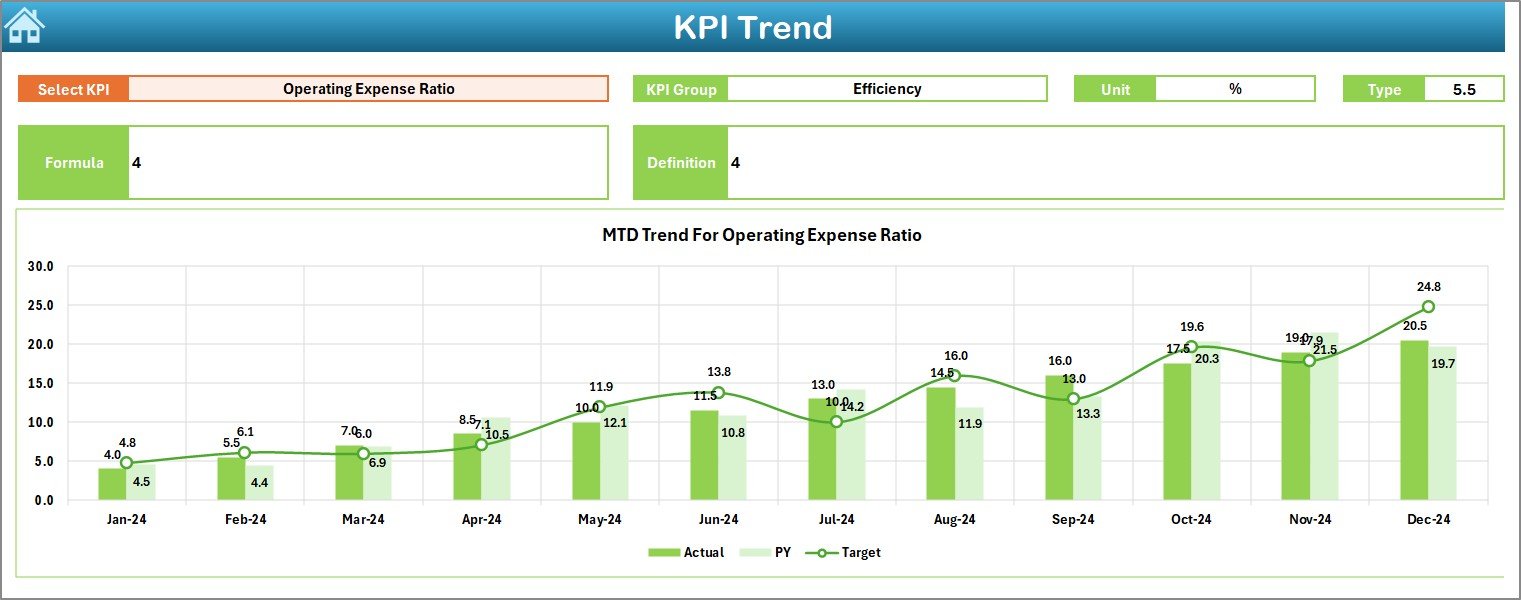
Trend Sheet – Deep KPI Analysis
The Trend sheet allows users to analyze one KPI at a time in depth.
KPI Selection Control
- Cell C3 contains a KPI drop-down
- Selecting a KPI updates all related information
KPI Details Displayed
For the selected KPI, the dashboard shows:
- KPI Group
- Unit of Measurement
- KPI Type (Lower the Better or Upper the Better)
- KPI Formula
- KPI Definition
Therefore, users understand not only the numbers but also their meaning.
Trend Charts Included
- MTD trend chart (Actual, Target, PY)
- YTD trend chart (Actual, Target, PY)
These charts help users analyze patterns, seasonality, and deviations over time.
Click to buy Microfinance Institutions KPI Dashboard in Excel
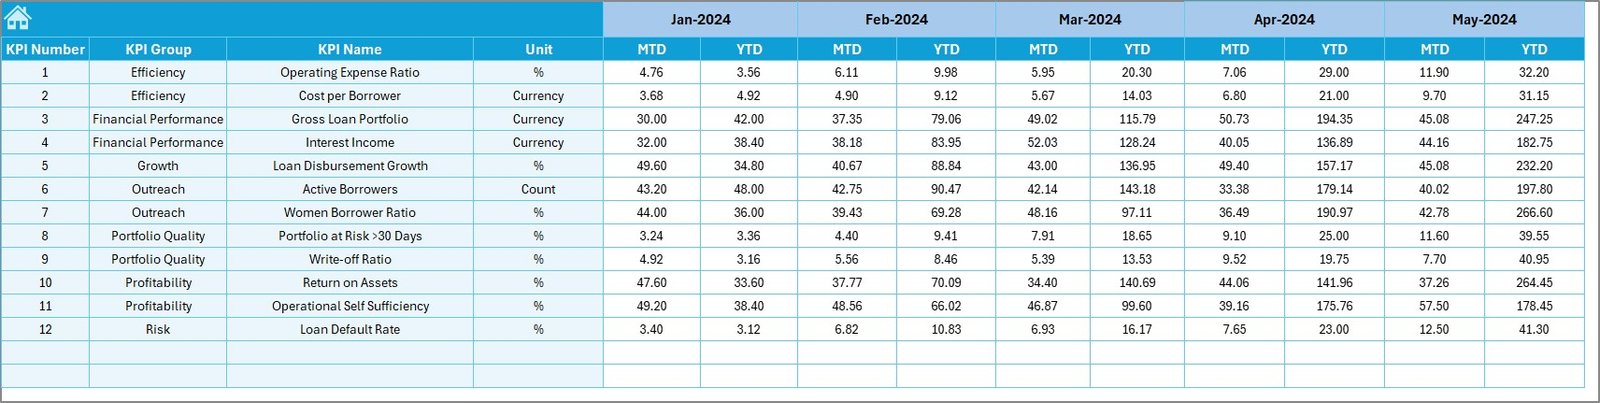
Actual Numbers Input Sheet – Data Entry Made Simple
The Actual Numbers Input sheet captures actual performance data.
Key Input Controls
- Cell E1 allows users to define the first month of the year
- Users enter both MTD and YTD values
Once entered, all dashboards and charts update automatically.
Benefits of This Design
- Centralized data entry
- Reduced formula errors
- Consistent reporting logic
- Faster monthly updates
Thus, analysts work efficiently and confidently.
Click to buy Microfinance Institutions KPI Dashboard in Excel
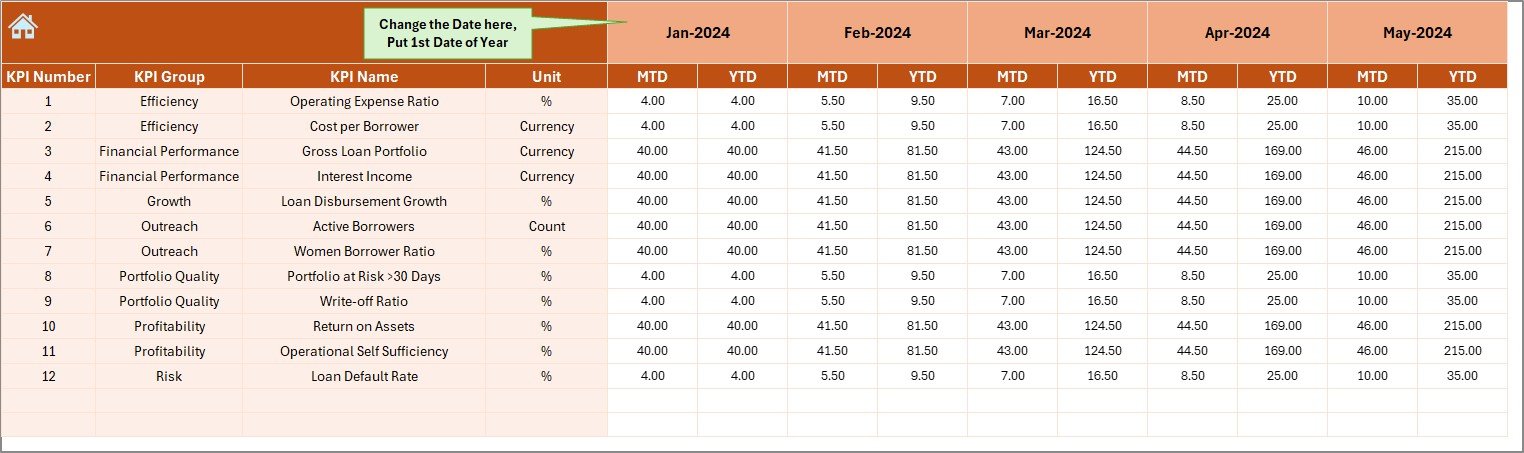
Target Sheet – Performance Benchmarking
The Target sheet stores planned targets for each KPI.
What Users Enter Here
- Monthly MTD targets
- YTD cumulative targets
These targets drive variance analysis across the dashboard.
Why Target Tracking Is Important
Target tracking helps institutions:
- Measure goal achievement
- Identify performance gaps
- Improve planning accuracy
- Align teams with objectives
Therefore, this sheet plays a strategic role.
Click to buy Microfinance Institutions KPI Dashboard in Excel
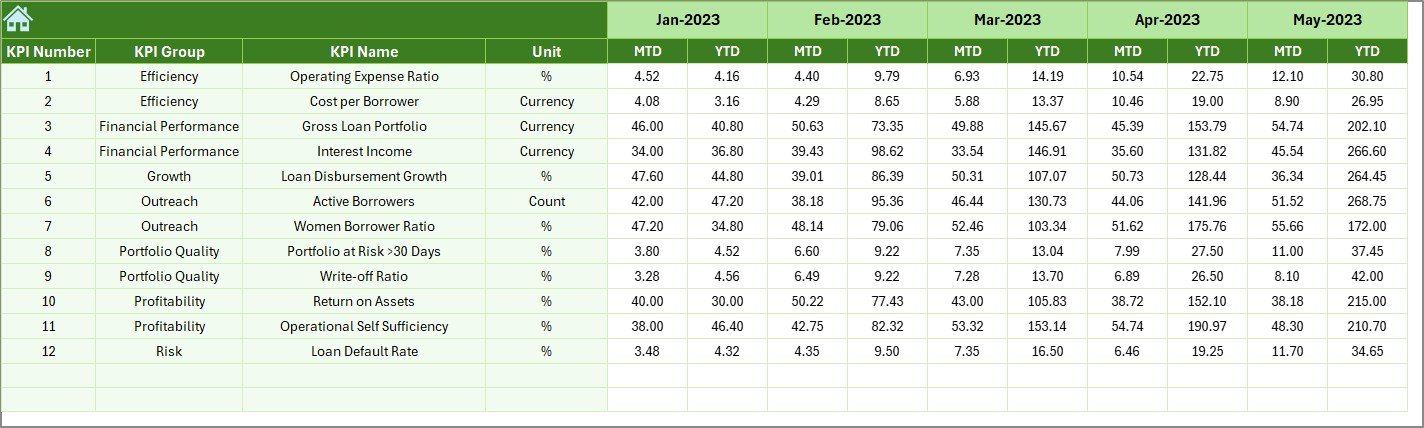
Previous Year Numbers Sheet – Year-on-Year Comparison
The Previous Year Numbers sheet captures historical data.
Purpose of This Sheet
- Enables year-over-year analysis
- Helps identify growth or decline
- Supports trend-based decision-making
Users enter data in the same format as current year data, ensuring consistency.
Click to buy Microfinance Institutions KPI Dashboard in Excel
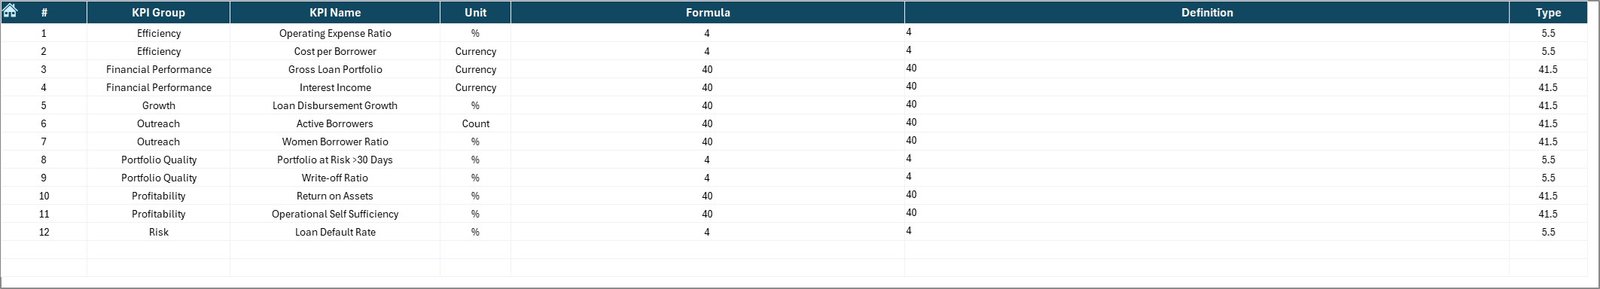
KPI Definition Sheet – Governance and Clarity
The KPI Definition sheet ensures consistency and governance.
Information Maintained Here
- KPI Name
- KPI Group
- Unit
- Formula
- KPI Definition
This sheet ensures everyone interprets KPIs the same way.
Click to buy Microfinance Institutions KPI Dashboard in Excel
Advantages of Microfinance Institutions KPI Dashboard in Excel
- Centralized Performance Monitoring
The dashboard brings all KPIs into one file. As a result, teams stop juggling multiple spreadsheets.
- Faster Decision-Making
Because data updates automatically, managers access insights instantly.
- Cost-Effective Solution
Excel eliminates the need for expensive BI tools while delivering powerful analytics.
- Easy Customization
Users can add new KPIs, sheets, or charts without technical skills.
- Improved Transparency and Accountability
Clear KPIs promote responsibility at branch and management levels.
- Time Savings for Analysts
Once set up, monthly reporting takes minutes instead of hours.
Who Can Use the Microfinance Institutions KPI Dashboard in Excel?
This dashboard suits:
- Microfinance institutions
- Non-bank financial institutions
- Cooperative credit societies
- Rural lending organizations
- Micro-lending NGOs
- Finance and MIS teams
Thus, it adapts to various operational models.
How Does This Dashboard Improve Financial and Social Impact Tracking?
Microfinance institutions balance financial sustainability with social outreach.
This dashboard supports both by:
- Tracking portfolio quality KPIs
- Monitoring outreach growth
- Evaluating operational efficiency
- Measuring financial performance
Therefore, institutions maintain balance and sustainability.
Best Practices for the Microfinance Institutions KPI Dashboard in Excel
- Standardize KPI Definitions
Always maintain clear definitions in the KPI Definition sheet.
- Update Data Monthly Without Delay
Regular updates keep insights relevant and accurate.
- Review Variance Indicators Carefully
Focus on KPIs showing negative arrows or high variance.
- Use Trend Analysis for Strategy
Trends reveal patterns that single-month numbers cannot.
- Train Users on KPI Interpretation
Ensure teams understand what each KPI means and how to act on it.
- Keep the Dashboard Simple
Avoid clutter. Focus on KPIs that truly matter.
Common Mistakes to Avoid While Using KPI Dashboards
- Entering inconsistent data formats
- Ignoring KPI definitions
- Tracking too many KPIs
- Delaying data updates
- Using dashboards only for reporting, not decisions
Avoiding these mistakes improves dashboard value significantly.
How to Extend the Microfinance KPI Dashboard Further?
You can enhance the dashboard by:
- Adding branch-wise analysis
- Including region or product filters
- Adding risk-based KPIs
- Creating management summary views
Thus, the dashboard evolves with organizational needs.
Why Excel Still Works Best for Microfinance KPI Dashboards?
Excel remains popular because:
- Most teams already use it
- It supports powerful formulas
- It integrates easily with MIS exports
- It allows offline access
Therefore, Excel remains practical and reliable.
Conclusion: Why Microfinance Institutions Should Use a KPI Dashboard in Excel
A Microfinance Institutions KPI Dashboard in Excel transforms raw data into meaningful insights. It improves transparency, saves time, and supports better decisions.
Moreover, its structured worksheets, automated calculations, and visual clarity make it ideal for microfinance operations. When used correctly, this dashboard becomes a strategic tool rather than just a report.
Therefore, every microfinance institution aiming for growth, sustainability, and impact should adopt a KPI dashboard in Excel.
Frequently Asked Questions (FAQs)
What is a Microfinance Institutions KPI Dashboard in Excel?
It is an Excel-based tool that tracks key performance indicators related to microfinance operations in a structured and visual format.
Can non-technical users use this dashboard?
Yes. The dashboard uses simple controls, drop-downs, and buttons, making it easy for all users.
How often should the dashboard be updated?
You should update it monthly to ensure accurate insights.
Can I add new KPIs to the dashboard?
Yes. You can add KPIs by updating the KPI Definition, Target, Actual, and Previous Year sheets.
Does this dashboard support year-on-year comparison?
Yes. It includes a dedicated Previous Year Numbers sheet for comparison.
Is this dashboard suitable for small microfinance institutions?
Absolutely. It scales well for both small and large institutions.
Visit our YouTube channel to learn step-by-step video tutorials
Watch the step-by-step video tutorial:
Click to buy Microfinance Institutions KPI Dashboard in Excel