Managing financial audits demands accuracy, consistency, and timely insights. However, many audit teams still depend on scattered Excel sheets, manual calculations, and static reports. As a result, errors increase, reviews slow down, and decision-making suffers.
This is exactly where a Financial Auditing KPI Dashboard in Excel becomes a powerful solution.
In this detailed guide, you will learn what a Financial Auditing KPI Dashboard in Excel is, how it works, why it matters, its structure, key features, advantages, best practices, and common questions. Moreover, the language remains simple, clear, and practical so that finance professionals, auditors, and managers can apply it easily.
Click to buy Financial Auditing KPI Dashboard in Excel
What Is a Financial Auditing KPI Dashboard in Excel?
A Financial Auditing KPI Dashboard in Excel is a structured, ready-to-use analytical template that tracks and monitors key audit performance indicators in one place.
Instead of reviewing raw data across multiple files, this dashboard converts numbers into:
- Clear KPI cards
- Variance indicators
- Trend charts
- Month-to-date (MTD) and year-to-date (YTD) insights
As a result, audit teams gain better visibility, faster reviews, and stronger control over audit quality and compliance.
Why Do Financial Auditing Teams Need a KPI Dashboard?
Financial audits involve strict timelines, regulatory pressure, and detailed reviews. Therefore, teams must track performance continuously rather than react at the end of the cycle.
A Financial Auditing KPI Dashboard in Excel helps because:
- It centralizes audit data in one workbook
- It reduces manual reporting work
- It highlights gaps and risks early
- It supports data-driven decisions
- It improves accountability across teams
Moreover, Excel makes this solution cost-effective and flexible without complex BI tools.
How Does a Financial Auditing KPI Dashboard in Excel Work?
The dashboard works by connecting structured input sheets with automated calculations and visual outputs.
Here is how the process flows:
- You define KPIs and formulas
- You enter actual, target, and previous year data
- Excel calculates MTD and YTD values automatically
- Variances and trends update instantly
- Visual indicators highlight performance status
As a result, audit managers can review performance with just a few clicks.
What KPIs Are Commonly Tracked in Financial Auditing?
A Financial Auditing KPI Dashboard in Excel can track multiple audit-focused metrics, such as:
- Audit completion rate
- Findings per audit
- High-risk issues identified
- Compliance deviation rate
- Audit cycle time
- Rework percentage
- Control effectiveness score
- Internal vs external audit coverage
Because the dashboard remains flexible, teams can customize KPIs based on regulatory and organizational needs.
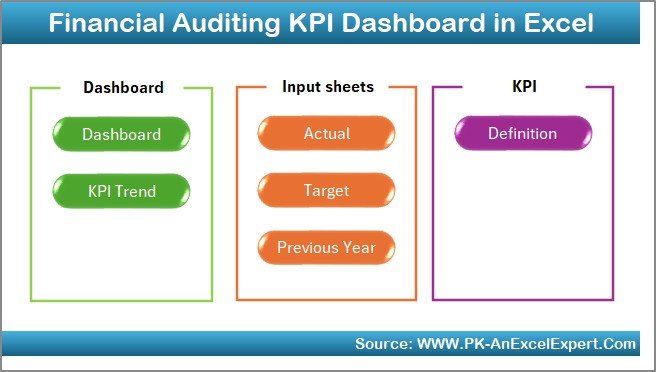
What Is the Structure of a Financial Auditing KPI Dashboard in Excel?
This dashboard follows a clean and logical structure with 7 dedicated worksheets. Each sheet serves a specific purpose and improves usability.
Summary Page
The Summary Page acts as the index of the dashboard.
Key highlights include:
- Six navigation buttons
- One-click access to all major sheets
- Clean and professional layout
Because of this design, users navigate the dashboard quickly without confusion.
Click to buy Financial Auditing KPI Dashboard in Excel
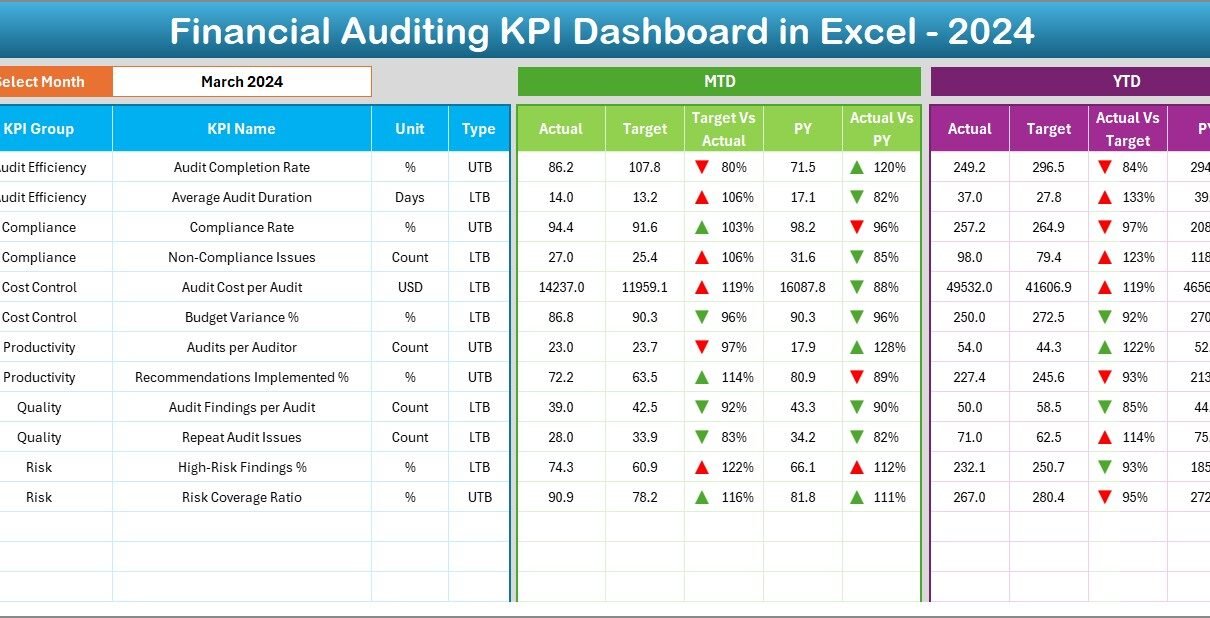
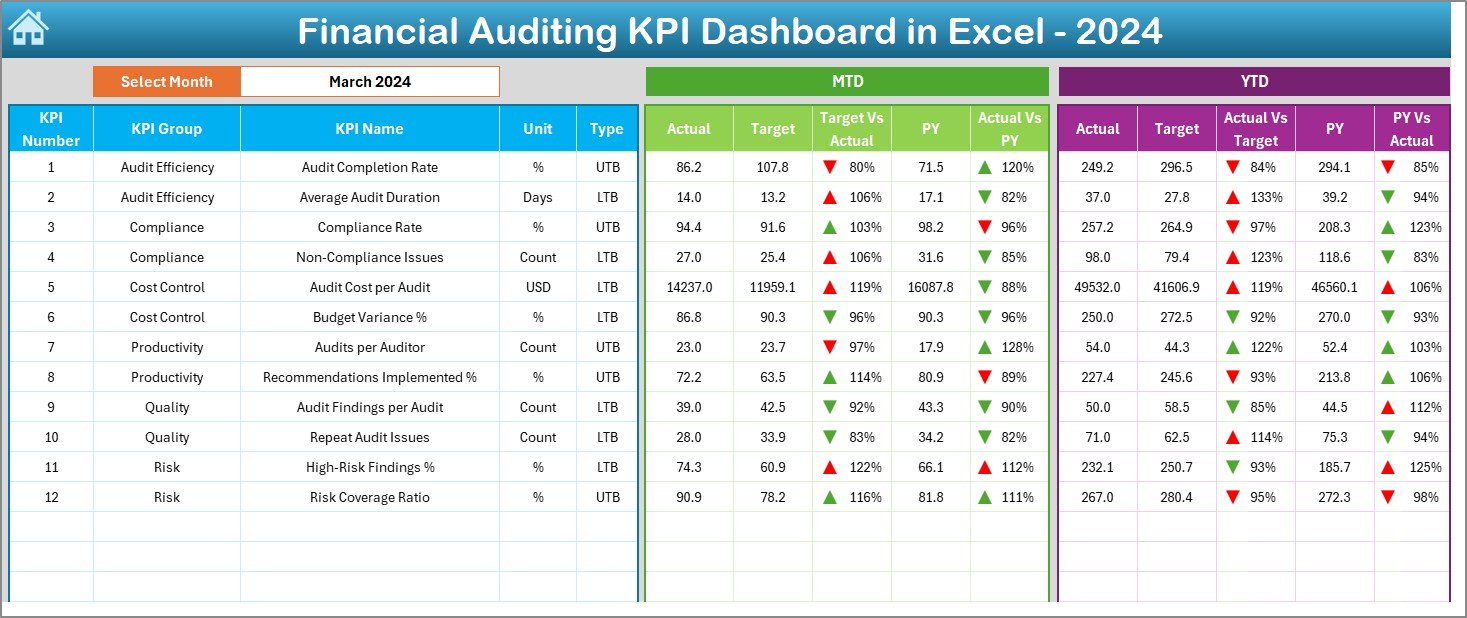
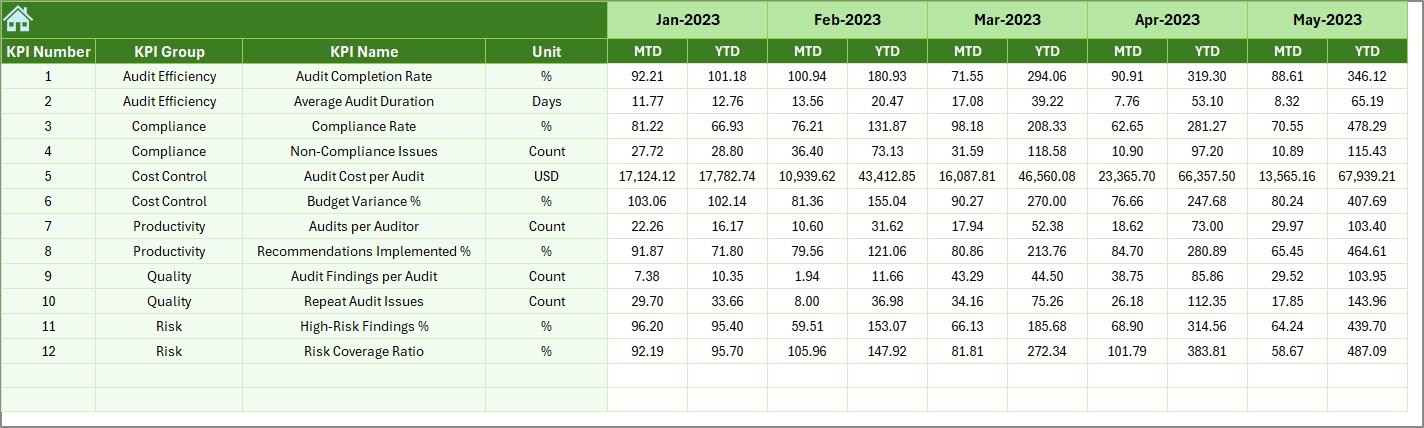
Dashboard Sheet
The Dashboard Sheet is the main analytical page where all KPIs come together.
Key features include:
- Month selection dropdown at cell D3
- Automatic update of all numbers when the month changes
- MTD Actual, Target, and Previous Year values
- YTD Actual, Target, and Previous Year values
- Target vs Actual (%) analysis
- Previous Year vs Actual (%) analysis
- Conditional formatting with up and down arrows
As a result, performance status becomes instantly visible.
Click to buy Financial Auditing KPI Dashboard in Excel
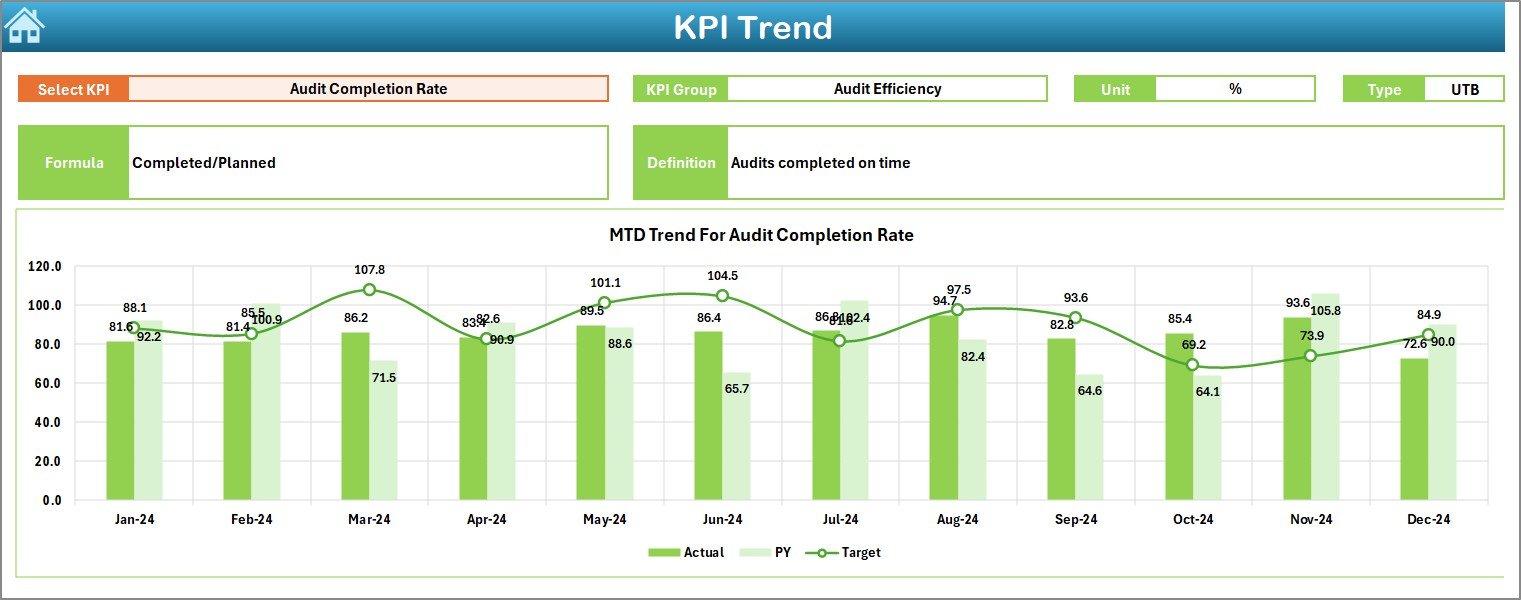
Trend Sheet
The Trend Sheet focuses on deep KPI-level analysis.
Here is what it offers:
- KPI selection dropdown at cell C3
- Display of KPI Group, Unit, and KPI Type
- Clear KPI formula and definition
- MTD trend chart for Actual, Target, and Previous Year
- YTD trend chart for Actual, Target, and Previous Year
Because of this setup, auditors can analyze patterns, consistency, and improvement areas over time.
Click to buy Financial Auditing KPI Dashboard in Excel
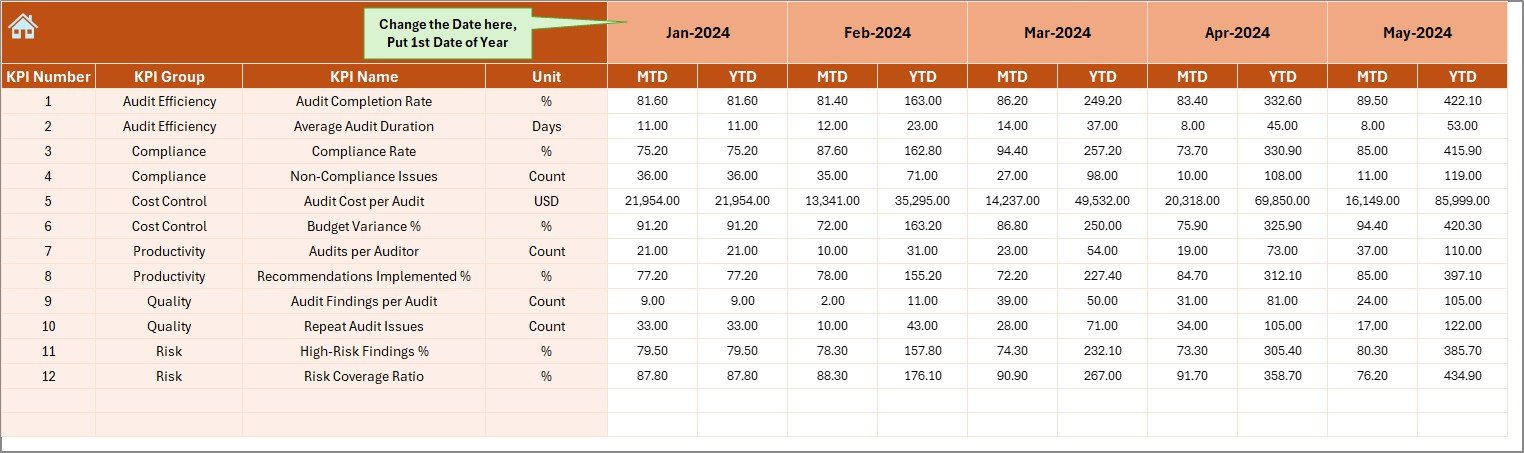
Actual Numbers
The Actual Numbers Input Sheet captures real performance data.
Key points include:
- Entry of MTD and YTD actual values
- Month selection from cell E1
- Automatic alignment with dashboard visuals
As a result, users enter data once and analyze it everywhere.
Click to buy Financial Auditing KPI Dashboard in Excel
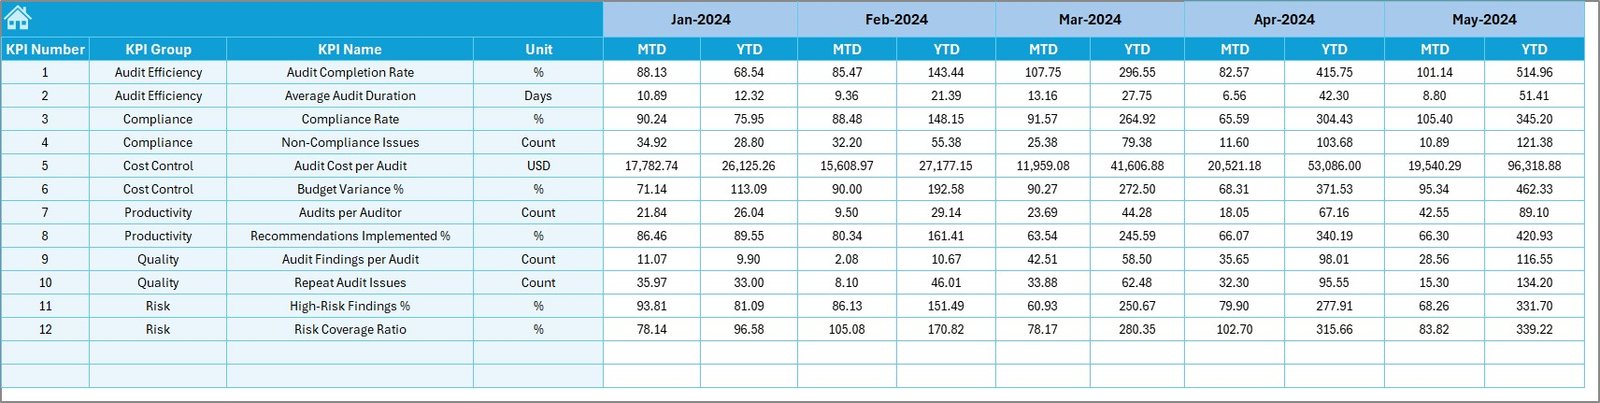
Target Sheet
The Target Sheet stores planned KPI values.
It allows users to:
- Enter monthly MTD targets
- Enter cumulative YTD targets
- Compare planned vs actual performance
Therefore, audit leaders can monitor goal achievement continuously.
Click to buy Financial Auditing KPI Dashboard in Excel
Previous Year Number Sheet
The Previous Year Number Sheet provides historical context.
It helps by:
- Storing prior year MTD and YTD data
- Enabling year-over-year comparisons
- Supporting trend-based decisions
As a result, performance evaluation becomes more meaningful.
Click to buy Financial Auditing KPI Dashboard in Excel
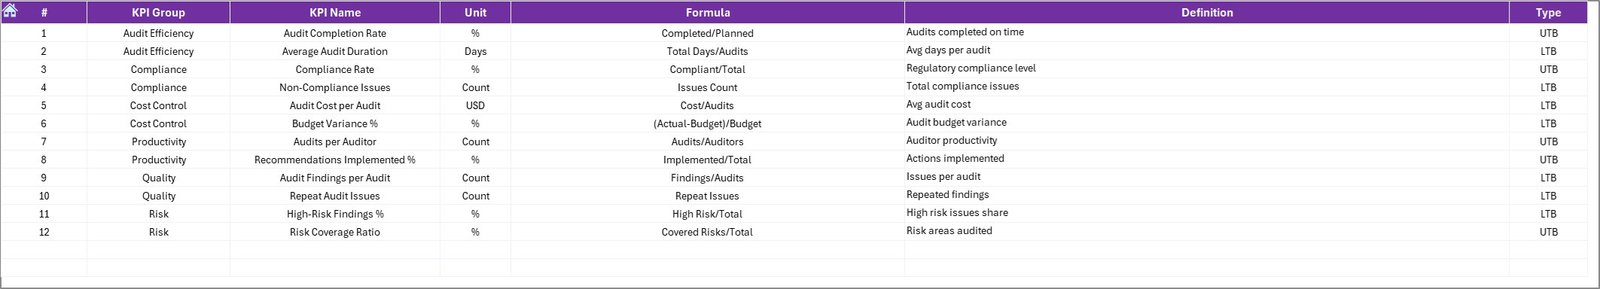
KPI Definition Sheet
The KPI Definition Sheet ensures clarity and consistency.
It includes:
- KPI Name
- KPI Group
- Unit of measurement
- KPI Formula
- KPI Definition
Because of this documentation, everyone interprets KPIs in the same way.
Click to buy Financial Auditing KPI Dashboard in Excel
Advantages of Financial Auditing KPI Dashboard in Excel
Why Does This Dashboard Improve Audit Efficiency?
A Financial Auditing KPI Dashboard in Excel improves efficiency because:
- It eliminates repetitive manual reports
- It reduces calculation errors
- It speeds up audit reviews
Therefore, auditors focus more on insights rather than data preparation.
How Does It Improve Decision-Making?
The dashboard improves decisions by:
- Showing real-time performance
- Highlighting variances clearly
- Displaying trends visually
As a result, leaders act faster and with confidence.
Why Is Excel a Smart Choice for Audit Dashboards?
Excel works well because:
- Most finance teams already use it
- It requires no additional software cost
- It allows customization without coding
Moreover, Excel ensures easy adoption across teams.
How Does It Enhance Transparency?
The dashboard enhances transparency by:
- Centralizing all audit KPIs
- Providing clear definitions
- Making performance visible to stakeholders
As a result, trust and accountability improve.
How Can Organizations Customize This Dashboard?
Customization options include:
- Adding new KPIs
- Changing target benchmarks
- Modifying trend periods
- Updating KPI groups
- Adjusting formats and visuals
Because Excel remains flexible, customization stays simple.
Best Practices for the Financial Auditing KPI Dashboard in Excel
How Should Teams Define KPIs?
Best practices include:
- Align KPIs with audit objectives
- Keep KPIs measurable and relevant
- Avoid tracking too many KPIs
As a result, focus and clarity remain strong.
How Often Should Data Be Updated?
You should:
- Update actuals monthly
- Review targets quarterly
- Validate previous year data annually
Therefore, accuracy stays consistent.
Why Is Documentation Important?
Always document:
- KPI formulas
- KPI definitions
- Data sources
Because of this practice, confusion and errors reduce significantly.
How Can Teams Maintain Data Accuracy?
You can maintain accuracy by:
- Using data validation rules
- Restricting input cells
- Reviewing numbers before updates
As a result, dashboard reliability increases.
How Should Audit Teams Review the Dashboard?
Audit teams should:
- Review KPIs in monthly meetings
- Focus on variances and trends
- Assign actions for underperforming areas
Therefore, the dashboard drives action, not just reporting.
Who Can Benefit from a Financial Auditing KPI Dashboard in Excel?
This dashboard benefits:
- Internal audit teams
- External audit firms
- Finance managers
- Compliance officers
- Risk management teams
Because of its flexibility, it fits organizations of all sizes.
How Does This Dashboard Support Compliance and Governance?
The dashboard supports compliance by:
- Tracking audit completion rates
- Monitoring control effectiveness
- Highlighting high-risk findings
As a result, governance improves continuously.
Conclusion: Why Is a Financial Auditing KPI Dashboard in Excel a Must-Have Tool?
A Financial Auditing KPI Dashboard in Excel transforms how audit teams track, analyze, and improve performance. Instead of relying on fragmented reports, teams gain a single, structured, and visual system.
Because it combines MTD, YTD, target, and previous year analysis, the dashboard delivers clarity and speed. Moreover, Excel keeps the solution affordable, flexible, and easy to adopt.
In today’s compliance-driven environment, this dashboard is not just helpful—it is essential.
Frequently Asked Questions (FAQs)
What is a Financial Auditing KPI Dashboard in Excel?
A Financial Auditing KPI Dashboard in Excel is a centralized tool that tracks audit-related KPIs using automated calculations and visual analysis.
Can this dashboard work for both internal and external audits?
Yes, the dashboard works for both internal and external audits with minor KPI customization.
Do users need advanced Excel skills to use it?
No, users only need basic Excel knowledge to enter data and navigate the dashboard.
How many KPIs can this dashboard handle?
The dashboard can handle multiple KPIs, but best practice suggests focusing on the most critical ones.
Can organizations modify KPIs and targets?
Yes, organizations can easily modify KPIs, targets, and formulas inside Excel.
How often should the dashboard be reviewed?
Teams should review it monthly to ensure timely insights and corrective actions.
Visit our YouTube channel to learn step-by-step video tutorials
Watch the step-by-step video tutorial:
Click to buy Financial Auditing KPI Dashboard in Excel