Managing purchasing activities in clinics has become more complex than ever. Clinics must control costs, track vendor performance, manage inventory purchases, and ensure timely procurement of medical supplies. However, when purchasing data stays scattered across spreadsheets and manual reports, decision-making slows down and risks increase.
That is exactly why a Clinic Purchasing KPI Dashboard in Excel becomes an essential solution for modern clinics.
In this detailed article, you will learn what a Clinic Purchasing KPI Dashboard in Excel is, why clinics need it, how it works, its worksheet structure, key KPIs, advantages, best practices, and common questions. By the end, you will clearly understand how this Excel dashboard helps clinics gain control, visibility, and confidence in purchasing decisions.
Click to buy Clinic Purchasing KPI Dashboard in Excel
What Is a Clinic Purchasing KPI Dashboard in Excel?
A Clinic Purchasing KPI Dashboard in Excel is a structured and interactive Excel-based reporting tool designed to track, analyze, and monitor key performance indicators related to clinic purchasing activities.
Instead of managing multiple disconnected files, this dashboard consolidates all purchasing KPIs into one centralized Excel file. As a result, clinic managers, procurement teams, and finance teams gain real-time visibility into costs, efficiency, and performance.
Because the dashboard uses Microsoft Excel, it remains easy to use, cost-effective, and flexible. Clinics can customize KPIs, add data, and analyze performance without investing in expensive BI tools.
Why Do Clinics Need a Purchasing KPI Dashboard?
Clinics purchase medical equipment, consumables, pharmaceuticals, maintenance services, and operational supplies regularly. Therefore, purchasing efficiency directly affects patient care, cost control, and operational stability.
However, many clinics still face common challenges, such as:
- Lack of visibility into purchasing performance
- Difficulty tracking monthly and yearly costs
- No clear comparison between actuals, targets, and previous year data
- Manual calculations that increase errors
- Delayed corrective actions due to late reporting
A Clinic Purchasing KPI Dashboard in Excel solves these problems by transforming raw purchasing data into actionable insights.
How Does a Clinic Purchasing KPI Dashboard in Excel Work?
The dashboard works through a structured worksheet design. Users enter data in dedicated input sheets, while Excel formulas and visuals automatically update KPIs, charts, and trends.
Because of this design, users do not need advanced Excel knowledge. They only need to input numbers, select months, and review insights.
Now, let us explore the worksheet structure in detail.
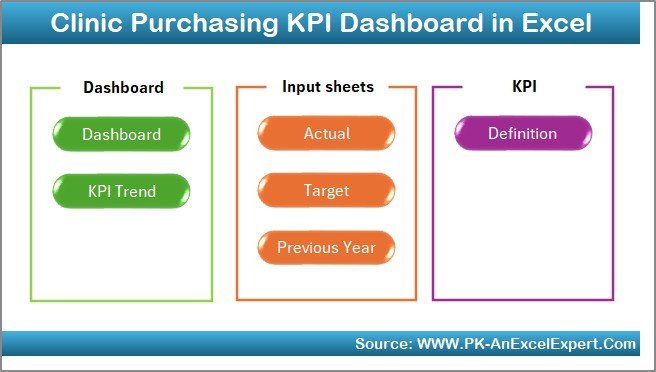
What Worksheets Are Included in the Clinic Purchasing KPI Dashboard in Excel?
This dashboard includes 7 professionally structured worksheets, each serving a clear purpose.
Summary Page
The Summary Page works as an index sheet.
Here, you will find six navigation buttons that allow users to jump directly to any worksheet. As a result, users save time and navigate the dashboard easily.
This page improves usability, especially for senior management and non-technical users.
Click to buy Clinic Purchasing KPI Dashboard in Excel
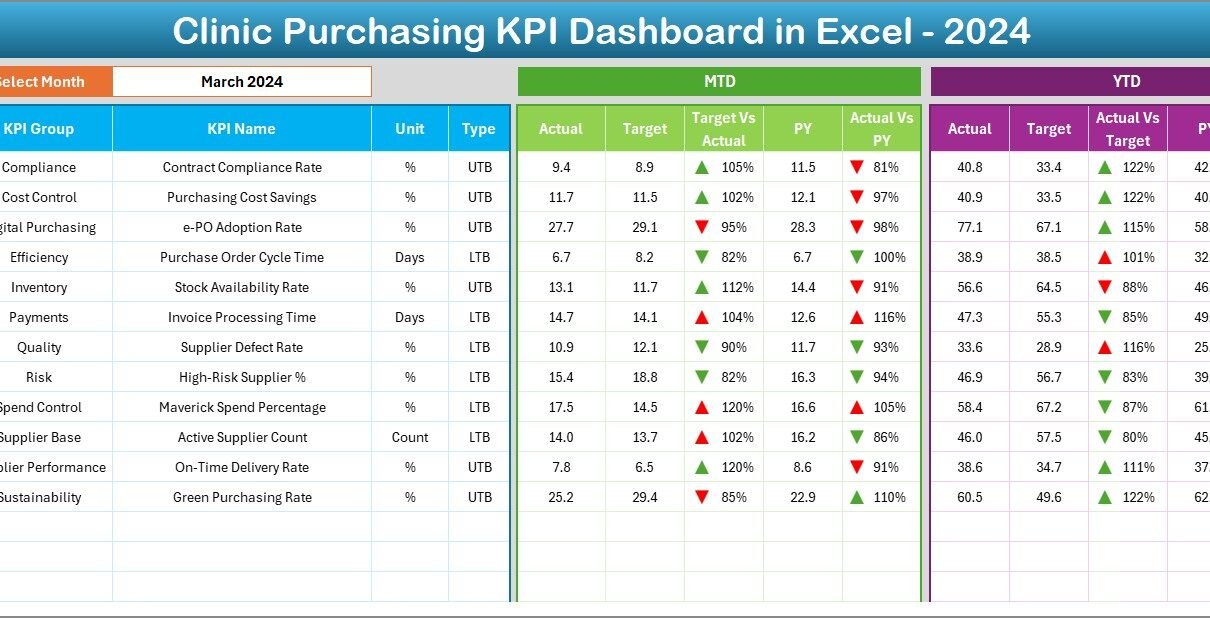
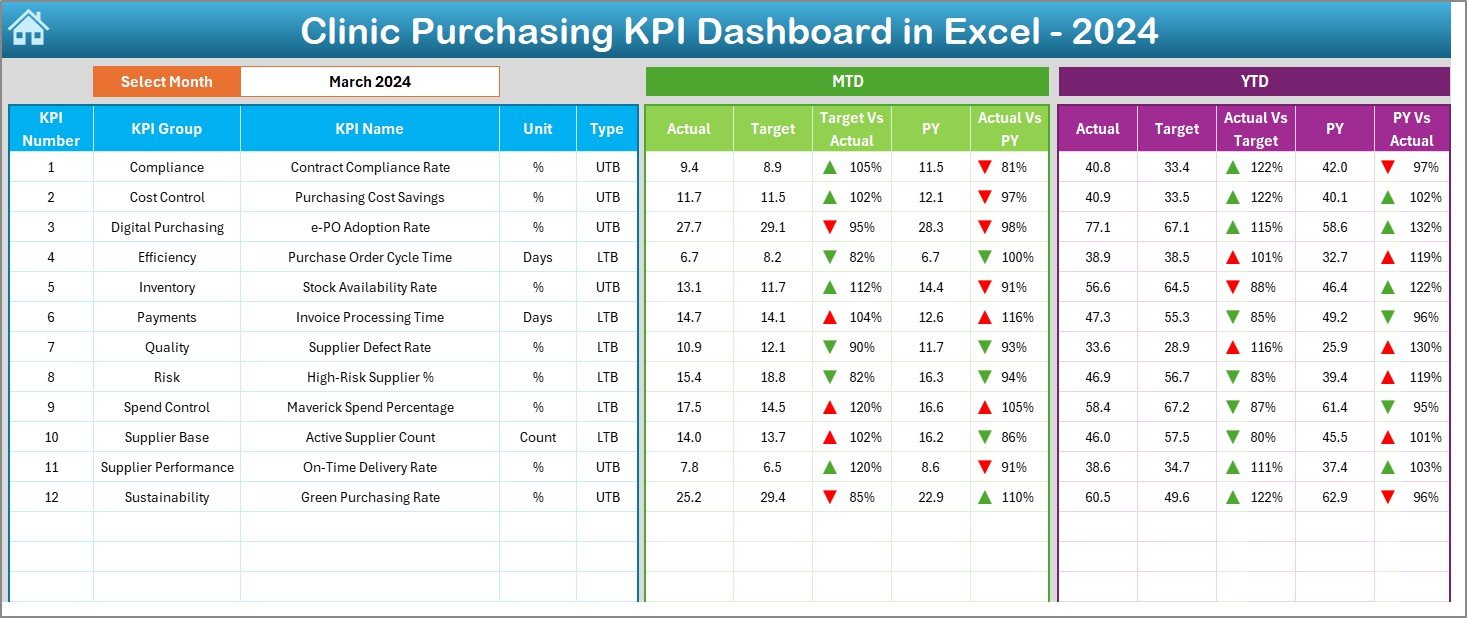
Dashboard Sheet
The Dashboard Sheet is the main analytical page.
Here, the dashboard displays all key purchasing KPIs in one view. Users can select the month from a drop-down on range D3, and the entire dashboard updates instantly.
Key highlights on the Dashboard sheet include:
- MTD Actual, Target, and Previous Year values
- Target vs Actual variance
- Previous Year vs Actual variance
- Conditional formatting with up and down arrows
- YTD Actual, Target, and Previous Year values
- YTD variance analysis
Because of this setup, clinics can track both short-term performance (MTD) and long-term trends (YTD) without switching reports.
Click to buy Clinic Purchasing KPI Dashboard in Excel
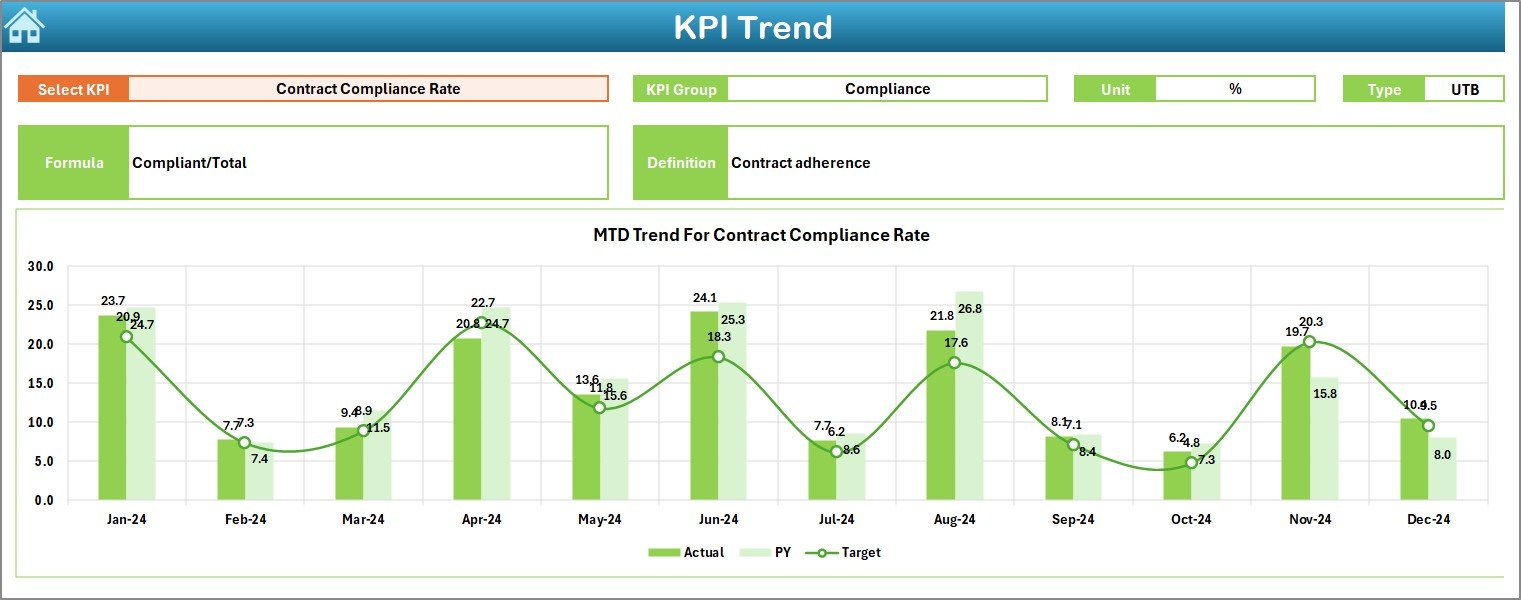
Trend Sheet Tab
The Trend Sheet Tab focuses on KPI-level analysis.
Users can select the KPI name from a drop-down on range C3. Once selected, the dashboard displays detailed KPI information, including:
- KPI Group
- Unit of KPI
- KPI Type (Lower the Better or Upper the Better)
- KPI Formula
- KPI Definition
In addition, the sheet shows MTD and YTD trend charts for:
- Actual values
- Target values
- Previous Year values
Because of these trends, clinics can quickly identify improvement areas and performance gaps.
Click to buy Clinic Purchasing KPI Dashboard in Excel
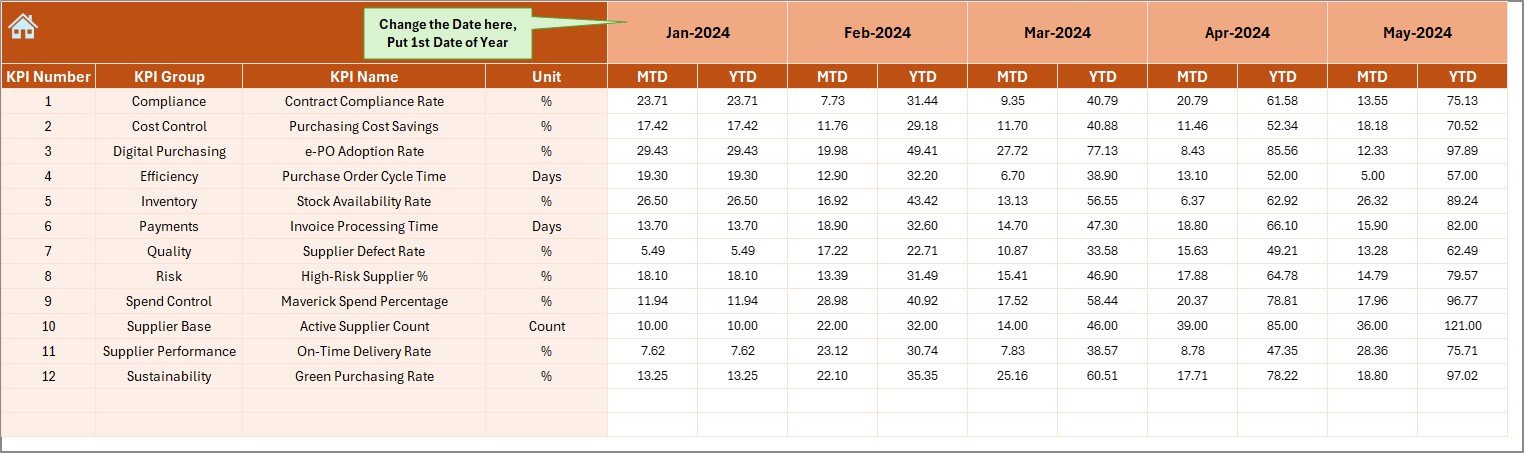
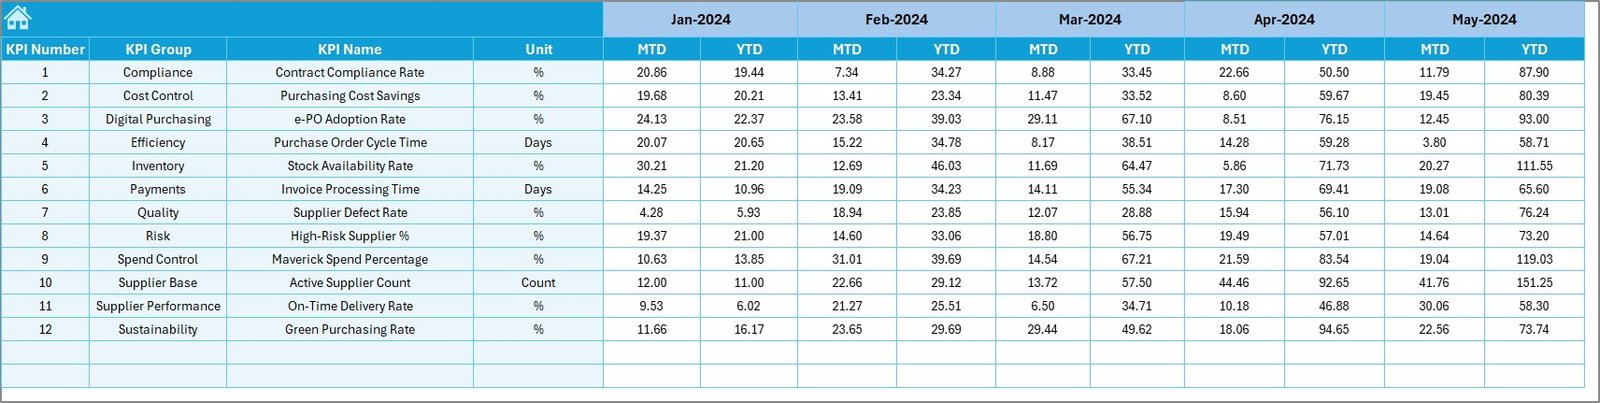
Actual Numbers Input Sheet
The Actual Numbers Input Sheet allows users to enter real purchasing data.
Here, users input MTD and YTD actual numbers for each KPI.
Important features of this sheet include:
- Month selection from range E1
- Ability to set the first month of the year
- Simple data entry structure
- Automatic linkage to dashboard visuals
Because of this design, users avoid formula errors and save time.
Click to buy Clinic Purchasing KPI Dashboard in Excel
Target Sheet Tab
The Target Sheet Tab allows clinics to define expected performance.
Here, users enter MTD and YTD target values for each purchasing KPI.
Because targets remain visible throughout the dashboard, clinics can easily compare performance against goals. As a result, teams stay aligned and accountable.
Click to buy Clinic Purchasing KPI Dashboard in Excel
- Target Sheet Tab
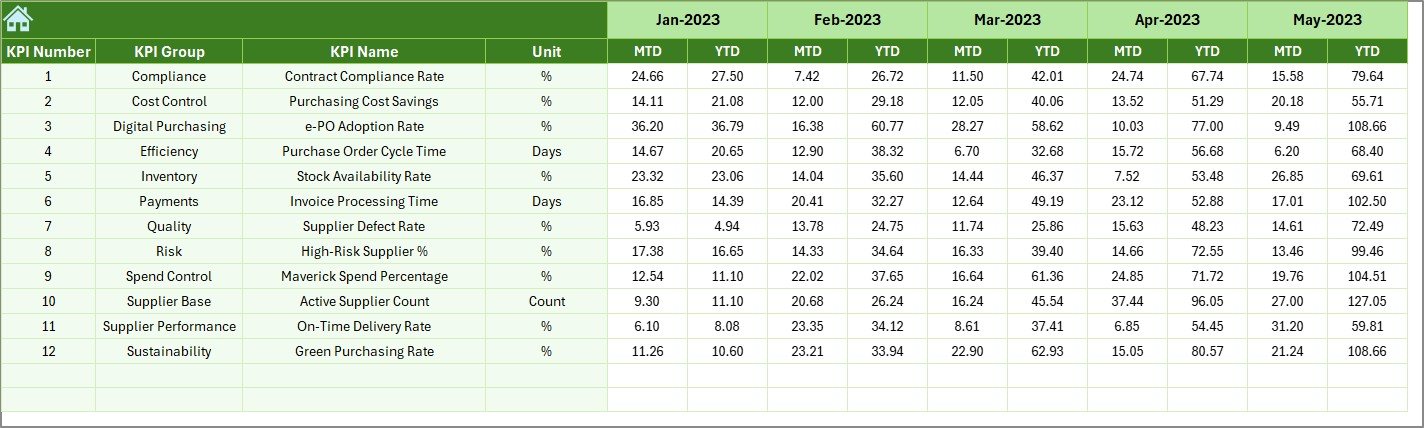
Previous Year Number Sheet
The Previous Year Number Sheet stores historical purchasing data.
Users enter the previous year’s MTD and YTD numbers, similar to current year inputs.
This sheet enables year-over-year comparison, which helps clinics:
- Identify growth patterns
- Detect cost overruns
- Measure long-term efficiency
Click to buy Clinic Purchasing KPI Dashboard in Excel
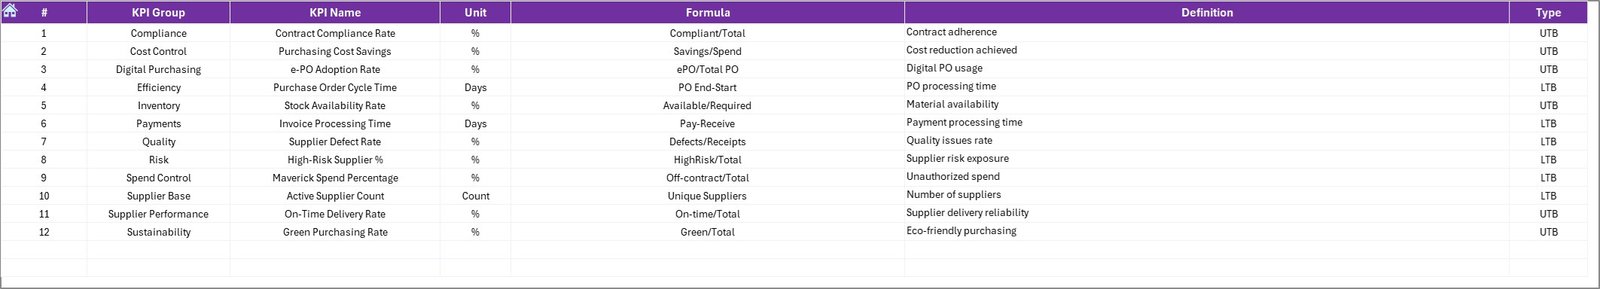
KPI Definition Sheet
The KPI Definition Sheet Tab acts as the foundation of the dashboard.
Here, users define:
- KPI Name
- KPI Group
- Unit of Measurement
- KPI Formula
- KPI Definition
Because of this structured definition, everyone in the clinic understands what each KPI measures and how it works.
What Key Purchasing KPIs Can Clinics Track Using This Dashboard?
Clinics can track multiple purchasing KPIs, such as:
- Total Purchasing Cost
- Cost Variance
- Budget Utilization
- Vendor Cost Efficiency
- Purchase Order Accuracy
- On-Time Procurement Rate
- Emergency Purchase Percentage
- Average Purchase Cost per Department
Because the dashboard remains customizable, clinics can add or modify KPIs as needed.
Advantages of Clinic Purchasing KPI Dashboard in Excel
Using a Clinic Purchasing KPI Dashboard in Excel offers many practical advantages.
- Centralized Purchasing Visibility
The dashboard consolidates all purchasing KPIs into one Excel file. As a result, clinics avoid confusion and save time.
- Better Cost Control
Because the dashboard highlights cost variance and budget gaps, clinics can control overspending effectively.
- Faster Decision-Making
With real-time updates and visuals, managers make faster and more confident decisions.
- Improved Accountability
Targets, actuals, and variances remain visible. Therefore, teams stay accountable.
- Easy to Use and Customize
Excel familiarity makes adoption quick. Clinics can customize KPIs without technical support.
- Cost-Effective Solution
Unlike BI tools, Excel dashboards require no additional software investment.
How Does This Dashboard Improve Clinic Purchasing Efficiency?
This dashboard improves efficiency by:
- Reducing manual reporting
- Eliminating calculation errors
- Highlighting issues early
- Supporting proactive decisions
- Aligning purchasing with financial goals
As a result, clinics improve both operational and financial performance.
Best Practices for the Clinic Purchasing KPI Dashboard in Excel
To get the best results, clinics should follow these best practices.
- Update Data Regularly
Regular updates ensure accurate insights and timely decisions.
- Define Clear KPIs
Clear definitions prevent confusion and improve KPI usage.
- Set Realistic Targets
Realistic targets motivate teams and support achievable goals.
- Review Trends Monthly
Monthly trend analysis helps clinics detect issues early.
- Train Key Users
Basic training ensures consistent data entry and analysis.
- Use Dashboard Insights in Meetings
When teams discuss dashboard insights, performance improves faster.
Who Can Benefit from a Clinic Purchasing KPI Dashboard in Excel?
This dashboard benefits:
- Clinic administrators
- Procurement teams
- Finance managers
- Operations managers
- Hospital purchasing departments
Any healthcare organization that wants better purchasing control can use this dashboard.
How Is This Dashboard Different from Traditional Purchasing Reports?
Traditional reports remain static and time-consuming. In contrast, this dashboard offers:
- Automated calculations
- Interactive filters
- Visual insights
- Real-time updates
Therefore, clinics move from reactive reporting to proactive management.
Conclusion: Why Every Clinic Needs a Purchasing KPI Dashboard in Excel
Clinic purchasing directly impacts costs, efficiency, and patient care. However, manual tracking limits visibility and increases risks.
A Clinic Purchasing KPI Dashboard in Excel solves these challenges by delivering centralized, visual, and actionable insights. Because it uses Excel, it remains accessible, flexible, and cost-effective.
If your clinic wants better cost control, transparency, and confident decision-making, this dashboard becomes an essential tool.
Frequently Asked Questions About Clinic Purchasing KPI Dashboard in Excel
- Is this dashboard suitable for small clinics?
Yes. Small clinics benefit greatly because the dashboard remains simple and scalable.
- Do I need advanced Excel skills to use it?
No. Basic Excel knowledge is enough to use the dashboard effectively.
- Can I customize KPIs in the dashboard?
Yes. The KPI Definition sheet allows easy customization.
- How often should I update the dashboard?
You should update it monthly or whenever purchasing data changes.
- Does this dashboard support year-over-year comparison?
Yes. The Previous Year sheet enables clear year-over-year analysis.
- Can multiple users work on the dashboard?
Yes. Clinics can share the file with controlled access.
Visit our YouTube channel to learn step-by-step video tutorials
Watch the step-by-step video tutorial:
Click to buy Clinic Purchasing KPI Dashboard in Excel