Managing purchasing operations in a refinery always demands precision, transparency, and fast decision-making. Because refinery purchasing involves high-value materials, long-term supplier contracts, strict compliance rules, and fluctuating prices, even a small oversight can create serious cost overruns. Therefore, refinery teams need a structured system that tracks performance clearly and consistently.
That is exactly why the Refinery Purchasing KPI Dashboard in Excel becomes a powerful and practical solution.
In this detailed and SEO-friendly article, you will learn what a Refinery Purchasing KPI Dashboard in Excel is, why refineries need it, how it works, its worksheet structure, key features, advantages, best practices, and frequently asked questions. By the end of this guide, you will clearly understand how this Excel dashboard helps purchasing managers, procurement teams, and refinery leadership gain control, visibility, and confidence in purchasing decisions.
Click to buy Refinery Purchasing KPI Dashboard in Excel
What Is a Refinery Purchasing KPI Dashboard in Excel?
A Refinery Purchasing KPI Dashboard in Excel is a structured and interactive reporting tool designed to track, analyze, and monitor key performance indicators related to refinery purchasing activities.
Instead of managing multiple disconnected spreadsheets, this dashboard consolidates all purchasing KPIs into one centralized Excel file. As a result, users can quickly evaluate monthly and yearly performance, compare actual results against targets, and identify trends without complex BI tools.
Moreover, because the dashboard works entirely in Microsoft Excel, teams can easily update data, customize KPIs, and share reports across departments.
Why Do Refineries Need a Purchasing KPI Dashboard?
Refinery purchasing operations remain complex by nature. Raw materials, spare parts, chemicals, and services often involve high volumes and large budgets. Therefore, refinery teams must monitor performance continuously.
Without a structured dashboard:
- Purchasing data stays scattered
- Performance visibility drops
- Decisions become reactive
- Cost control weakens
However, a Refinery Purchasing KPI Dashboard in Excel solves these challenges effectively.
Key Reasons Refineries Use Purchasing KPI Dashboards
- To monitor cost efficiency and savings
- To track supplier and contract performance
- To compare actual vs target purchasing results
- To identify monthly and yearly trends
- To support data-driven purchasing decisions
How Does a Refinery Purchasing KPI Dashboard in Excel Work?
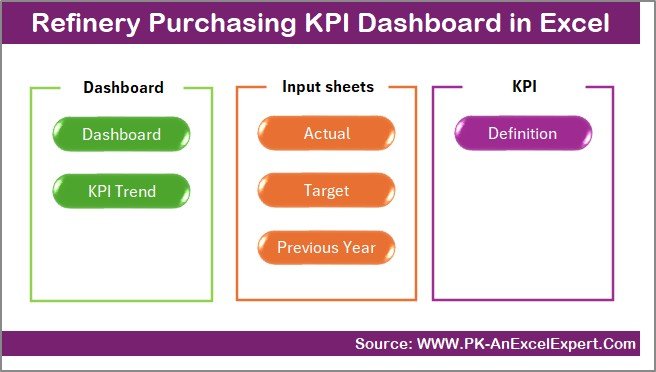
The dashboard follows a simple yet powerful workflow. First, users enter actual, target, and previous-year data in dedicated input sheets. Next, the dashboard automatically calculates KPIs using predefined formulas. Finally, charts, tables, and indicators update dynamically.
Because of this structure, users avoid manual calculations and reduce reporting errors. At the same time, decision-makers receive accurate insights instantly.
What Are the Key Features of the Refinery Purchasing KPI Dashboard in Excel?
This dashboard comes with a well-structured design and seven dedicated worksheets. Each worksheet plays a specific role in analysis and reporting.
Summary Page
The Summary Page works as an index sheet and navigation hub.
Key Highlights of the Summary Page
- Acts as a landing page for the dashboard
- Contains 6 navigation buttons
- Allows quick movement between worksheets
- Improves usability and user experience
Because of this design, users save time and access the required section instantly.
Click to buy Refinery Purchasing KPI Dashboard in Excel
the Dashboard
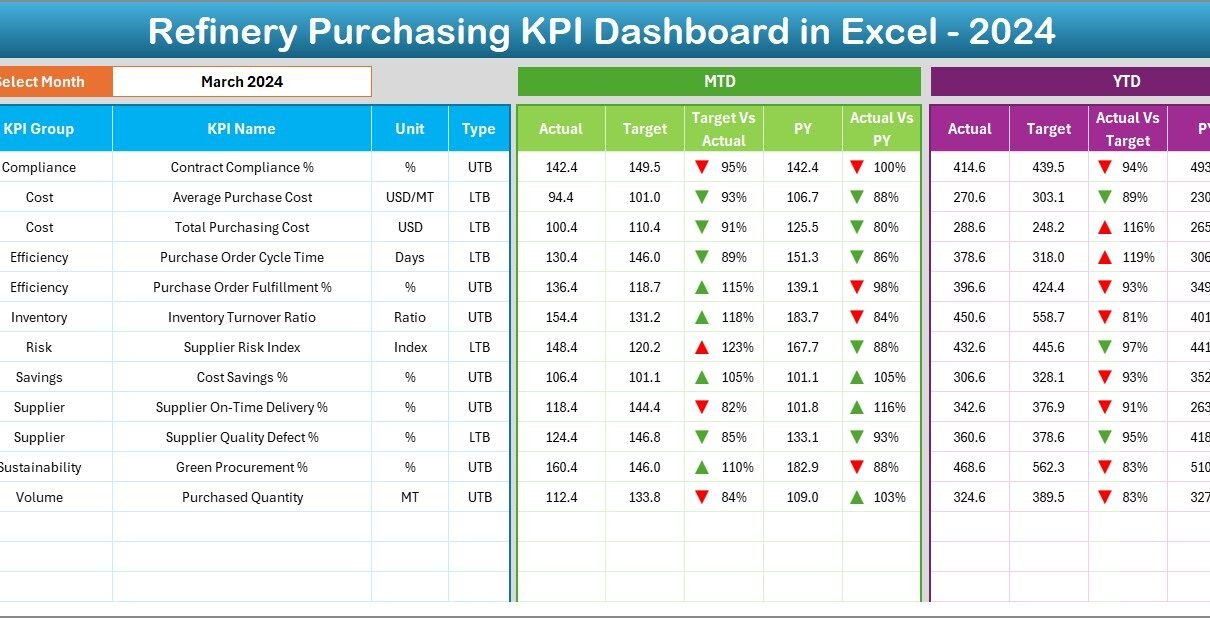
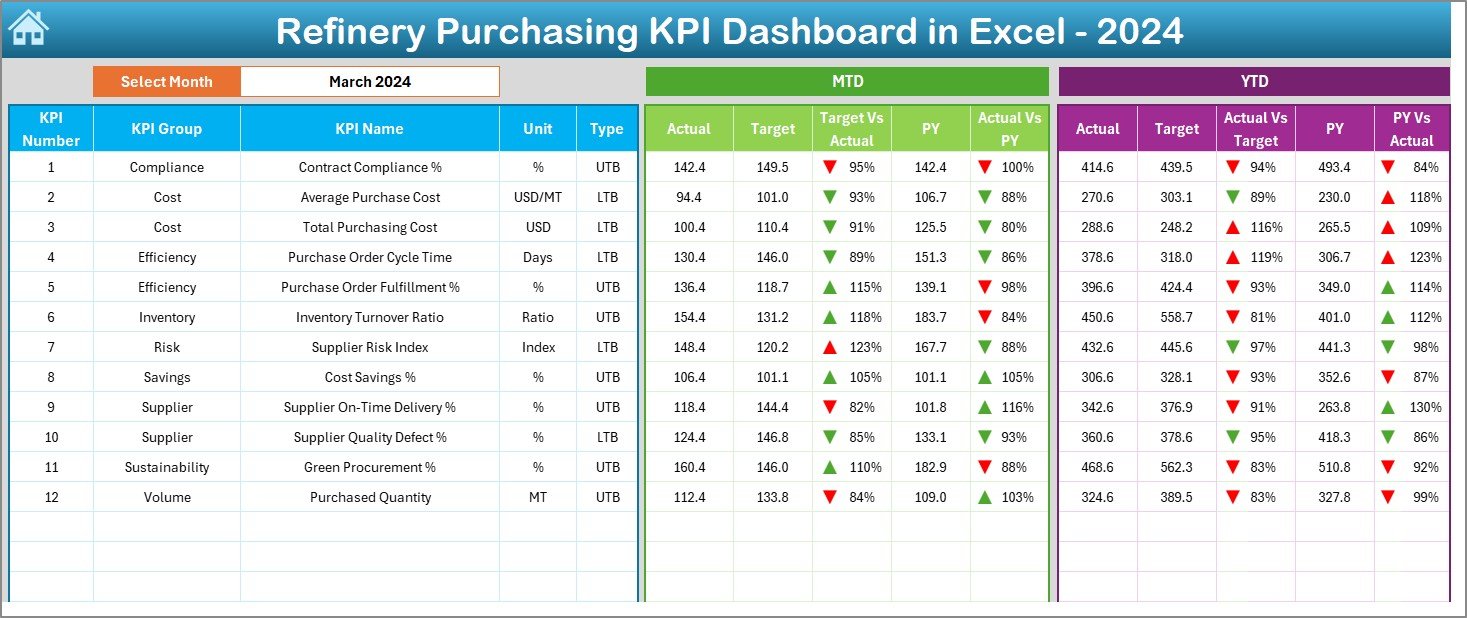
The Dashboard Sheet represents the core of the Refinery Purchasing KPI Dashboard in Excel.
Key Functionalities of the Dashboard Sheet
- Displays all purchasing KPIs in one view
- Month selection available in cell D3
- Automatically updates all numbers based on selected month
KPIs Displayed on the Dashboard
- MTD Actual, Target, and Previous Year
- Target vs Actual comparison
- Previous Year vs Actual comparison
- Conditional formatting with up and down arrows
Additionally, the dashboard shows:
- YTD Actual, Target, and Previous Year
- YTD Target vs Actual
- YTD PY vs Actual
As a result, users gain both short-term and long-term performance visibility.
Click to buy Refinery Purchasing KPI Dashboard in Excel
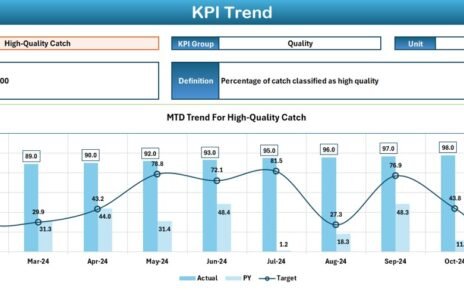
Trend Sheet Important?
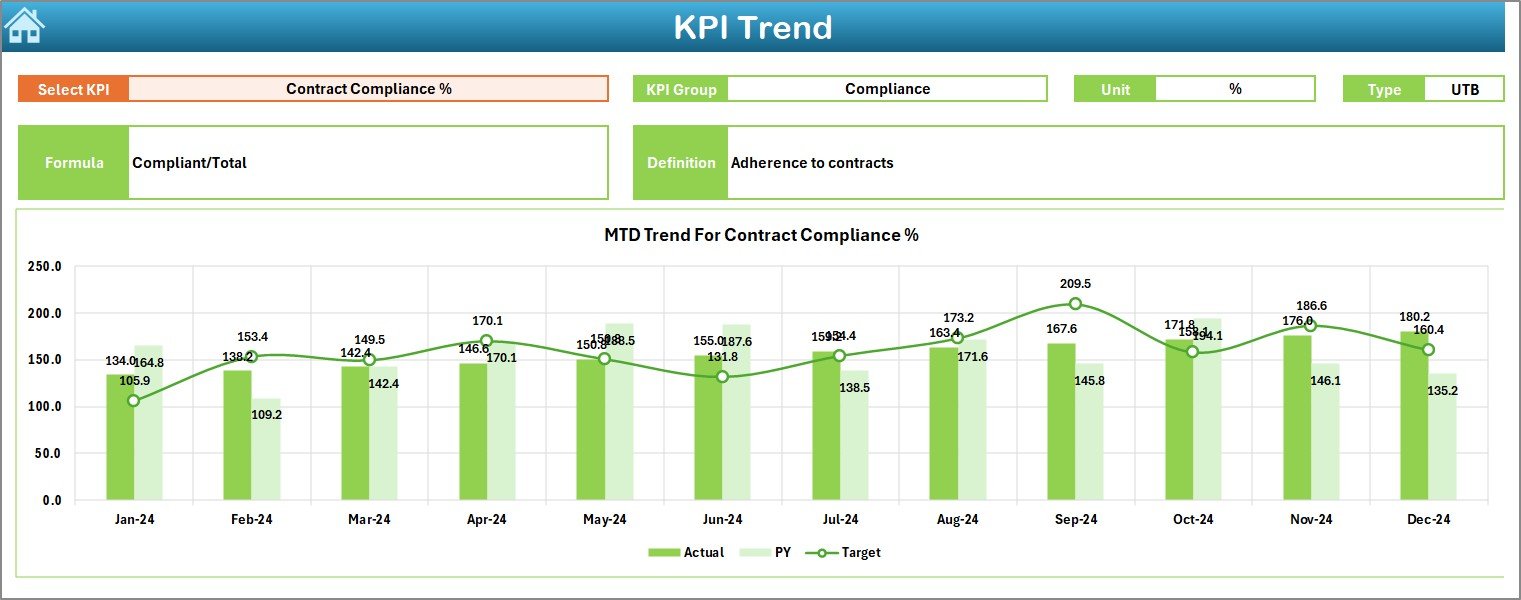
The Trend Sheet focuses on KPI-level analysis over time.
Key Features of the Trend Sheet
- KPI selection dropdown in cell C3
Displays:
KPI Group
KPI Unit
KPI Type (Lower is Better / Upper is Better)
KPI Formula
KPI Definition
Trend Analysis Included
- MTD trend chart for:
Actual
Target
Previous Year
YTD trend chart for:
Actual
Target
Previous Year
Therefore, users can easily identify improving or declining performance patterns.
Click to buy Refinery Purchasing KPI Dashboard in Excel
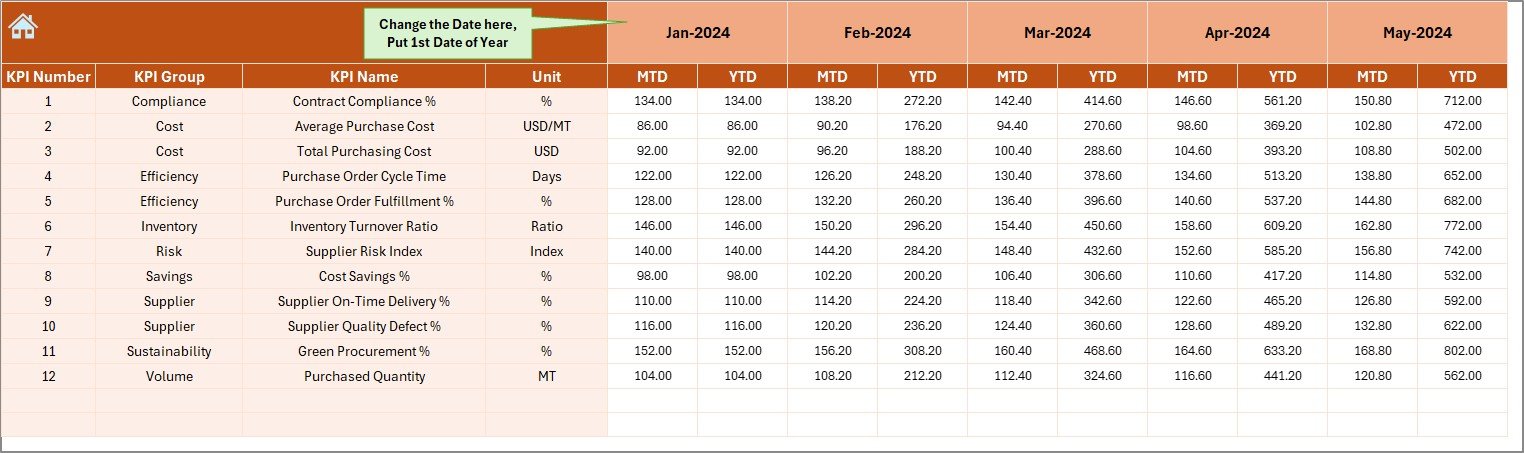
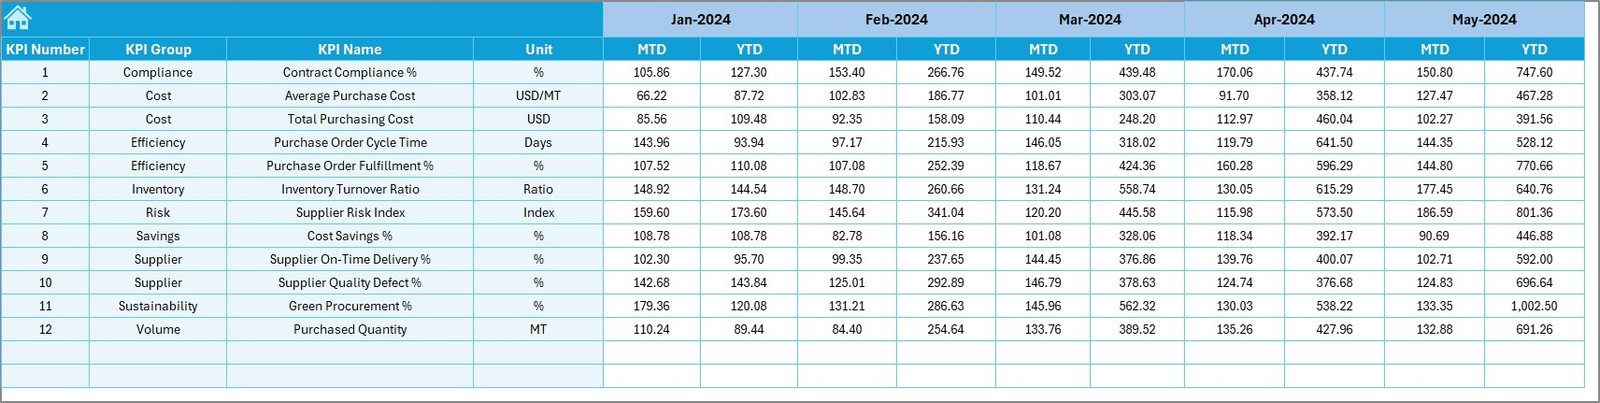
Actual Numbers Input Sheet
The Actual Numbers Input Sheet allows users to enter real purchasing data.
Key Functions
- Enter MTD and YTD actual numbers
- Month control available in cell E1
- Users define the first month of the year
- Supports flexible monthly updates
Because of this design, data entry stays simple and structured.
Click to buy Refinery Purchasing KPI Dashboard in Excel
the Target Sheet
The Target Sheet stores planned performance values.
Key Highlights
- Enter MTD and YTD target numbers
- Set clear purchasing goals for each KPI
- Enables direct comparison with actual results
As a result, purchasing teams can track goal achievement effectively.
Click to buy Refinery Purchasing KPI Dashboard in Excel
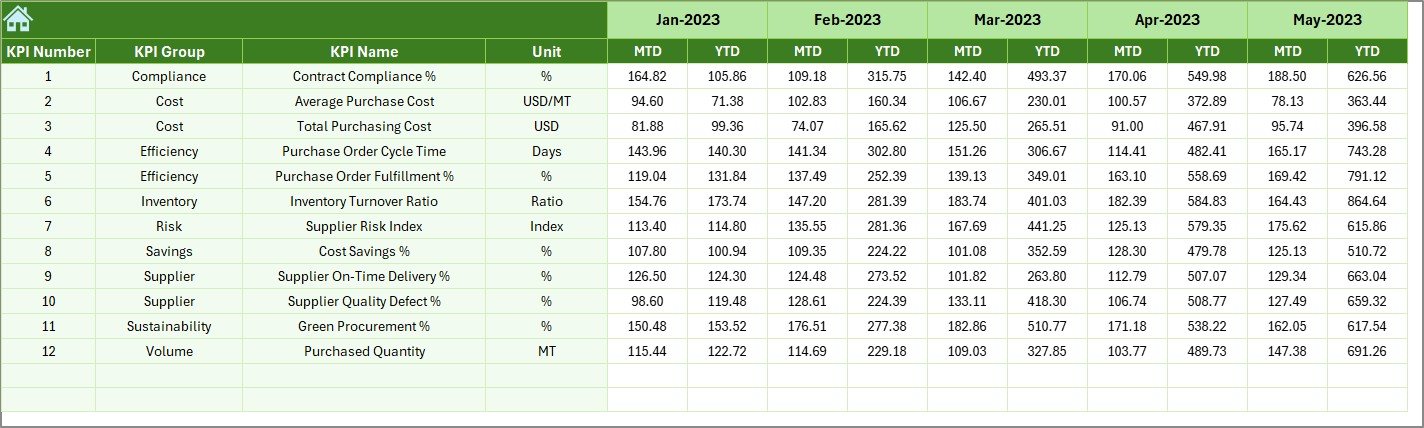
Previous Year Number Sheet
The Previous Year Number Sheet stores historical data.
Key Benefits
- Enter previous year MTD and YTD values
- Compare current performance against historical benchmarks
- Identify long-term improvement or decline
This comparison strengthens strategic planning and forecasting.
Click to buy Refinery Purchasing KPI Dashboard in Excel
KPI Definition Sheet
The KPI Definition Sheet acts as a reference guide.
Information Included
- KPI Name
- KPI Group
- KPI Unit
- KPI Formula
- KPI Definition
Because of this sheet, all users understand KPIs clearly and consistently.

Click to buy Refinery Purchasing KPI Dashboard in Excel
What KPIs Can You Track in a Refinery Purchasing Dashboard?
Although the dashboard supports customization, refineries commonly track:
- Purchase Cost Variance
- Cost Savings
- Supplier On-Time Delivery
- Purchase Order Cycle Time
- Contract Compliance Rate
- Emergency Purchase Percentage
- Budget Utilization
Therefore, the dashboard adapts easily to refinery-specific purchasing needs.
Advantages of the Refinery Purchasing KPI Dashboard in Excel
Using a Refinery Purchasing KPI Dashboard in Excel offers several strong advantages.
Key Advantages
- Centralized KPI Monitoring
- Faster Decision-Making
- Improved Cost Control
- Clear MTD and YTD Performance Tracking
- Better Visibility into Trends
- Reduced Manual Calculations
- Easy for Non-Technical Users
- No Need for Expensive BI Tools
As a result, refinery purchasing teams operate with more confidence and clarity.
How Does This Dashboard Improve Purchasing Decision-Making?
Because the dashboard updates dynamically, decision-makers always work with current data. Moreover, visual indicators highlight performance gaps immediately. Therefore, teams can take corrective actions before issues escalate.
Who Can Benefit from a Refinery Purchasing KPI Dashboard in Excel?
This dashboard benefits a wide range of users.
Key Users
- Purchasing Managers
- Procurement Teams
- Supply Chain Analysts
- Finance Teams
- Refinery Operations Managers
- Senior Management
Each group gains actionable insights tailored to their decision needs.
Best Practices for the Refinery Purchasing KPI Dashboard in Excel
To get maximum value, users should follow proven best practices.
Best Practices
- Define clear and measurable KPIs
- Update actual data regularly
- Review MTD performance monthly
- Analyze YTD trends quarterly
- Validate target values annually
- Maintain accurate previous year data
- Train users on KPI definitions
- Keep formulas protected to avoid errors
Following these practices ensures reliable insights and long-term dashboard success.
How Can You Customize the Refinery Purchasing KPI Dashboard?
Excel flexibility allows easy customization.
Customization Options
- Add or remove KPIs
- Change KPI formulas
- Modify target benchmarks
- Adjust chart designs
- Add slicers or filters
Therefore, the dashboard evolves with changing refinery requirements.
What Makes Excel a Strong Choice for Refinery KPI Dashboards?
Excel remains widely available and familiar. Moreover, it supports formulas, charts, conditional formatting, and automation. Because of this, Excel dashboards deliver strong analytical power without steep learning curves.
Common Challenges Solved by This Dashboard
This dashboard addresses several common purchasing challenges.
- Lack of performance visibility
- Manual reporting delays
- Data inconsistency
- Poor KPI alignment
- Reactive decision-making
As a result, refinery purchasing operations become proactive and data-driven.
Conclusion
A Refinery Purchasing KPI Dashboard in Excel transforms complex purchasing data into clear, actionable insights. By centralizing KPIs, automating calculations, and presenting trends visually, this dashboard empowers refinery teams to control costs, improve efficiency, and strengthen supplier performance.
Because the dashboard works entirely in Excel, it remains accessible, flexible, and cost-effective. When teams follow best practices and maintain accurate data, this dashboard becomes a reliable decision-support tool for both daily operations and long-term strategy.
Frequently Asked Questions (FAQs)
What is a Refinery Purchasing KPI Dashboard in Excel?
A Refinery Purchasing KPI Dashboard in Excel is a structured Excel tool that tracks, analyzes, and visualizes key purchasing performance indicators for refinery operations.
Can I customize the KPIs in the dashboard?
Yes, users can easily customize KPIs, formulas, targets, and charts based on refinery-specific requirements.
Does the dashboard support monthly and yearly analysis?
Yes, the dashboard provides both MTD (Month-to-Date) and YTD (Year-to-Date) performance analysis.
Do I need advanced Excel skills to use this dashboard?
No, basic Excel knowledge is enough to update data and review insights.
Can multiple users use the dashboard?
Yes, teams can share the Excel file and collaborate while maintaining data accuracy.
How often should I update the data?
Teams should update actual numbers monthly for accurate tracking and insights.
Visit our YouTube channel to learn step-by-step video tutorials
Watch the step-by-step video tutorial:
Click to buy Refinery Purchasing KPI Dashboard in Excel