Electricity purchasing is one of the most critical cost areas for organizations that operate plants, facilities, utilities, and large infrastructure. Every unit of electricity involves multiple cost components such as base purchase cost, transmission charges, taxes, and energy source variations. Therefore, managing electricity purchasing using static spreadsheets or manual reports often leads to delayed insights and poor cost control.
That is exactly why the Electricity Purchasing Dashboard in Power BI becomes a powerful and modern solution.
In this detailed and SEO-friendly blog post, you will learn everything about the Electricity Purchasing Dashboard in Power BI. You will understand what it is, how it works, its page structure, key features, advantages, best practices, and frequently asked questions. By the end, you will clearly see how this dashboard helps organizations gain real-time visibility, cost transparency, and confident decision-making.
Click to Purchases Electricity Purchasing Dashboard in Power BI
What Is an Electricity Purchasing Dashboard in Power BI?
An Electricity Purchasing Dashboard in Power BI is an interactive and visual reporting solution designed to track, analyze, and monitor electricity purchasing data in real time. Instead of reviewing raw data tables, the dashboard converts complex electricity cost and consumption data into dynamic visuals, KPIs, and trends.
Because the dashboard is built using Microsoft Power BI, it offers advanced filtering, fast performance, and interactive analysis. At the same time, it remains user-friendly for business users.
This dashboard helps answer important questions such as:
-
What is the total gross electricity cost?
-
How much tax do we pay on electricity purchases?
-
What is the net purchase cost after all deductions?
-
Which utility providers drive higher costs?
-
How do transmission charges vary by location?
-
What is the tax impact percentage across utilities and months?
-
How much electricity comes from renewable sources?
Why Do Organizations Need an Electricity Purchasing Dashboard in Power BI?
Electricity purchasing data changes frequently. Costs fluctuate, consumption varies by location, and tax structures evolve over time. Therefore, static reports quickly become outdated.
Organizations need an Electricity Purchasing Dashboard in Power BI because it:
-
Provides real-time and interactive insights
-
Centralizes electricity purchasing data
-
Improves cost transparency and accountability
-
Highlights tax and transmission impact clearly
-
Supports faster and data-driven decisions
As a result, management teams gain control over electricity spend and reduce financial risk.
Click to Purchases Electricity Purchasing Dashboard in Power BI
Key Features of the Electricity Purchasing Dashboard in Power BI
The Electricity Purchasing Dashboard in Power BI is designed with a clean layout and structured analytics. Let us explore its key features step by step.
Dashboard Structure – 5 Analytical Pages Explained
The Electricity Purchasing Dashboard in Power BI includes 5 analytical pages, each focused on a specific area of electricity purchasing analysis.
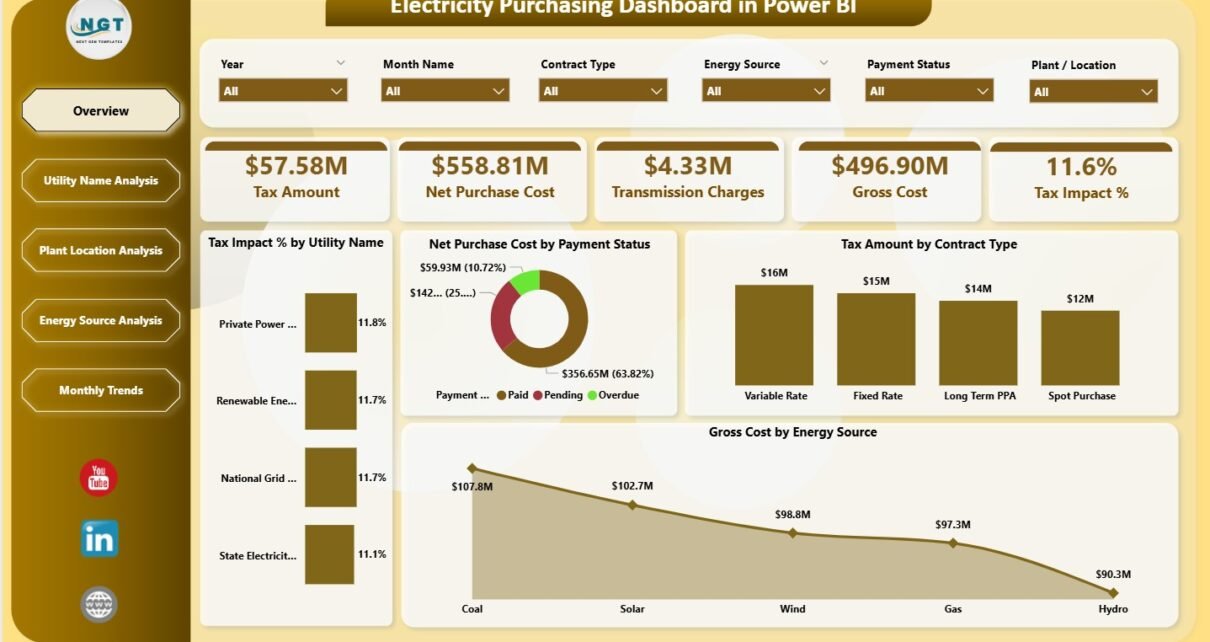
1. Overview Page – What Is Our Overall Electricity Purchasing Performance?

The Overview Page provides a high-level snapshot of electricity purchasing performance. It acts as the starting point for management and finance teams.
KPI Cards on the Overview Page
The Overview Page includes 5 KPI cards that summarize key electricity purchasing metrics:
-
Tax Amount – Shows total tax paid on electricity purchases
-
Net Purchase Cost – Displays actual electricity cost excluding taxes
-
Transmission Charges – Highlights electricity transmission expenses
-
Gross Cost – Shows total electricity cost including all charges
-
Tax Impact % – Indicates how much tax affects overall cost
These KPI cards allow decision-makers to understand cost structure instantly.
Charts on the Overview Page
The Overview Page also includes 4 insightful charts:
-
Tax Impact % by Utility Name – Identifies utilities with higher tax burden
-
Net Purchase Cost by Payment Status – Shows cost based on payment conditions
-
Tax Amount by Contract Type – Highlights tax distribution across contracts
-
Gross Cost by Energy Source – Compares cost across energy types
Together, these visuals provide a complete overview of electricity purchasing health.
2. Utility Name Analysis – Which Utility Providers Drive Higher Costs?
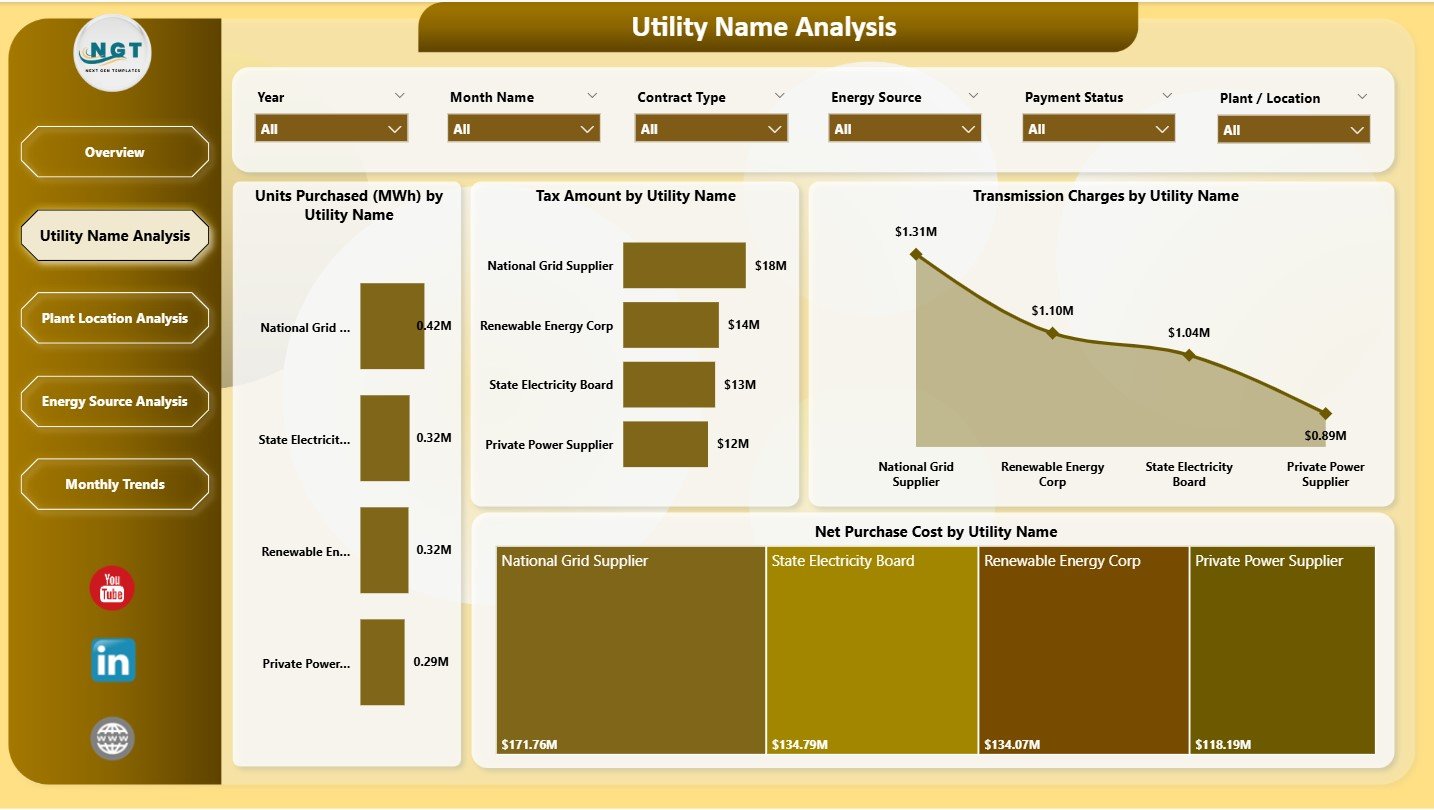
The Utility Name Analysis Page focuses on analyzing electricity purchasing performance by utility provider.
Key Charts on Utility Name Analysis Page
This page includes 4 detailed charts:
-
Units Purchased (MWh) by Utility Name – Shows electricity volume per utility
-
Tax Amount by Utility Name – Highlights tax contribution by utility
-
Transmission Charges by Utility Name – Identifies utilities with high transmission costs
-
Net Purchase Cost by Utility Name – Compares actual spend across utilities
As a result, procurement teams can evaluate utility performance and negotiate better contracts.
3. Plant Location Analysis – How Does Electricity Cost Vary by Location?
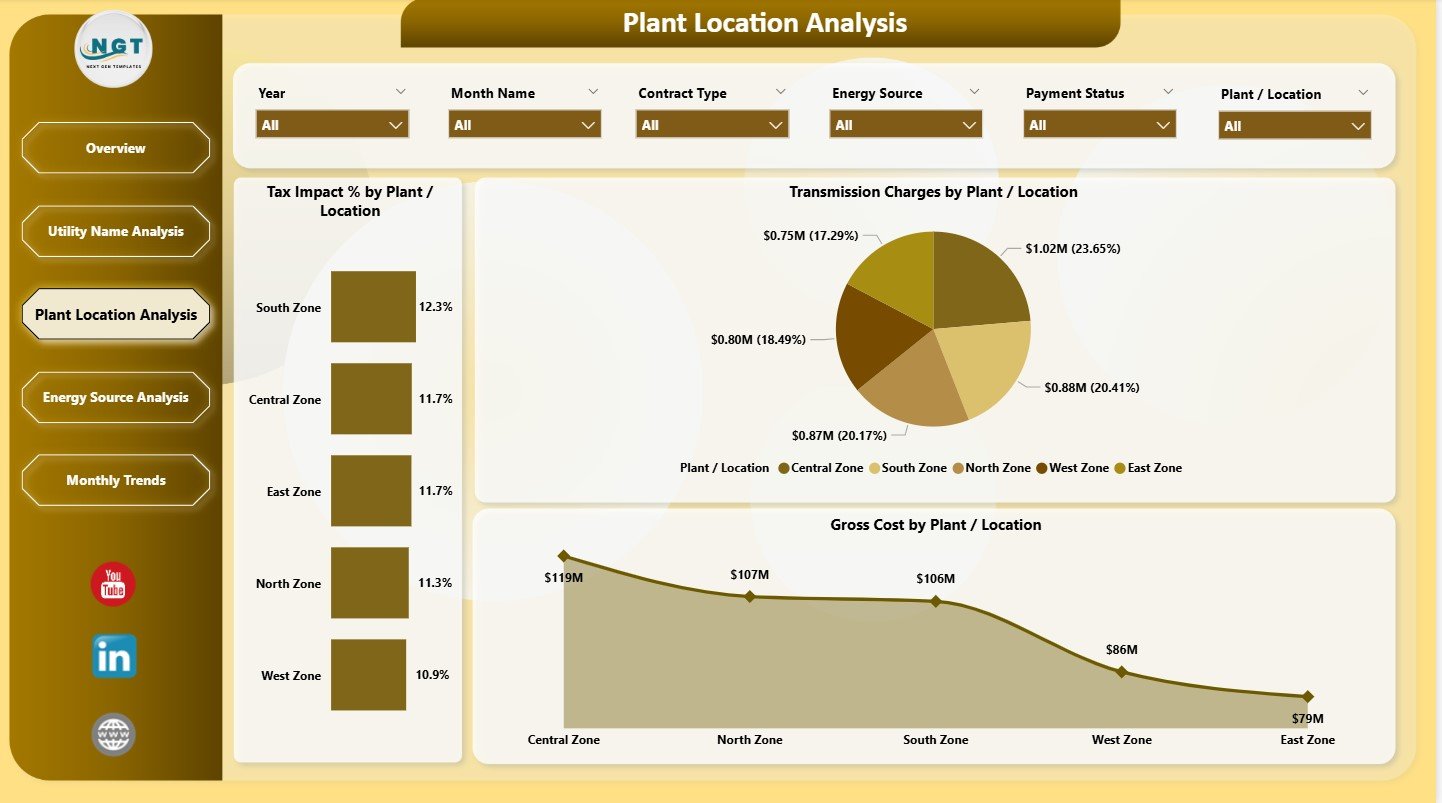
Electricity costs often vary by plant or facility due to tariffs, transmission distance, and consumption patterns. Therefore, location-based analysis becomes essential.
Key Charts on Plant Location Analysis Page
This page includes 3 focused charts:
-
Tax Impact % by Plant/Location – Highlights tax burden across sites
-
Transmission Charges by Plant/Location – Identifies high transmission cost locations
-
Gross Cost by Plant/Location – Shows total electricity cost per site
Because of this analysis, organizations can identify high-cost plants and implement targeted cost-saving measures.
4. Energy Source Analysis – How Does Energy Mix Affect Electricity Cost?
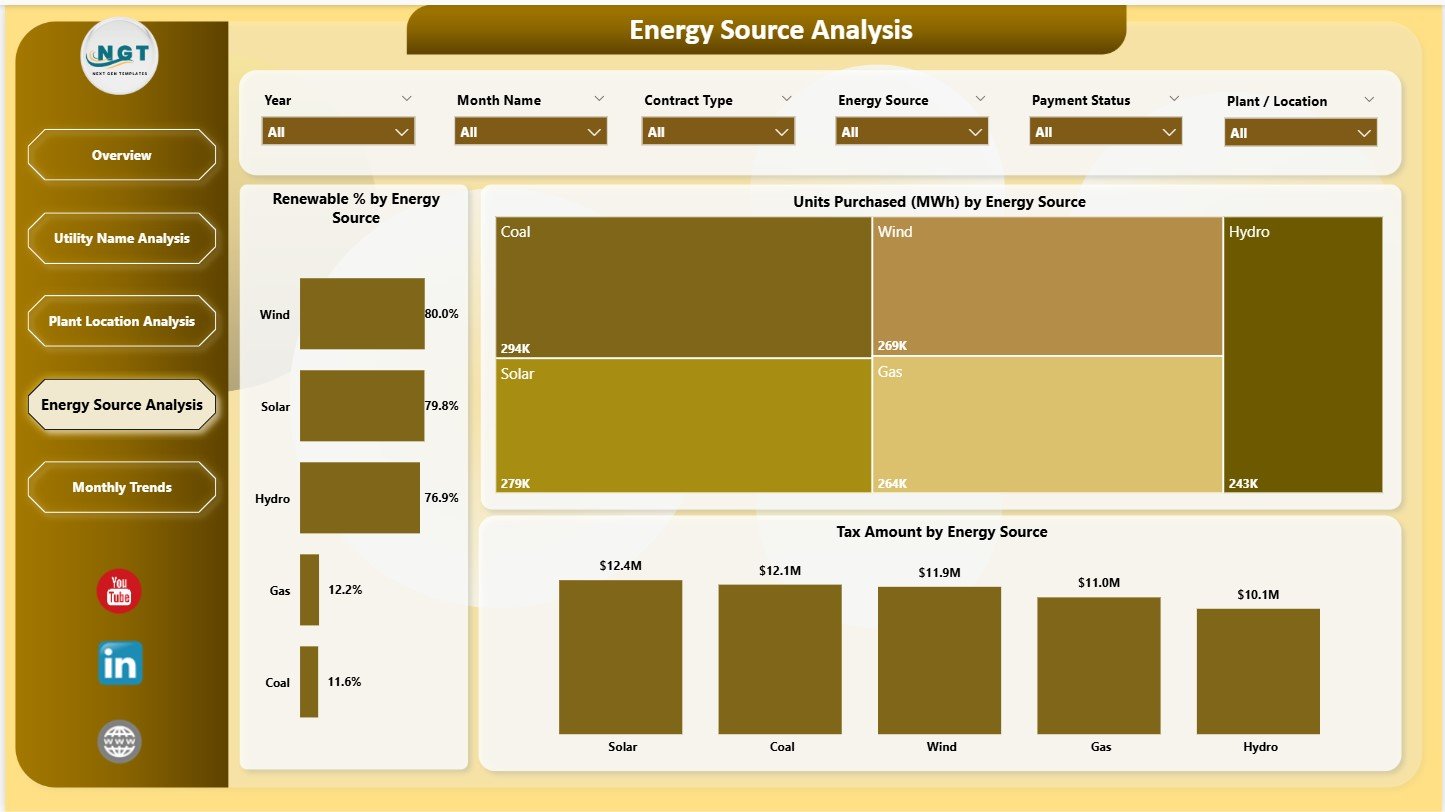
Energy source plays a major role in electricity cost, tax, and sustainability reporting. Therefore, understanding energy mix becomes critical.
Key Charts on Energy Source Analysis Page
This page includes 3 insightful charts:
-
Renewable % by Energy Source – Tracks renewable energy contribution
-
Units Purchased (MWh) by Energy Source – Shows consumption by energy type
-
Tax Amount by Energy Source – Compares tax levels across energy sources
This analysis supports sustainability goals and renewable energy planning.
Click to Purchases Electricity Purchasing Dashboard in Power BI
5. Monthly Trends – How Does Electricity Purchasing Change Over Time?
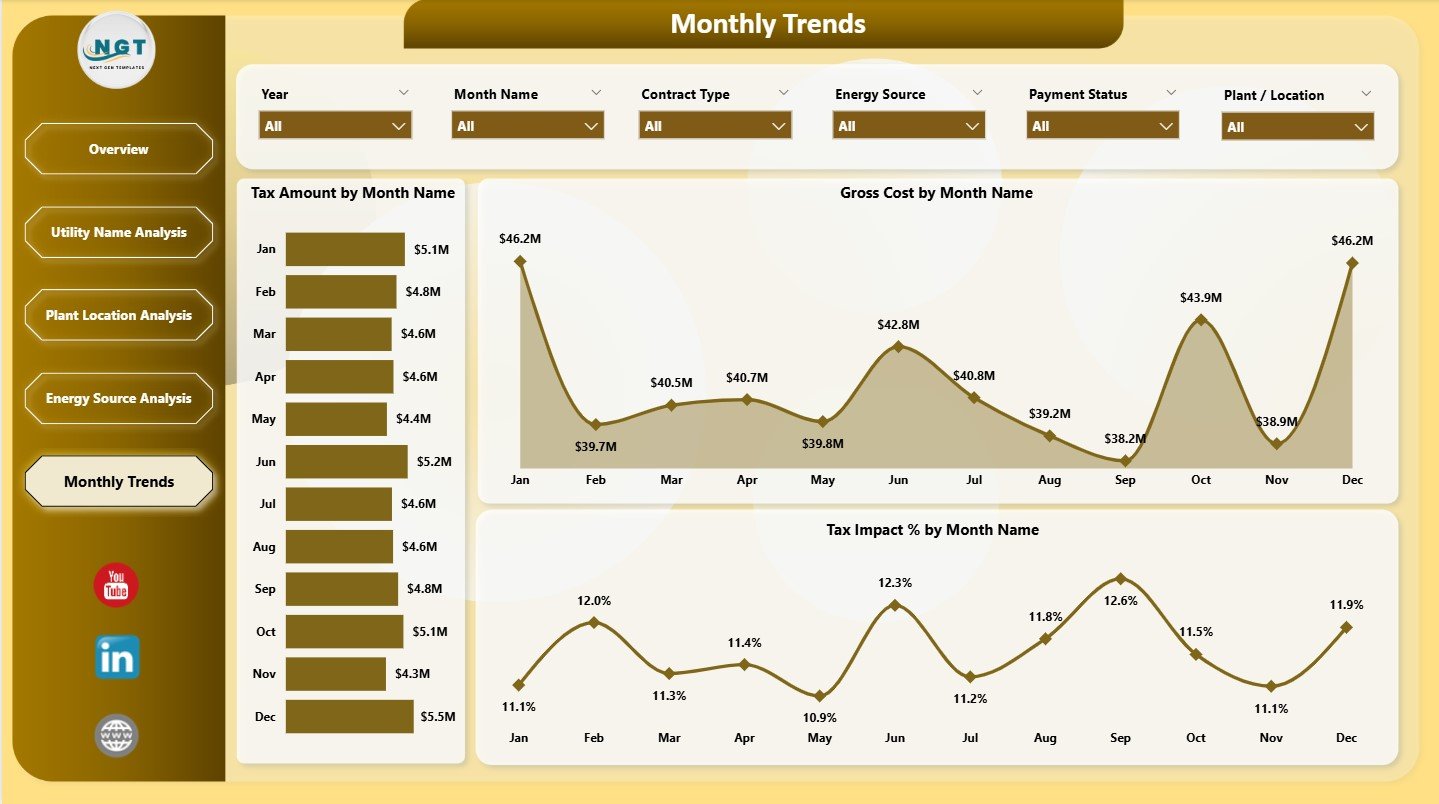
The Monthly Trends Page focuses on time-based analysis of electricity purchasing data.
Key Charts on Monthly Trends Page
This page includes 3 trend charts:
-
Tax Amount by Month – Tracks monthly tax fluctuations
-
Gross Cost by Month – Shows monthly electricity spending
-
Tax Impact % by Month – Highlights tax burden changes over time
These trends help finance teams with budgeting, forecasting, and seasonal analysis.
Advantages of Electricity Purchasing Dashboard in Power BI
1. Real-Time and Interactive Analysis
Power BI enables interactive filtering and real-time insights, which improve decision speed.
2. Centralized Electricity Cost Monitoring
All electricity purchasing data stays in one dashboard instead of multiple reports.
3. Improved Cost Transparency
Users clearly see gross cost, net cost, transmission charges, and tax impact.
4. Better Utility and Location Analysis
Utility-wise and location-wise insights support cost optimization.
5. Renewable Energy and Sustainability Tracking
Energy source analysis helps monitor renewable energy usage.
6. Scalable and Secure Platform
Power BI supports large datasets and enterprise-level security.
7. Data-Driven Decision Making
Visual insights improve planning, control, and accountability.
Best Practices for the Electricity Purchasing Dashboard in Power BI
1. Maintain Clean and Structured Data
Accurate source data ensures reliable Power BI insights.
2. Refresh Data Regularly
Schedule regular data refresh to keep insights up to date.
3. Use Consistent Naming Conventions
Standardize utility, plant, and energy source names.
4. Monitor Tax Impact Closely
Track tax impact percentage to detect abnormal changes early.
5. Leverage Filters and Slicers
Use slicers to drill down into utilities, locations, or months.
6. Align with Sustainability Goals
Track renewable percentage to support ESG initiatives.
7. Share Insights with Stakeholders
Use Power BI sharing features to distribute insights securely.
Click to Purchases Electricity Purchasing Dashboard in Power BI
Who Can Benefit from an Electricity Purchasing Dashboard in Power BI?
This dashboard supports a wide range of stakeholders, including:
-
Energy and utility managers
-
Procurement and purchasing teams
-
Finance and accounting professionals
-
Sustainability and ESG teams
-
Plant and operations managers
-
Senior management and executives
Conclusion – Why the Electricity Purchasing Dashboard in Power BI Is Essential
Electricity purchasing directly impacts operational cost, sustainability, and profitability. Therefore, organizations must move beyond static reports and adopt interactive analytics.
The Electricity Purchasing Dashboard in Power BI delivers real-time visibility, cost transparency, and actionable insights. It helps organizations monitor electricity spend, control tax impact, analyze utilities, and track renewable energy usage effectively.
If your organization wants smarter, faster, and more confident electricity purchasing decisions, this Power BI dashboard becomes an essential solution.
Frequently Asked Questions (FAQs)
What is an Electricity Purchasing Dashboard in Power BI?
It is a Power BI dashboard that analyzes electricity purchasing cost, tax impact, utilities, locations, energy sources, and trends.
Who should use this dashboard?
Energy managers, procurement teams, finance professionals, and operations leaders benefit the most.
Can this dashboard handle large datasets?
Yes, Power BI efficiently handles large and complex electricity purchasing datasets.
Does it support renewable energy analysis?
Yes, the Energy Source Analysis page tracks renewable percentage and consumption.
How often should the dashboard be refreshed?
You should refresh data daily, weekly, or monthly depending on data availability.
Do I need Power BI expertise to use it?
No, end users can interact with the dashboard easily without technical expertise.
Can this dashboard support budgeting and forecasting?
Yes, monthly trends support cost forecasting and financial planning.
Click to Purchases Electricity Purchasing Dashboard in Power BI
Visit our YouTube channel to learn step-by-step video tutorials